How We Know About the Floe
Discovering the Birthplace of the MOSAiC Ice Floe
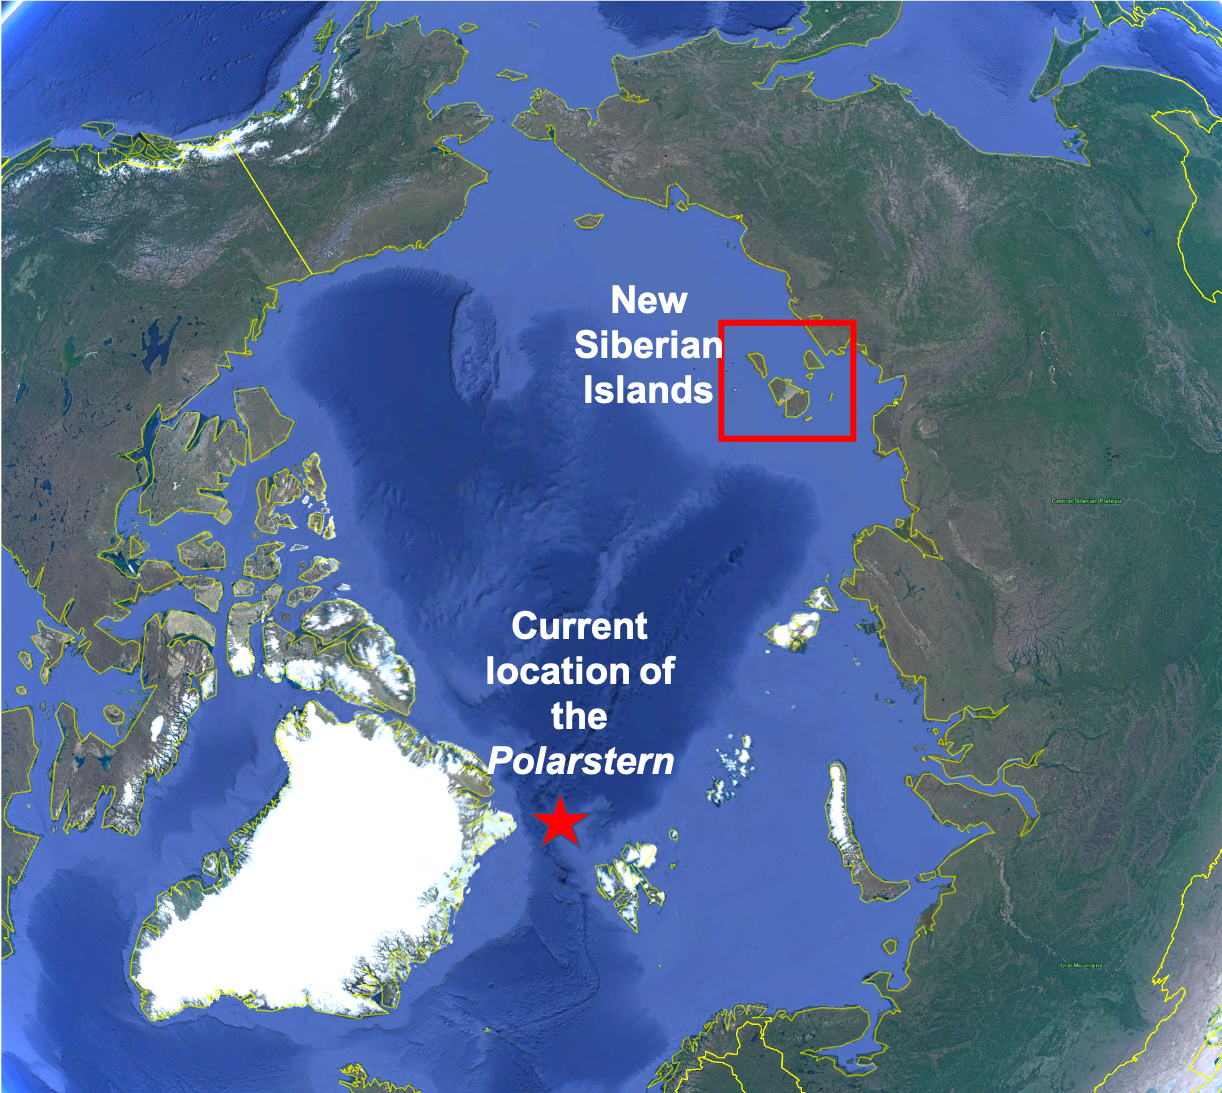
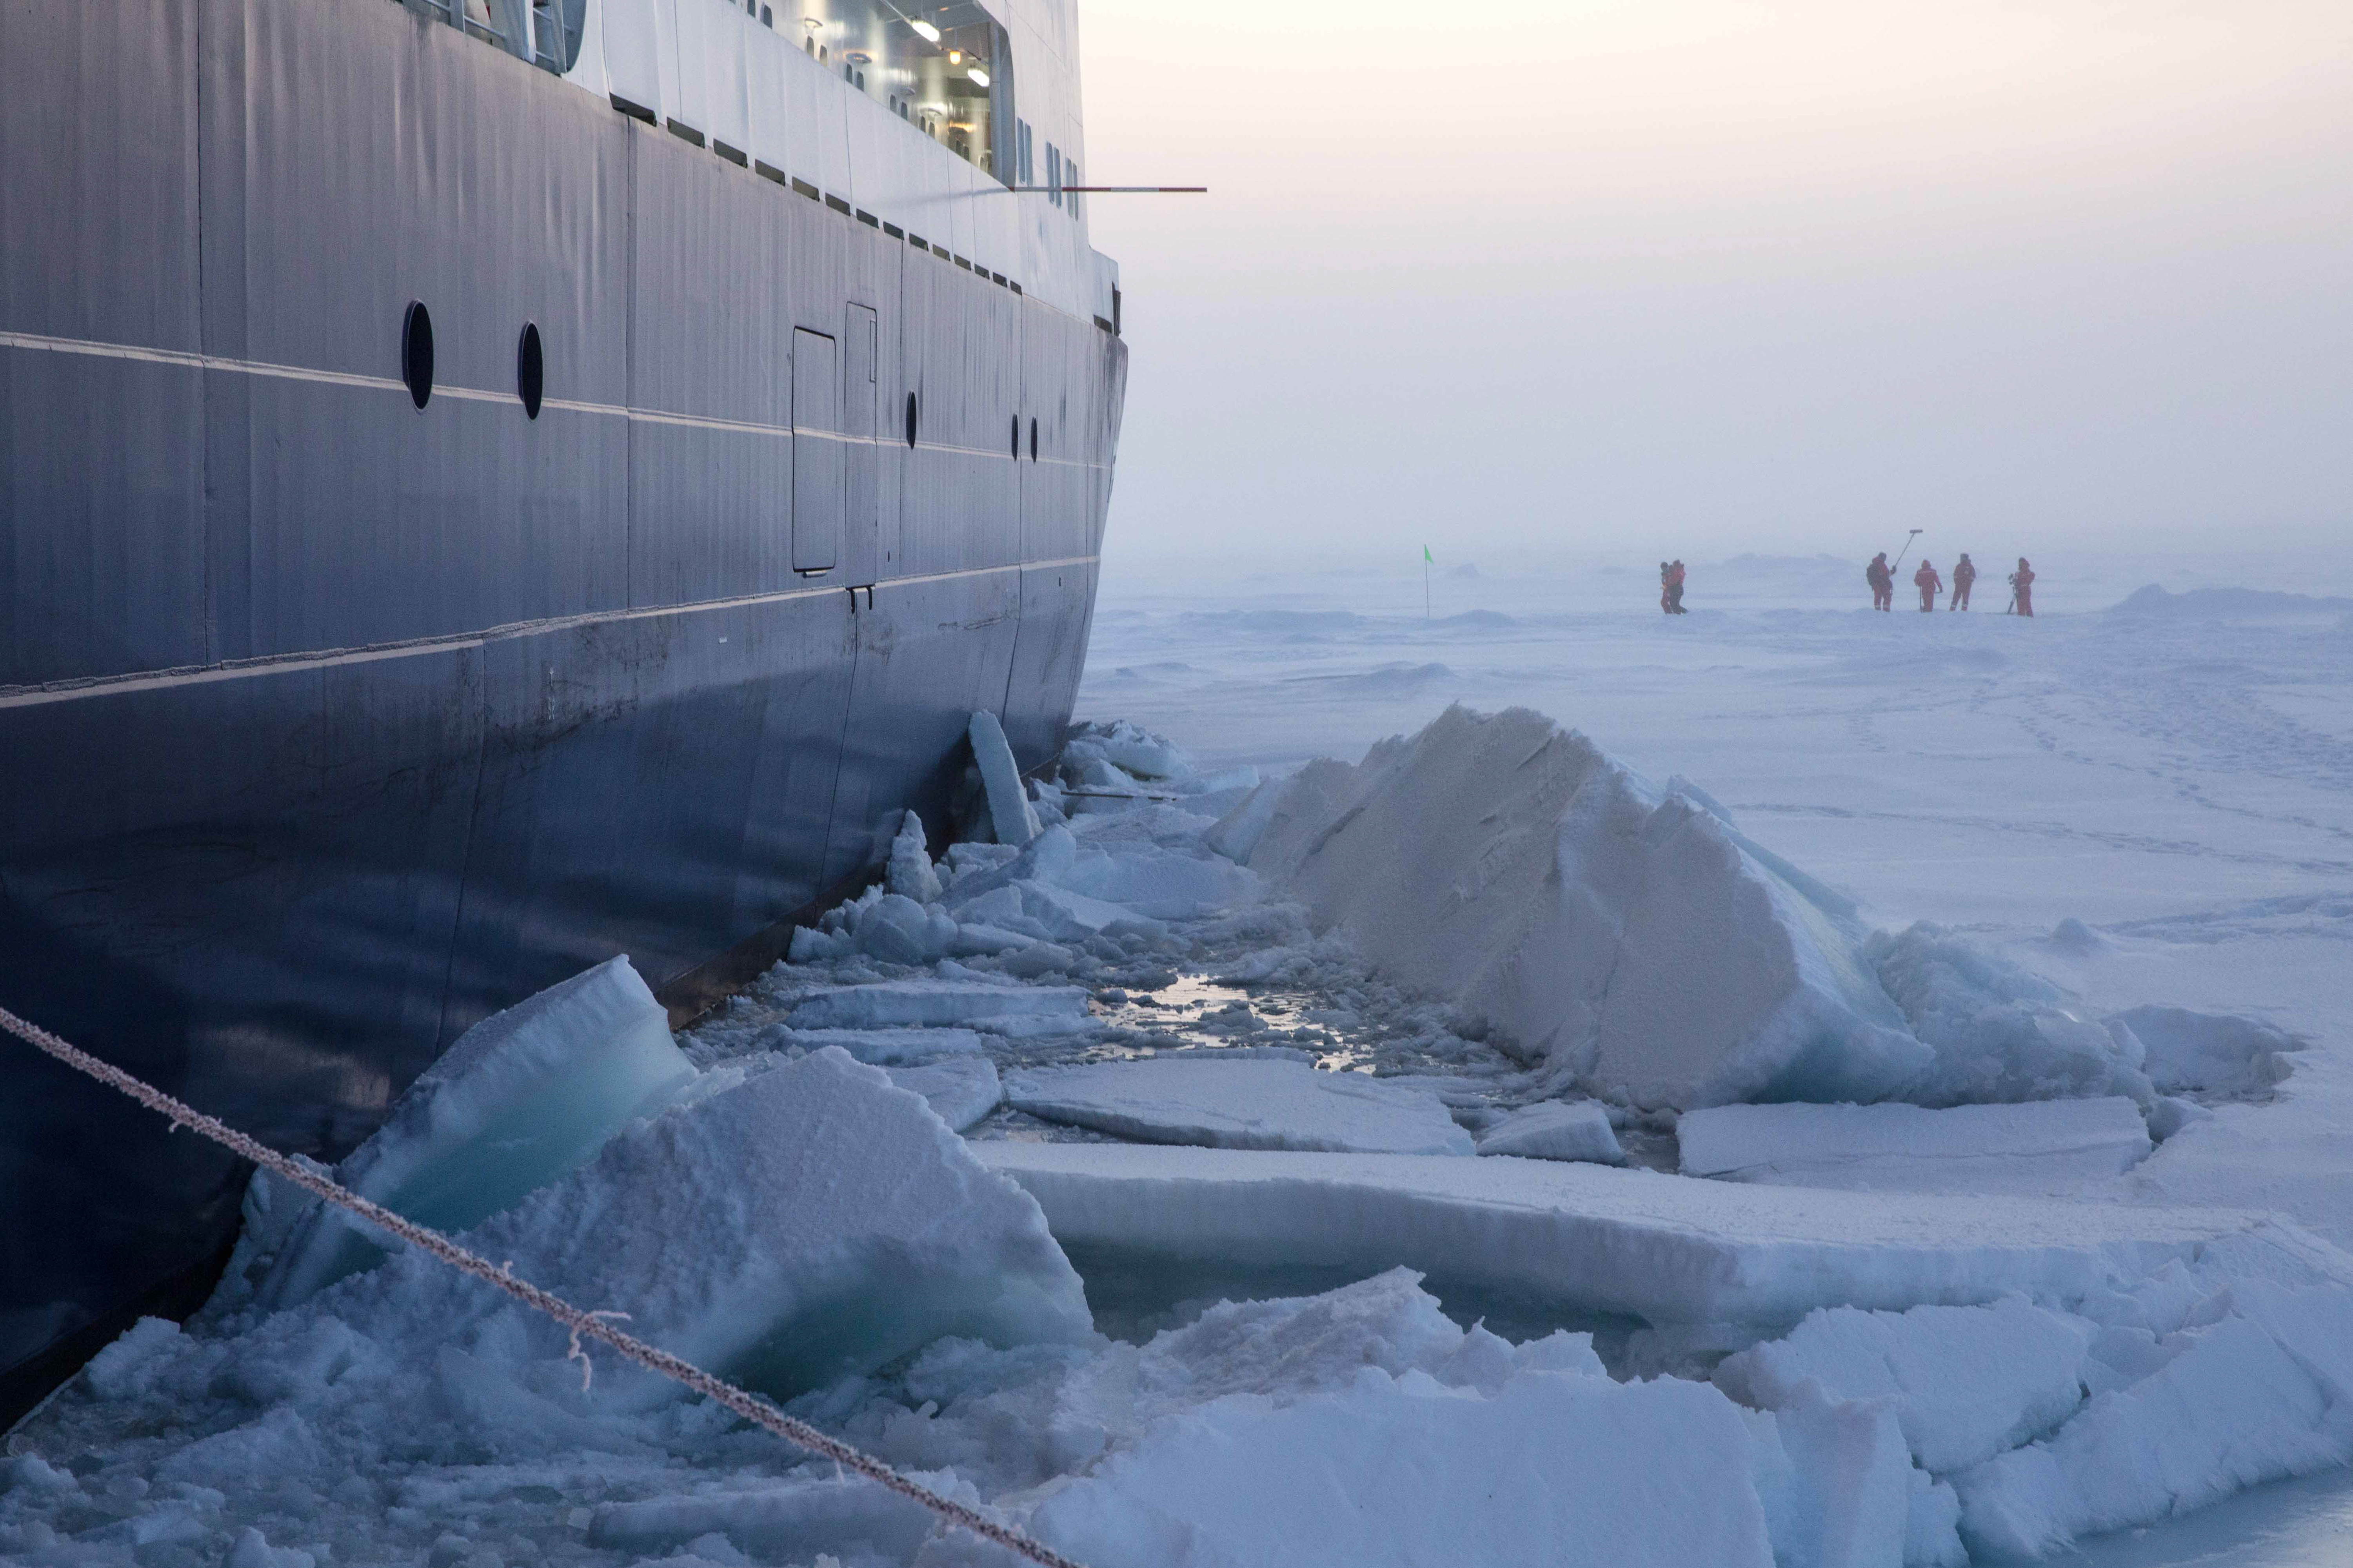
How do sediments, pebbles, and bivalve shells get into sea ice in the middle of the Arctic Ocean? MOSAiC scientists were able to answer this question recently and give insight into the birthplace of their ice floe. Like many fish species that spend their juvenile years in protected nearshore waters before heading out to the open ocean, the Polarstern's sea ice floe was 'birthed' near land—off the coast of the New Siberian Islands, to be exact—then drifted over 1200 nautical miles into the central Arctic to where the Polarstern initially moored with it last October.
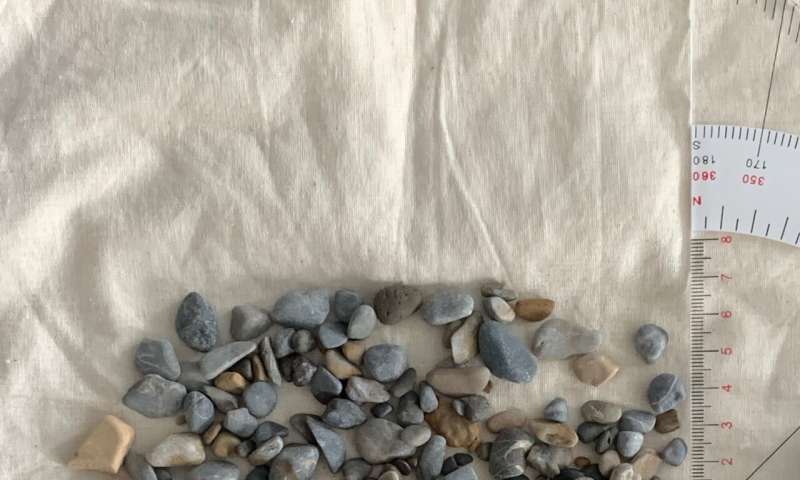
Pebbles and other sediments can become embedded in sea ice when it forms near coastlines and ridging causes the undersides of the ice to scrape against the seafloor (photo credit: AWI). How do MOSAiC scientists know the ice formed off the coast of Siberia? They used a combination of satellite imagery and models to backtrack the ice floe's movements. Sea ice doesn't just transport sand and rocks from the coastlines across the Arctic, but other things as well like gasses. As sea ice is melting earlier and more intensively in the Arctic summers, this material transport will be significantly impacted. MOSAiC scientists are working to better understand this interconnected Arctic climate system.
Learn more about the birthplace of the MOSAiC sea ice floe
Celebrate Arctic Sea Ice Day on July 15th with Polar Bears International
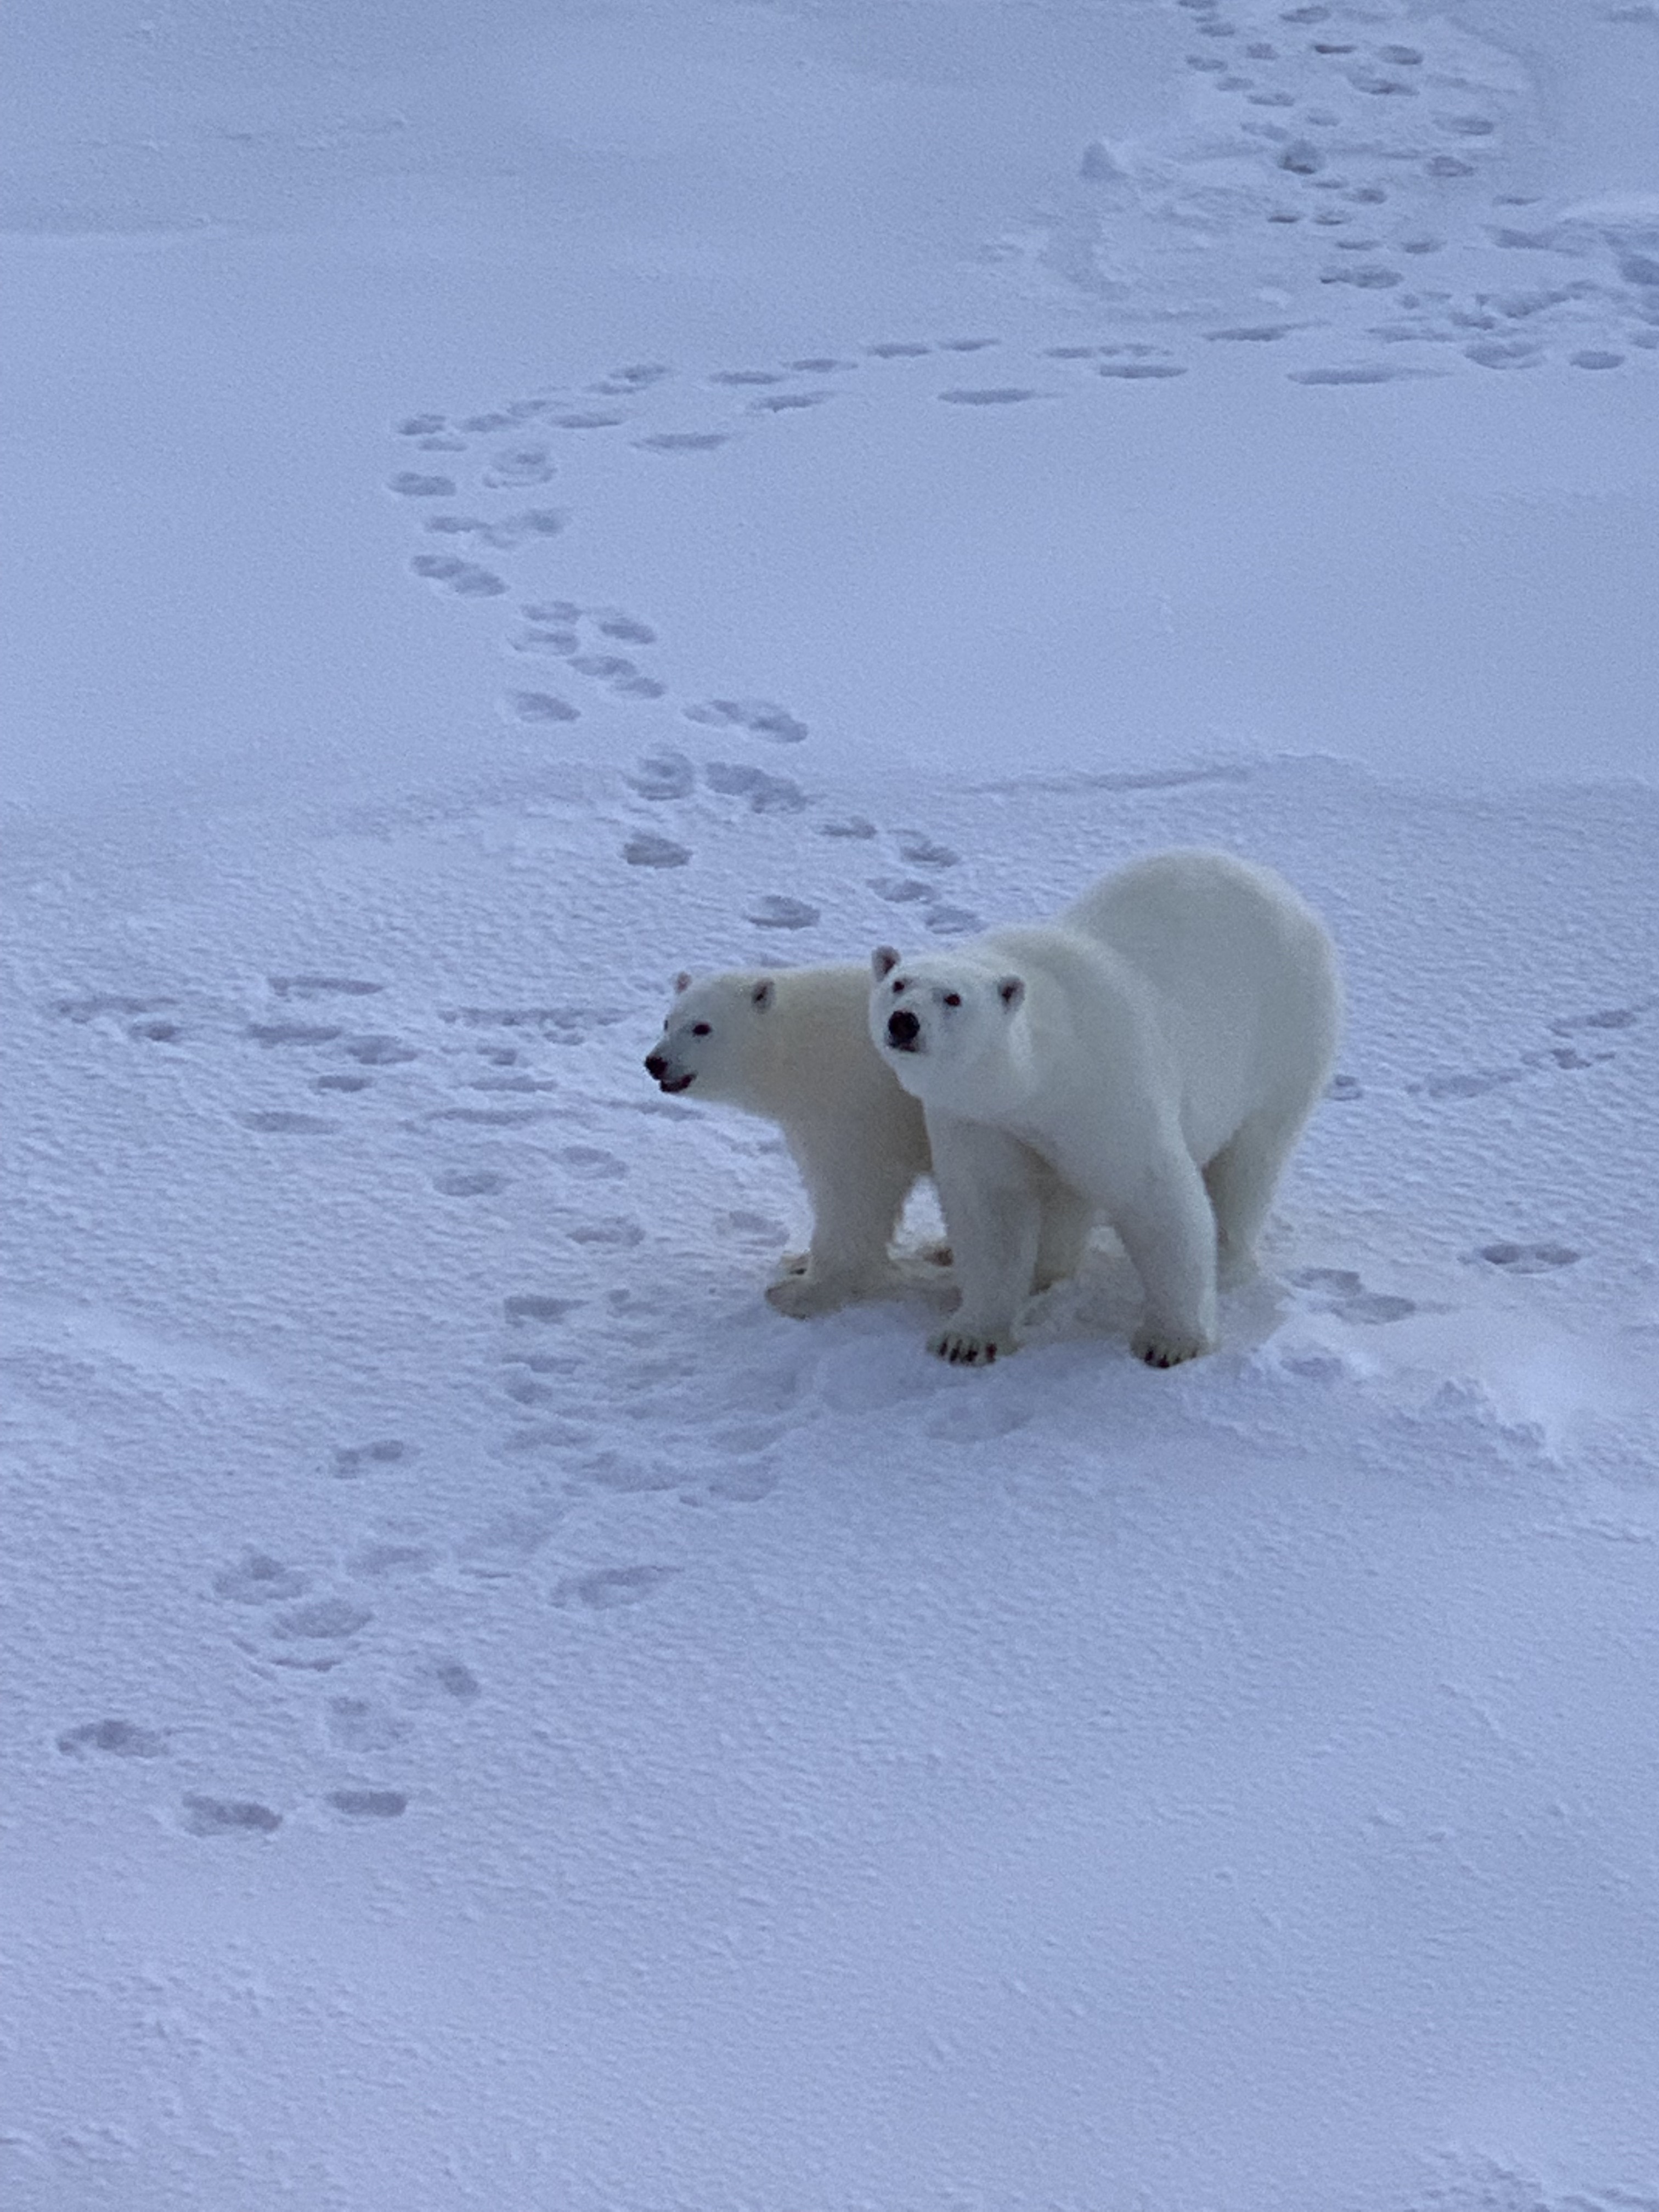
July 15th was designated by Polar Bears International as 'Arctic Sea Ice Day' to bring attention to the melting taking place in the Arctic, why it matters, and how we can address it. Many Arctic indigenous communities rely on sea ice for subsistence hunting and for sustaining their ways of life. Many Arctic species also rely on sea ice for their survival and wellbeing, including polar bears, ringed seals, and even polar cod, who use sea ice to hide from predators. Sea ice even serves as a habitat for algae that form the base of Arctic food webs. Sea ice also plays a crucial role in the Arctic and global climate systems, reflecting sunlight away from earth's surface. Sea ice is often referred to as "Earth's air conditioner," as it helps keep the planet cool. Photo: Polar bear sighting on leg 1 of MOSAiC; Photo credit: Anne Gold
Learn more about Arctic sea ice with these resources:
- Stay up-to-date on sea ice conditions in the Arctic with Arctic Sea Ice News & Analysis from the NSIDC
- Read indigenous peoples' observations about the state of Arctic sea ice
- Visualize Arctic sea ice changes over time with NASA's Earth Observatory
Learn more about Arctic Sea Ice Day
 #askmosaic: Living on Unstable 'Ground'
Eliana from Middleton Middle School wants to know: Does it feel weird having your ship on ice?
"There are no waves so the ship usually stays very still. Sometimes you forget you are on a ship at all! However, when the ice is moving, sometimes it makes noises as it rubs against the ship. My cabin [was] on a lower deck and I [could] hear the ice when I [was] trying to sleep."
-Chris Cox, NOAA; Chris just returned from leg 3 of the expedition
Photo: The Polarstern moored to sea ice when it first arrived at its floe on leg 1. Photo credit: Esther Horvath
Send us your #askmosaic questions!
 MOSAiC Virtual Summer Camp
Did you or your kids have summer camp plans that fell through because of COVID? Not to worry! Tune in to MOSAiC Monday each week for a fun, hands-on and engaging virtual summer camp activity related to MOSAiC or the Arctic. All MVSC activities should be done with parent supervision!
This Week's Activity: Design an Ice Core Cooler
After scientists collect ice cores from the field, they often will take the cores back to a lab before analyzing them. It is very important that the ice cores don't melt in transit from the field to the lab! Your task this week is to design a cooler that will keep an ice core frozen for as long as possible.
What you will need:
- Paper and pencil
- Cardboard shoe box (this will serve as the shell for your cooler)
- Popsicles or ice cubes
- (Optional) Two thermometers
Anything that you think would be useful for designing a cooler, such as:
- Bubble wrap
- Newspaper
- Styrofoam
- Aluminum foil
- Towels or blankets
- Tape
- Packing peanuts
- Scissors
What to do:
- Create a drawing of your cooler design using paper and pencil. How is your cooler going to look? What will it be made of? What will be on the inside and outside of it?
- Using the materials you have, build a prototype of your cooler design. A prototype is just an initial design, and isn't meant to be a polished finished product.
- Test your cooler: Put a popsicle or a few ice cubes inside your cooler. Keeping the cooler in a place that has a constant temperature, check on the ice cube or popsicle every 3-5 minutes or so and write down your observations. Is melting occurring? If so, when did it start? How fast is it happening? If you have thermometers, you can keep one inside the cooler and one outside to see how cold the inside of your cooler is staying compared to the air temperature.
- Are you happy with your cooler design? Is there anything you can do to make it better? If so, improve your prototype and test it again with another popsicle or set of ice cubes. What did you learn from this activity?
This activity was adapted from the hands-on Cooler Design Challenge featured on TeachEngineering.org. The activity was developed in the College of Engineering’s Research Experience for Teachers: Engineering in Precision Agriculture for Rural STEM Educators program. Check out the full activity here!
Photo credit: Esther Horvath
Check out our full list of virtual and at-home polar learning resources!
 Educators' Corner
The school year has ended for most K-12 students and teachers in many places, which means that it's time for professional development workshops, fall curriculum planning, and hopefully a bit of relaxation time! Each week throughout the summer, we'll use Educators' Corner to highlight MOSAiC and Arctic-related lessons, multimedia resources, and other educational materials that you can use in your NGSS (or similar) classroom, in person or remotely. Are you looking for a particular kind of educational resource? Let us know! Email us at mosaic@colorado.edu.
For Your Classroom: Modeling Ice Sheets

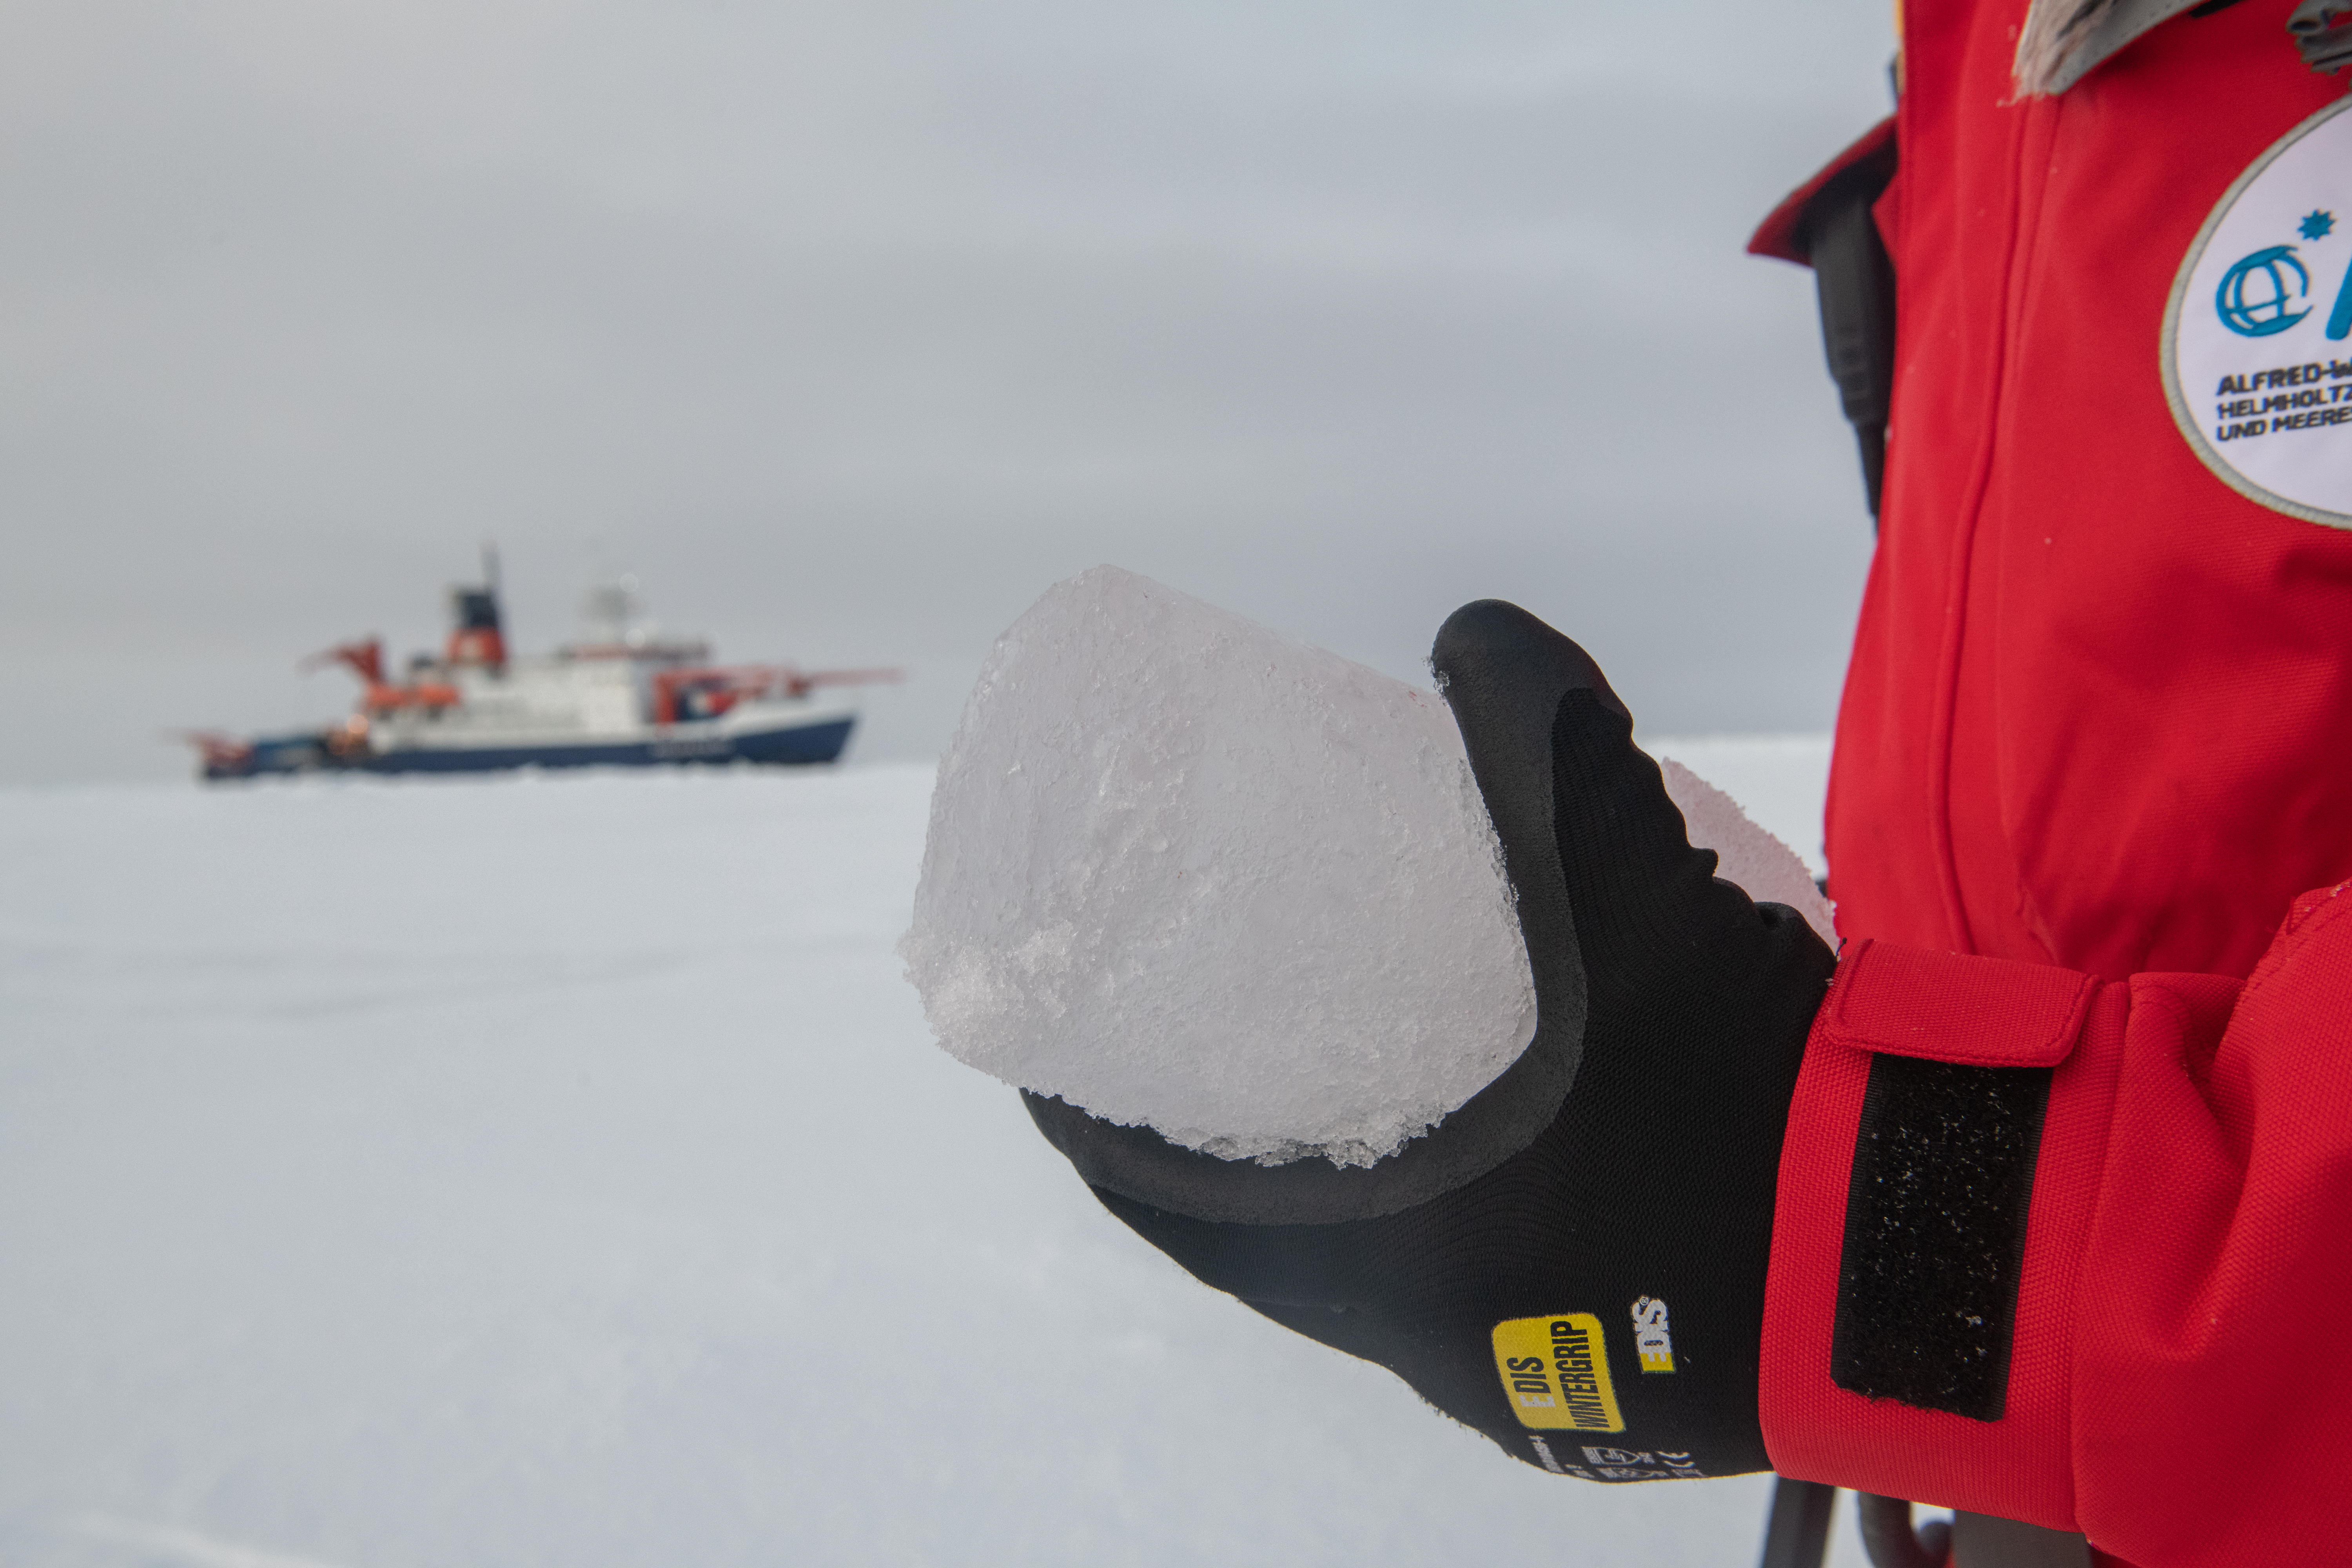
Drilling and sampling ice cores—cylindrical cross sections of sea ice—is an important weekly activity for MOSAiC scientists. Why is this? In addition to providing information about the thickness of sea ice at any particular location, ice cores can also give us a glimpse into the past. 'Older' sea ice is made up of layers of snow and ice that have accumulated over a period of years. By analyzing things like bits of dust or gas bubbles trapped in the ice, scientists can learn about, for example, the atmospheric conditions in which the ice formed. In places like Antarctica where land ice has been accumulating for millions of years, scientists can reconstruct Earth's climate from the geologic past!
Photo: MOSAiC scientist drills an ice core; Photo credit: Anne Gold
Activity: Ice Cores: Modeling Ice Sheets
This activity was created by our friends at PolarTREC and is designed for grades 6 and up. Working in groups, students will use common materials to create layers of snow and ice representing thousands of years of stratification. Groups will exchange their ice layers and extract core samples to analyze them.
Educators: Sign up now for MOSAiC Expedition Virtual Teacher Workshops in July and August!
Workshop 1: New & Old Arctic
When: July 28-29 10 am - 2 pm MT
Where: Your living room
Cost: Free!
What you get: Certificate for 10 hours of professional development with the option to pay for 1 graduate credit from CU Boulder
Workshop 2: Arctic Feedbacks: Not All Warming is Equal
When: August 4-5 10 am - 2 pm MT
Where: Your living room
Cost: Free!
What you get: Certificate for 10 hours of professional development and 1 graduate credit from CU Boulder (paid for by CIRES)
 MOSAiC Weekly Tracking
Plot the Polarstern
Each week we will provide you with the latitude and longitude coordinates of the Polarstern so that you can track its journey across the Arctic.
Download the map to plot coordinates
Download a larger map of the Arctic for a bigger picture view of the expedition area
Location of the Polarstern
| Date | Latitude | Longitude |
| September 16, 2019 | 69.68 N | 18.99 E |
| September 23, 2019 | 72.31 N | 26.93 E |
| September 30, 2019 | 85.12 N | 138.05 E |
| October 4, 2019** | 85.08 N | 134.43 E |
| October 7, 2019 | 85.10 N | 133.82 E |
| October 14, 2019 | 84.85 N | 135.03 E |
| October 21, 2019 | 84.97 N | 132.73 E |
| October 28, 2019 | 85.47 N | 127.07 E |
| November 4, 2019 | 85.88 N | 121.70 E |
| November 11, 2019 | 85.82 N | 116.00 E |
| November 18, 2019 | 86.05 N | 122.43 E |
| November 25, 2019 | 85.85 N | 121.35 E |
| December 2, 2019 | 85.97 N | 112.95 E |
| December 9, 2019 | 86.25 N | 121.40 E |
| December 16, 2019 | 86.62 N | 118.12 E |
| December 23, 2019 | 86.63 N | 113.20 E |
| December 30, 2019 | 86.58 N | 117.13 E |
| January 6, 2020 | 87.10 N | 115.10 E |
| January 13, 2020 | 87.35 N | 106.63 E |
| January 20, 2020 | 87.42 N | 97.77 E |
| January 27, 2020 | 87.43 N | 95.82 E |
| February 3, 2020 | 87.42 N | 93.65 E |
| February 10, 2020 | 87.78 N | 91.52 E |
| February 17, 2020 | 88.07 N | 78.52 E |
| February 24, 2020 | 88.58 N | 52.87 E |
| March 2, 2020 | 88.17 N | 31.02 E |
| March 9, 2020 | 87.93 N | 24.20 E |
| March 16, 2020 | 86.87 N | 12.70 E |
| March 23, 2020 | 86.20 N | 15.78 E |
| March 30, 2020 | 85.37 N | 13.27 E |
| April 6, 2020 | 84.52 N | 14.38 E |
| April 13, 2020 | 84.28 N | 14.97 E |
| April 20, 2020 | 84.52 N | 14.57 E |
| April 27, 2020 | 83.93 N | 15.65 E |
| May 4, 2020 | 83.92 N | 18.03 E |
| May 11, 2020 | 83.47 N | 13.08 E |
| May 18+, 2020 | 83.32 N | 8.68 E |
| May 25+, 2020 | 82.43 N | 8.28 E |
| June 1+, 2020 | 81.33 N | 9.93 E |
| June 8+, 2020 | 78.10 N | 12.73 E |
| June 15+, 2020 | 82.20 N | 8.18 E |
| June 22, 2020 | 81.95 N | 9.27 E |
| June 29, 2020 | 82.03 N | 9.88 E |
| July 6, 2020 | 81.67 N | 5.22 E |
| July 13, 2020 | 81.40 N | 0.28 E |
**Day when MOSAiC reached the ice floe that the Polarstern will become frozen in and drift with for the next year.
+ Indicates when the Polarstern traveled under its own engine power (no drifting)
Log MOSAiC Data
Keep track of Arctic conditions over the course of the expedition:
Download Data Logbook for Sept. 2019 - Dec. 2019
Download Data Logbook for Dec. 2019 - Mar. 2020
Download Data Logbook for Mar. 2020 - June 2020
*New* Download Data Logbook for July 2020 - Oct. 2020
| Date | Length of day (hrs) | Air temperature (deg C) at location of Polarstern | Arctic Sea Ice Extent (million km2) |
| September 16, 2019 | 13.25 | High: 10 Low: 4.4 | 3.9 |
| September 23, 2019 | 12.35 | High: 6 Low: -1 | 4.1 |
| September 30, 2019 | 9.1 | -4.7 | 4.4 |
| October 4, 2019** | 6.27 | -13.0 | 4.5 |
| October 7, 2019 | 3.05 | -8.2 | 4.6 |
| October 14, 2019 | 0 | -14.7 | 4.8 |
| October 21, 2019 | 0 | -12.8 | 5.4 |
| October 28, 2019 | 0 | -18.3 | 6.8 |
| November 4, 2019 | 0 | -18.9 | 8.0 |
| November 11, 2019 | 0 | -25.5 | 8.7 |
| November 18, 2019 | 0 | -10.7 | 9.3 |
| November 25, 2019 | 0 | -18.4 | 10.0 |
| December 2, 2019 | 0 | -26.6 | 10.4 |
| December 9, 2019 | 0 | -23.1 | 11.2 |
| December 16, 2019 | 0 | -19.2 | 11.8 |
| December 23, 2019 | 0 | -26.9 | 12.2 |
| December 30, 2019 | 0 | -26.4 | 12.6 |
| January 6, 2020 | 0 | -28.0 | 13.0 |
| January 13, 2020 | 0 | -30.7 | 13.1 |
| January 20, 2020 | 0 | -27.1 | 13.6 |
| January 27, 2020 | 0 | -22.5 | 13.8 |
| February 3, 2020 | 0 | -28.8 | 14.1 |
| February 10, 2020 | 0 | -26.2 | 14.5 |
| February 17, 2020 | 0 | -31.9 | 14.4 |
| February 24, 2020 | 0 | -24.0 | 14.6 |
| March 2, 2020 | 0 | -35.5 | 14.8 |
| March 9, 2020 | 0 | -37.9 | 14.7 |
| March 16, 2020 | 10.5 | -27.5 | 14.7 |
| March 23, 2020 | 16.5 | -28.7 | 14.4 |
| March 30, 2020 | 24 | -28.6 | 14.0 |
| April 6, 2020 | 24 | -18.2 | 13.7 |
| April 13, 2020 | 24 | -25.8 | 13.6 |
| April 20, 2020 | 24 | -10.2 | 13.3 |
| April 27, 2020 | 24 | -11.7 | 12.8 |
| May 4, 2020 | 24 | -16.2 | 12.8 |
| May 11, 2020 | 24 | -10.4 | 12.4 |
| May 18, 2020 | 24 | -5.1 | 11.7 |
| May 25, 2020 | 24 | 0.4 | 11.5 |
| June 1, 2020 | 24 | 0.0 | 11.1 |
| June 8+, 2020 | 24 | -0.1 | 10.6 |
| June 15+, 2020 | 24 | -0.4 | 10.1 |
| June 22, 2020 | 24 | -0.4 | 9.6 |
| June 29, 2020 | 24 | 0.5 | 9.2 |
| July 6, 2020 | 24 | 0.6 | 8.2 |
| July 13, 2020 | 24 | 0.2 | 7.2 |
*Note: We expect data to fall within the following ranges: Length of day, 0-24 hours; Temperature, -40 to 14 degrees C; Sea ice extent, 3-15 million km2
**Day when MOSAiC reached the ice floe that the Polarstern will become frozen in and drift with for the next year.
Is there something you'd like to see in MOSAiC Monday? Let us know!
Send us your feedback
New to MOSAiC Monday? Check out past editions!
Browse more expedition-related educational resources, videos, and blogs
Email us! mosaic@colorado.edu