The Atmosphere, Part 3
Cloudy with a Chance of Science
The MOSAiC Atmosphere Team is particularly interested in studying clouds in the Arctic. Why is this? Clouds play an important role in weather and climate, and the focus of MOSAiC is all about studying the Arctic climate system. Scientists also don't fully understand what Arctic clouds are made up of since getting into the field to study them directly is so difficult. Also, climate models have trouble accurately representing clouds since the droplets and crystals that make up clouds are so tiny and the geographic areas and processes that climate models represent are so large. Imagine trying to accurately draw a picture of a tree and all of the cells that make it up, both to scale! This week, we're looking to the sky to learn more about clouds and what kind of role they might play in the Arctic climate system.
Learn more about MOSAiC atmospheric research and meet members of Team Atmosphere
Why do climate models have trouble with clouds, and is there a solution?
Studying Arctic Clouds - Frozen in the ice over 20 years ago!
What did we know about Arctic clouds before MOSAiC? Let's go back in time to October of 1997....the Canadian icebreaker Des Groseilliers attaches itself to an ice floe about 350 miles (~570 km) northeast of Prudhoe Bay, Alaska and spends a year frozen in the ice (sound familiar??). Like MOSAiC, researchers on this expedition known as SHEBA (Surface Heat Budget of the Arctic Ocean) set up a suite of instruments on the sea ice around the ship to collect data specifically about how heat is exchanged between the Arctic Ocean and atmosphere. They made some new and important discoveries about the Arctic atmosphere, especially about how Arctic clouds are connected to Arctic temperatures.
 In the Classroom: Correlation, Causation, and Clouds
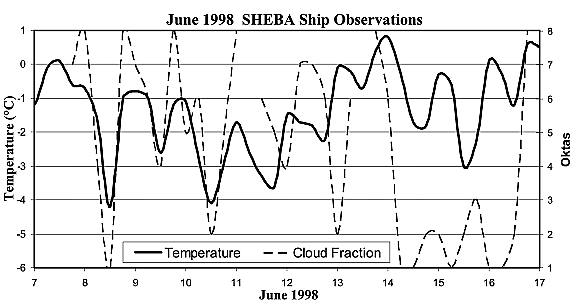
Check out the graph to the left, which shows June air temperature from the SHEBA expedition plotted with 'cloud fraction,' or how much of the sky is filled with clouds. An 'okta' is a unit of measurement we use to describe cloud cover at a particular place, where 0 oktas = completely clear sky with no clouds, and 8 oktas = sky completely filled with clouds. Do you see any patterns, or any correlation between surface temperature in the Arctic and cloud cover? If so, can you draw any conclusions about cause and effect from this data? Does one thing (e.g., clouds) affect the other (e.g., temperature) or can you tell? What is the difference between correlation and causation? Figure credit: Bromwich et al., 2009)
![]()
![]()
![]()
 Quick Bite: Clouds in the Summer, Clouds in the Winter?
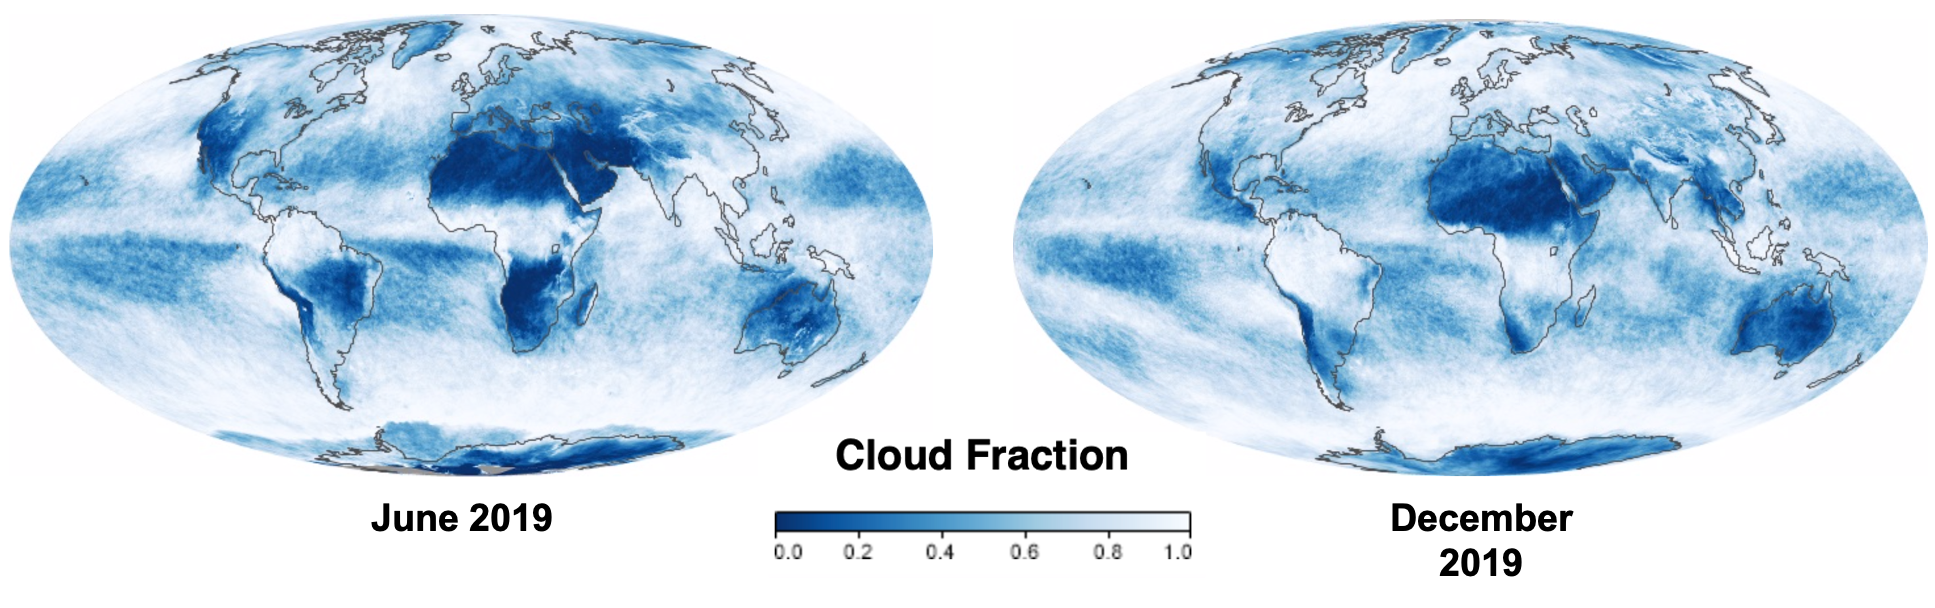
Take a look at the two maps below, which show the cloud fraction all over the globe at two different times of the year in 2019: June and December. On this map, cloud fraction is reported as a percentage (not as 'oktas'), where 0.0 = 0% cloud cover (clear sky), represented by dark blue, and 1.0 = 100% cloud cover (completely overcast), represented by white. Focus on the Arctic region in these two maps. Do you see a seasonal difference in Arctic cloud cover? Click on either map to go to the NASA Earth Observatory page where you can watch an animation of how cloud fraction changes around the globe throughout the year over a several year period. Watch the animation and think about the same question: Do you see a seasonal difference in Arctic cloud cover? If so, why do you think this might be (think about how clouds form)? Write down 1-2 hypotheses. What else varies seasonally in the Arctic? Image credits: NASA Earth Observatory
Additional Challenge: Want to compare cloud fraction to other variables, like sea surface temperature or net radiation? You can click on Show All Maps under Select and Compare on the right side of the NASA Earth Observatory page to compare seasonal cloud fraction to these other variables. Choose a few to compare cloud fraction to. Do you see any correlations? Does this help you answer any of the above questions about seasonal cloud cover in the Arctic?
Learn more about seasonal changes in Arctic clouds
Cloudy with a chance of warming: How do clouds connect to climate change in the Arctic?
![]()
![]()
![]()
![]()
![]()
 #askmosaic: You're as Cloud as Ice
This question was submitted by Benjamin from Middleton Middle School: Does the atmosphere affect the temperature and/or thickness of sea ice in the Arctic?
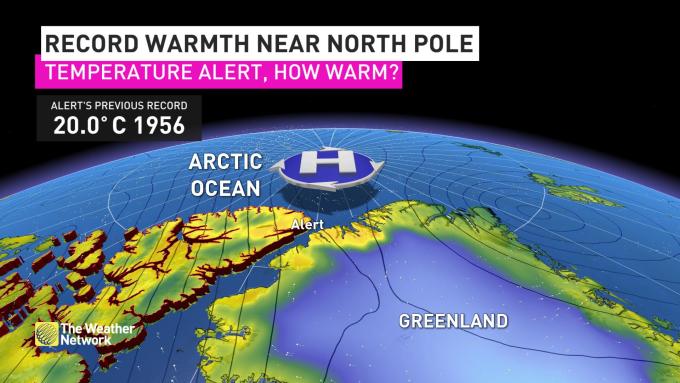
Yes! The atmosphere plays a critical part in the Arctic climate system. Storms can bring warm and moist air into the Arctic causing the temperature to warm over short periods of time. Other atmospheric circulation patterns can also bring warm air to the Arctic and as climate changes, one question climate scientists face is how these changes will alter how much warm air is transported to the Arctic. Image: On July 14, 2019, the Arctic community of Alert, Nunavut, Canada shattered their record for the highest temperature recorded; Image credit: The Weather Network
The presence of clouds can also alter the temperature in the Arctic. Much like at home where cloudy nights are often warmer than clear nights clouds can also increase the temperature in the Arctic by trapping some of the energy radiated from the surface that would normally escape to space.
How warm or cold the atmosphere is is one of the main factors that controls how thick the sea ice can become. As the atmosphere becomes warmer, the sea ice will become thinner. The thinner sea ice also allows more heat to escape from the ocean and warm the atmosphere, so there is a positive feedback here. A change that causes a warmer atmosphere will reduce the thickness of the sea ice and this will result in the atmosphere becoming even warmer.
-John Cassano, University of Colorado Boulder and member of MOSAiC Team Atmosphere; John is currently on board the Polarstern for Leg III of the MOSAiC expedition.
How would a SHEBA scientist answer this question? In 2011, scientist Anthony Del Genio described what they learned from SHEBA about the connection between the atmosphere and sea ice:
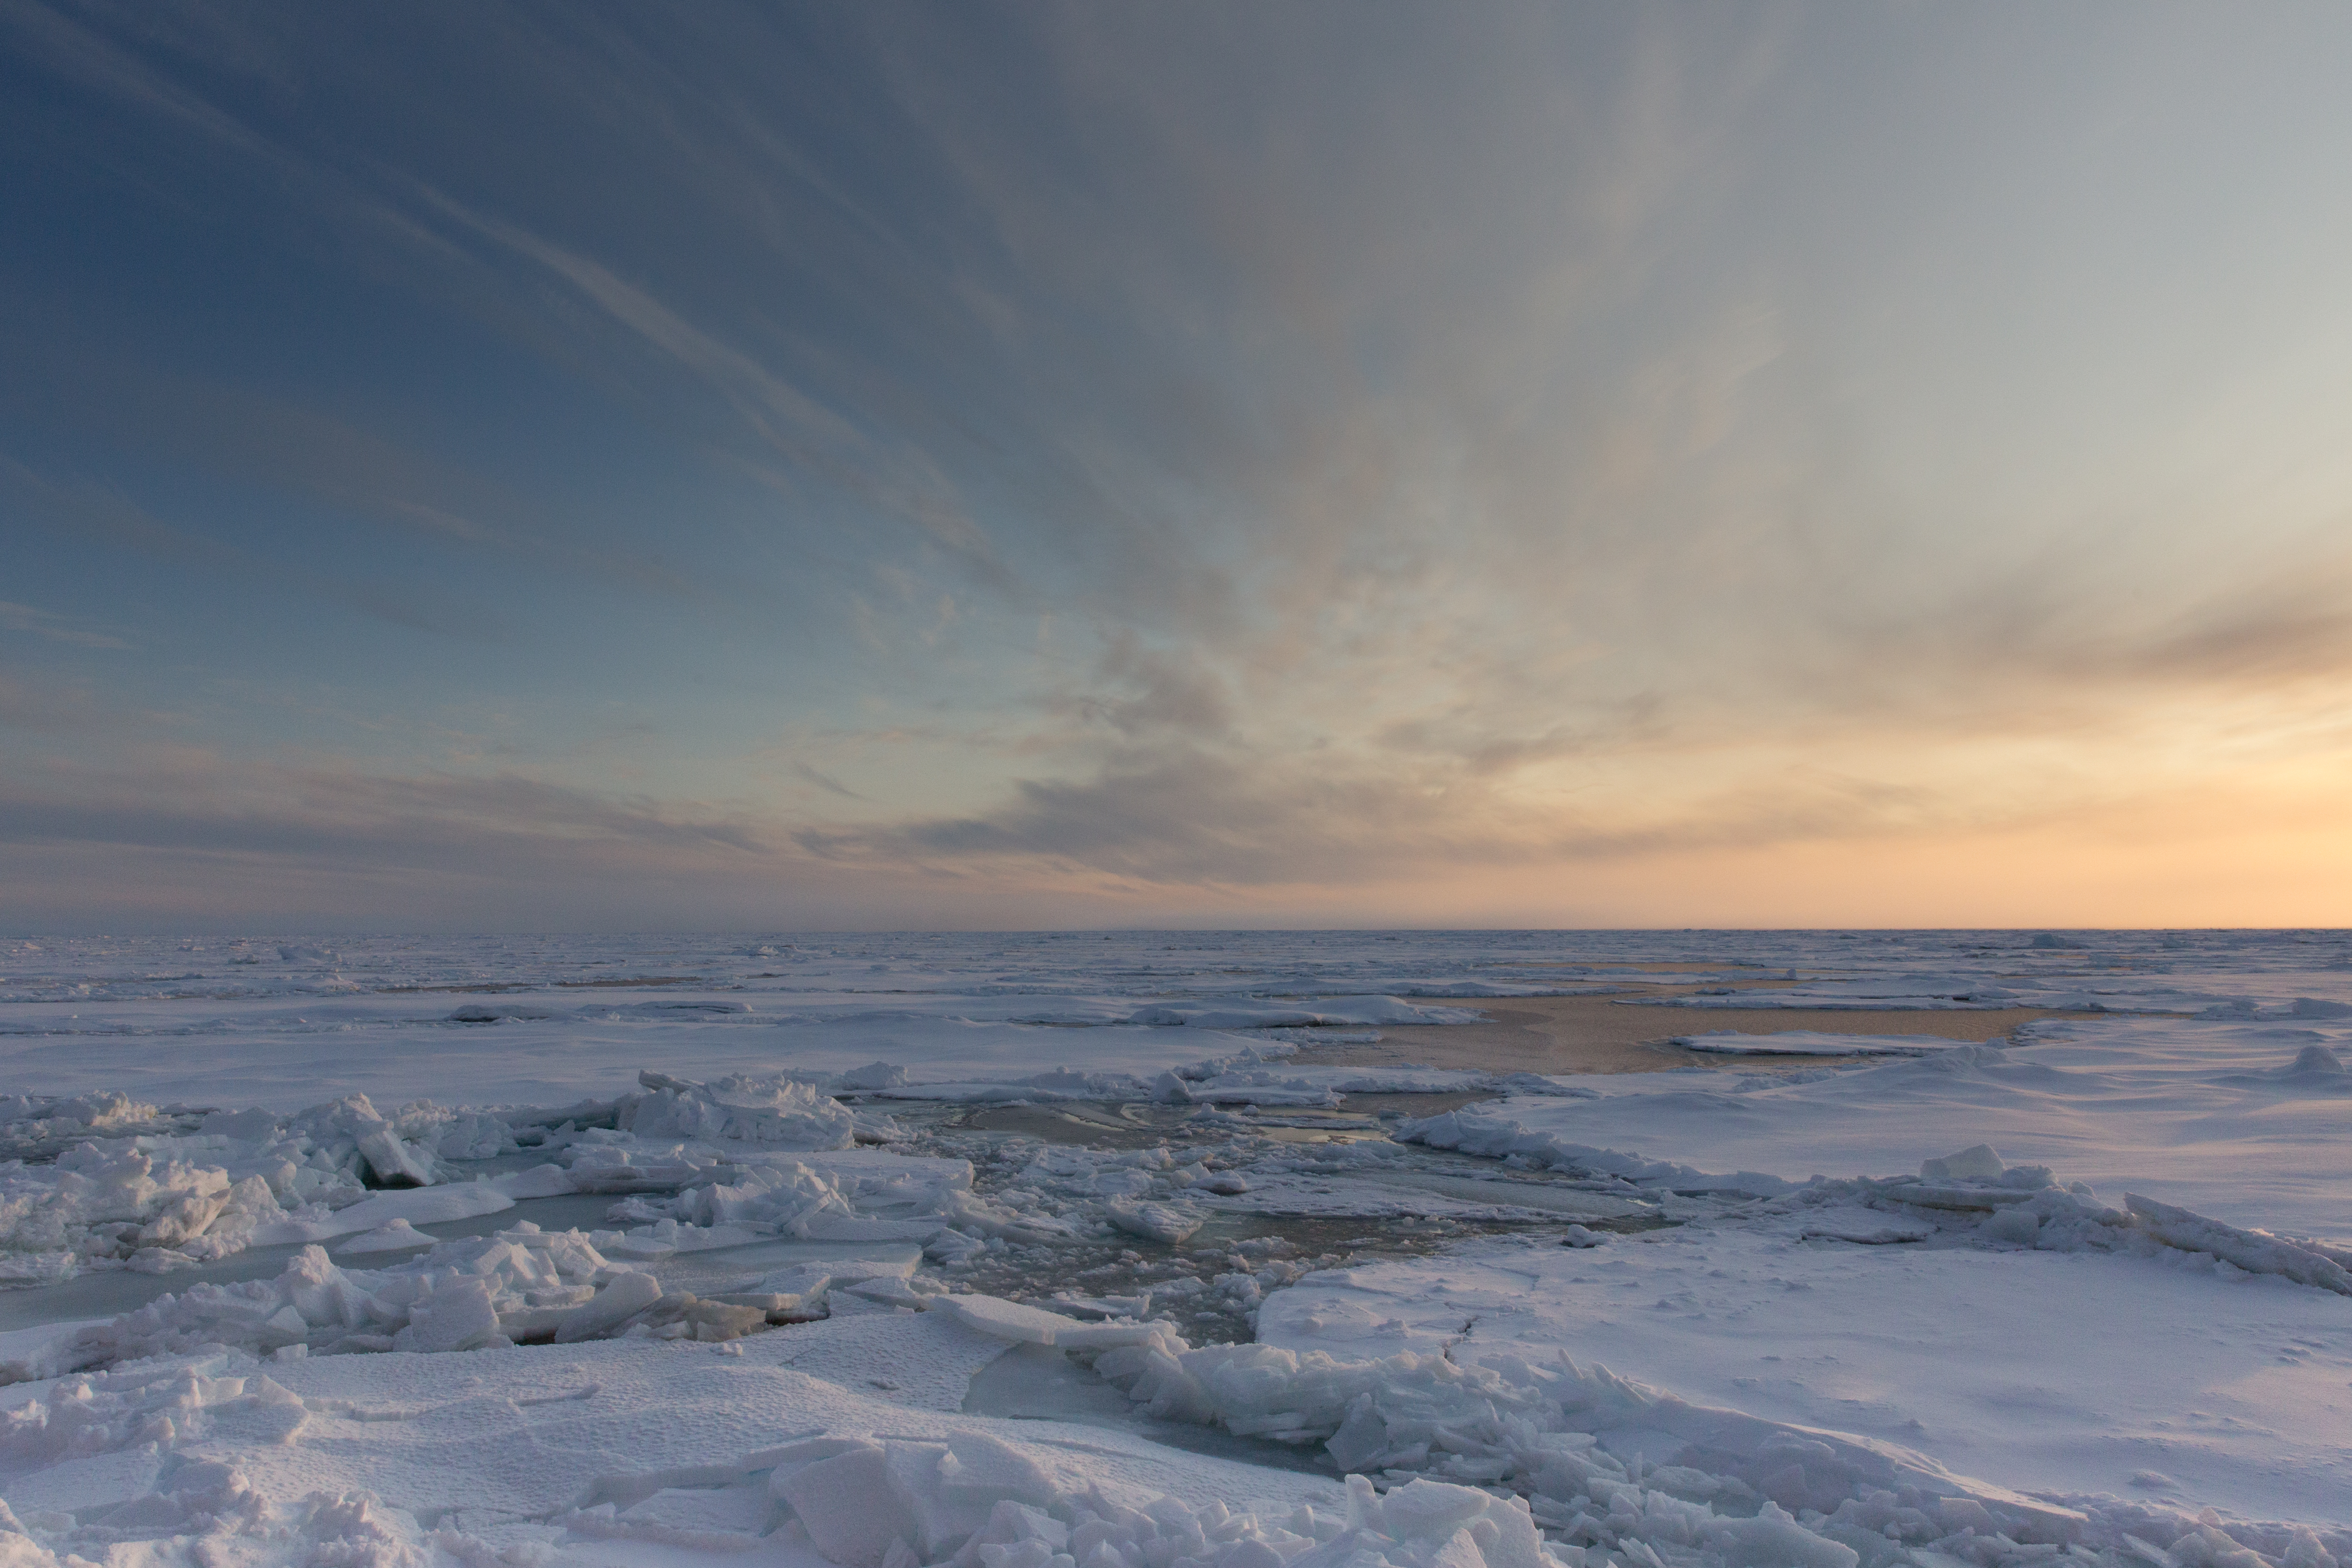
We found...that the Arctic atmosphere and its effect on the surface are very different depending on whether a storm is passing and skies are overcast or whether high pressure is in place and skies are mostly clear. Overcast skies act as a blanket that traps heat and warms the sea ice and snow, while clear skies allow heat to be radiated away to space, cooling the snow and sea ice. These effects are exaggerated in the Arctic because the cold air is too dry for water vapor molecules to trap much heat, and because the clear and cloudy episodes last longer than in other parts of the world, giving the snow and sea ice more chance to react. In spring...cloudy conditions begin to dominate [in the Arctic], causing temperatures to warm on average and move the ice closer to its melting temperature, even before the newly risen Sun is strong enough to matter. Thus, more persistent clouds as spring approaches may cause the sea ice to first reach its melting temperature at an earlier date, and more frequent Arctic clouds in a warmer climate might accelerate sea ice decline. Photo: Clouds in the Arctic sky during MOSAiC Leg I; Photo credit: Sebastian Grote
Learn more about Clouds and Climate
Submit your #askmosaic questions!
Atmosphere Aplenty
There are so many other topics related to the Arctic atmosphere that we could cover in our 3-part MOSAiC Monday series on the subject. Fortunately, because the atmosphere doesn't exist in isolation but rather interacts with all of the other environmental systems in the Arctic, we'll be bringing you more in the upcoming MOSAiC Mondays covering the MOSAiC science focus areas. We'll explore questions like:
- How do bacteria on the ocean floor relate to the formation of Arctic clouds?
- How do cracks ('leads') in sea ice affect weather in the Arctic?
- How is the movement of the ocean and sea ice related to atmospheric processes (i.e., wind!)?
- Why can the Arctic air be so much colder than the ocean at the same moment in time?
- What are greenhouse gases, where do they come from, and how do they impact Earth's climate?
- How can we use climate models to understand Earth's complex climate system, including its atmosphere?
What other questions do you have about the Arctic atmosphere, ocean, sea ice, or ecosystems?
 MOSAiC Weekly Tracking
Plot the Polarstern
Each week we will provide you with the latitude and longitude coordinates of the Polarstern so that your students can track its journey across the Arctic in your classroom.
Download the map to plot coordinates
Download a larger map of the Arctic for a bigger picture view of the expedition area
Location of the Polarstern
| Date | Latitude | Longitude |
| September 16, 2019 | 69.68 N | 18.99 E |
| September 23, 2019 | 72.31 N | 26.93 E |
| September 30, 2019 | 85.12 N | 138.05 E |
| October 4, 2019** | 85.08 N | 134.43 E |
| October 7, 2019 | 85.10 N | 133.82 E |
| October 14, 2019 | 84.85 N | 135.03 E |
| October 21, 2019 | 84.97 N | 132.73 E |
| October 28, 2019 | 85.47 N | 127.07 E |
| November 4, 2019 | 85.88 N | 121.70 E |
| November 11, 2019 | 85.82 N | 116.00 E |
| November 18, 2019 | 86.05 N | 122.43 E |
| November 25, 2019 | 85.85 N | 121.35 E |
| December 2, 2019 | 85.97 N | 112.95 E |
| December 9, 2019 | 86.25 N | 121.40 E |
| December 16, 2019 | 86.62 N | 118.12 E |
| December 23, 2019 | 86.63 N | 113.20 E |
| December 30, 2019 | 86.58 N | 117.13 E |
| January 6, 2020 | 87.10 N | 115.10 E |
| January 13, 2020 | 87.35 N | 106.63 E |
| January 20, 2020 | 87.42 N | 97.77 E |
| January 27, 2020 | 87.43 N | 95.82 E |
| February 3, 2020 | 87.42 N | 93.65 E |
| February 10, 2020 | 87.78 N | 91.52 E |
| February 17, 2020 | 88.07 N | 78.52 E |
| February 24, 2020 | 88.58 N | 52.87 E |
| March 2, 2020 | 88.17 N | 31.02 E |
| March 9, 2020 | 87.93 N | 24.20 E |
**Day when MOSAiC reached the ice floe that the Polarstern will become frozen in and drift with for the next year.
Log MOSAiC Data
Keep track of Arctic conditions over the course of the expedition:
Download Data Logbook for Sept. 2019 - Dec. 2019
Download Data Logbook for Dec. 2019 - Mar. 2020
| Date | Length of day (hrs) | Air temperature (deg C) at location of Polarstern | Arctic Sea Ice Extent (million km2) |
| September 16, 2019 | 13.25 | High: 10 Low: 4.4 | 3.9 |
| September 23, 2019 | 12.35 | High: 6 Low: -1 | 4.1 |
| September 30, 2019 | 9.1 | -4.7 | 4.4 |
| October 4, 2019** | 6.27 | -13.0 | 4.5 |
| October 7, 2019 | 3.05 | -8.2 | 4.6 |
| October 14, 2019 | 0 | -14.7 | 4.8 |
| October 21, 2019 | 0 | -12.8 | 5.4 |
| October 28, 2019 | 0 | -18.3 | 6.8 |
| November 4, 2019 | 0 | -18.9 | 8.0 |
| November 11, 2019 | 0 | -25.5 | 8.7 |
| November 18, 2019 | 0 | -10.7 | 9.3 |
| November 25, 2019 | 0 | -18.4 | 10.0 |
| December 2, 2019 | 0 | -26.6 | 10.4 |
| December 9, 2019 | 0 | -23.1 | 11.2 |
| December 16, 2019 | 0 | -19.2 | 11.8 |
| December 23, 2019 | 0 | -26.9 | 12.2 |
| December 30, 2019 | 0 | -26.4 | 12.6 |
| January 6, 2020 | 0 | -28.0 | 13.0 |
| January 13, 2020 | 0 | -30.7 | 13.1 |
| January 20, 2020 | 0 | -27.1 | 13.6 |
| January 27, 2020 | 0 | -22.5 | 13.8 |
| February 3, 2020 | 0 | -28.8 | 14.1 |
| February 10, 2020 | 0 | -26.2 | 14.5 |
| February 17, 2020 | 0 | -31.9 | 14.4 |
| February 24, 2020 | 0 | -24.0 | 14.6 |
| March 2, 2020 | 0 | -35.5 | 14.8 |
| March 9, 2020 | 0 | -37.9 | 14.7 |
*Note: We expect data to fall within the following ranges: Length of day, 0-24 hours; Temperature, -40 to 14 degrees C; Sea ice extent, 3-15 million km2
**Day when MOSAiC reached the ice floe that the Polarstern will become frozen in and drift with for the next year.
Contribute to the Museum of MOSAiC Art (MoMOA)
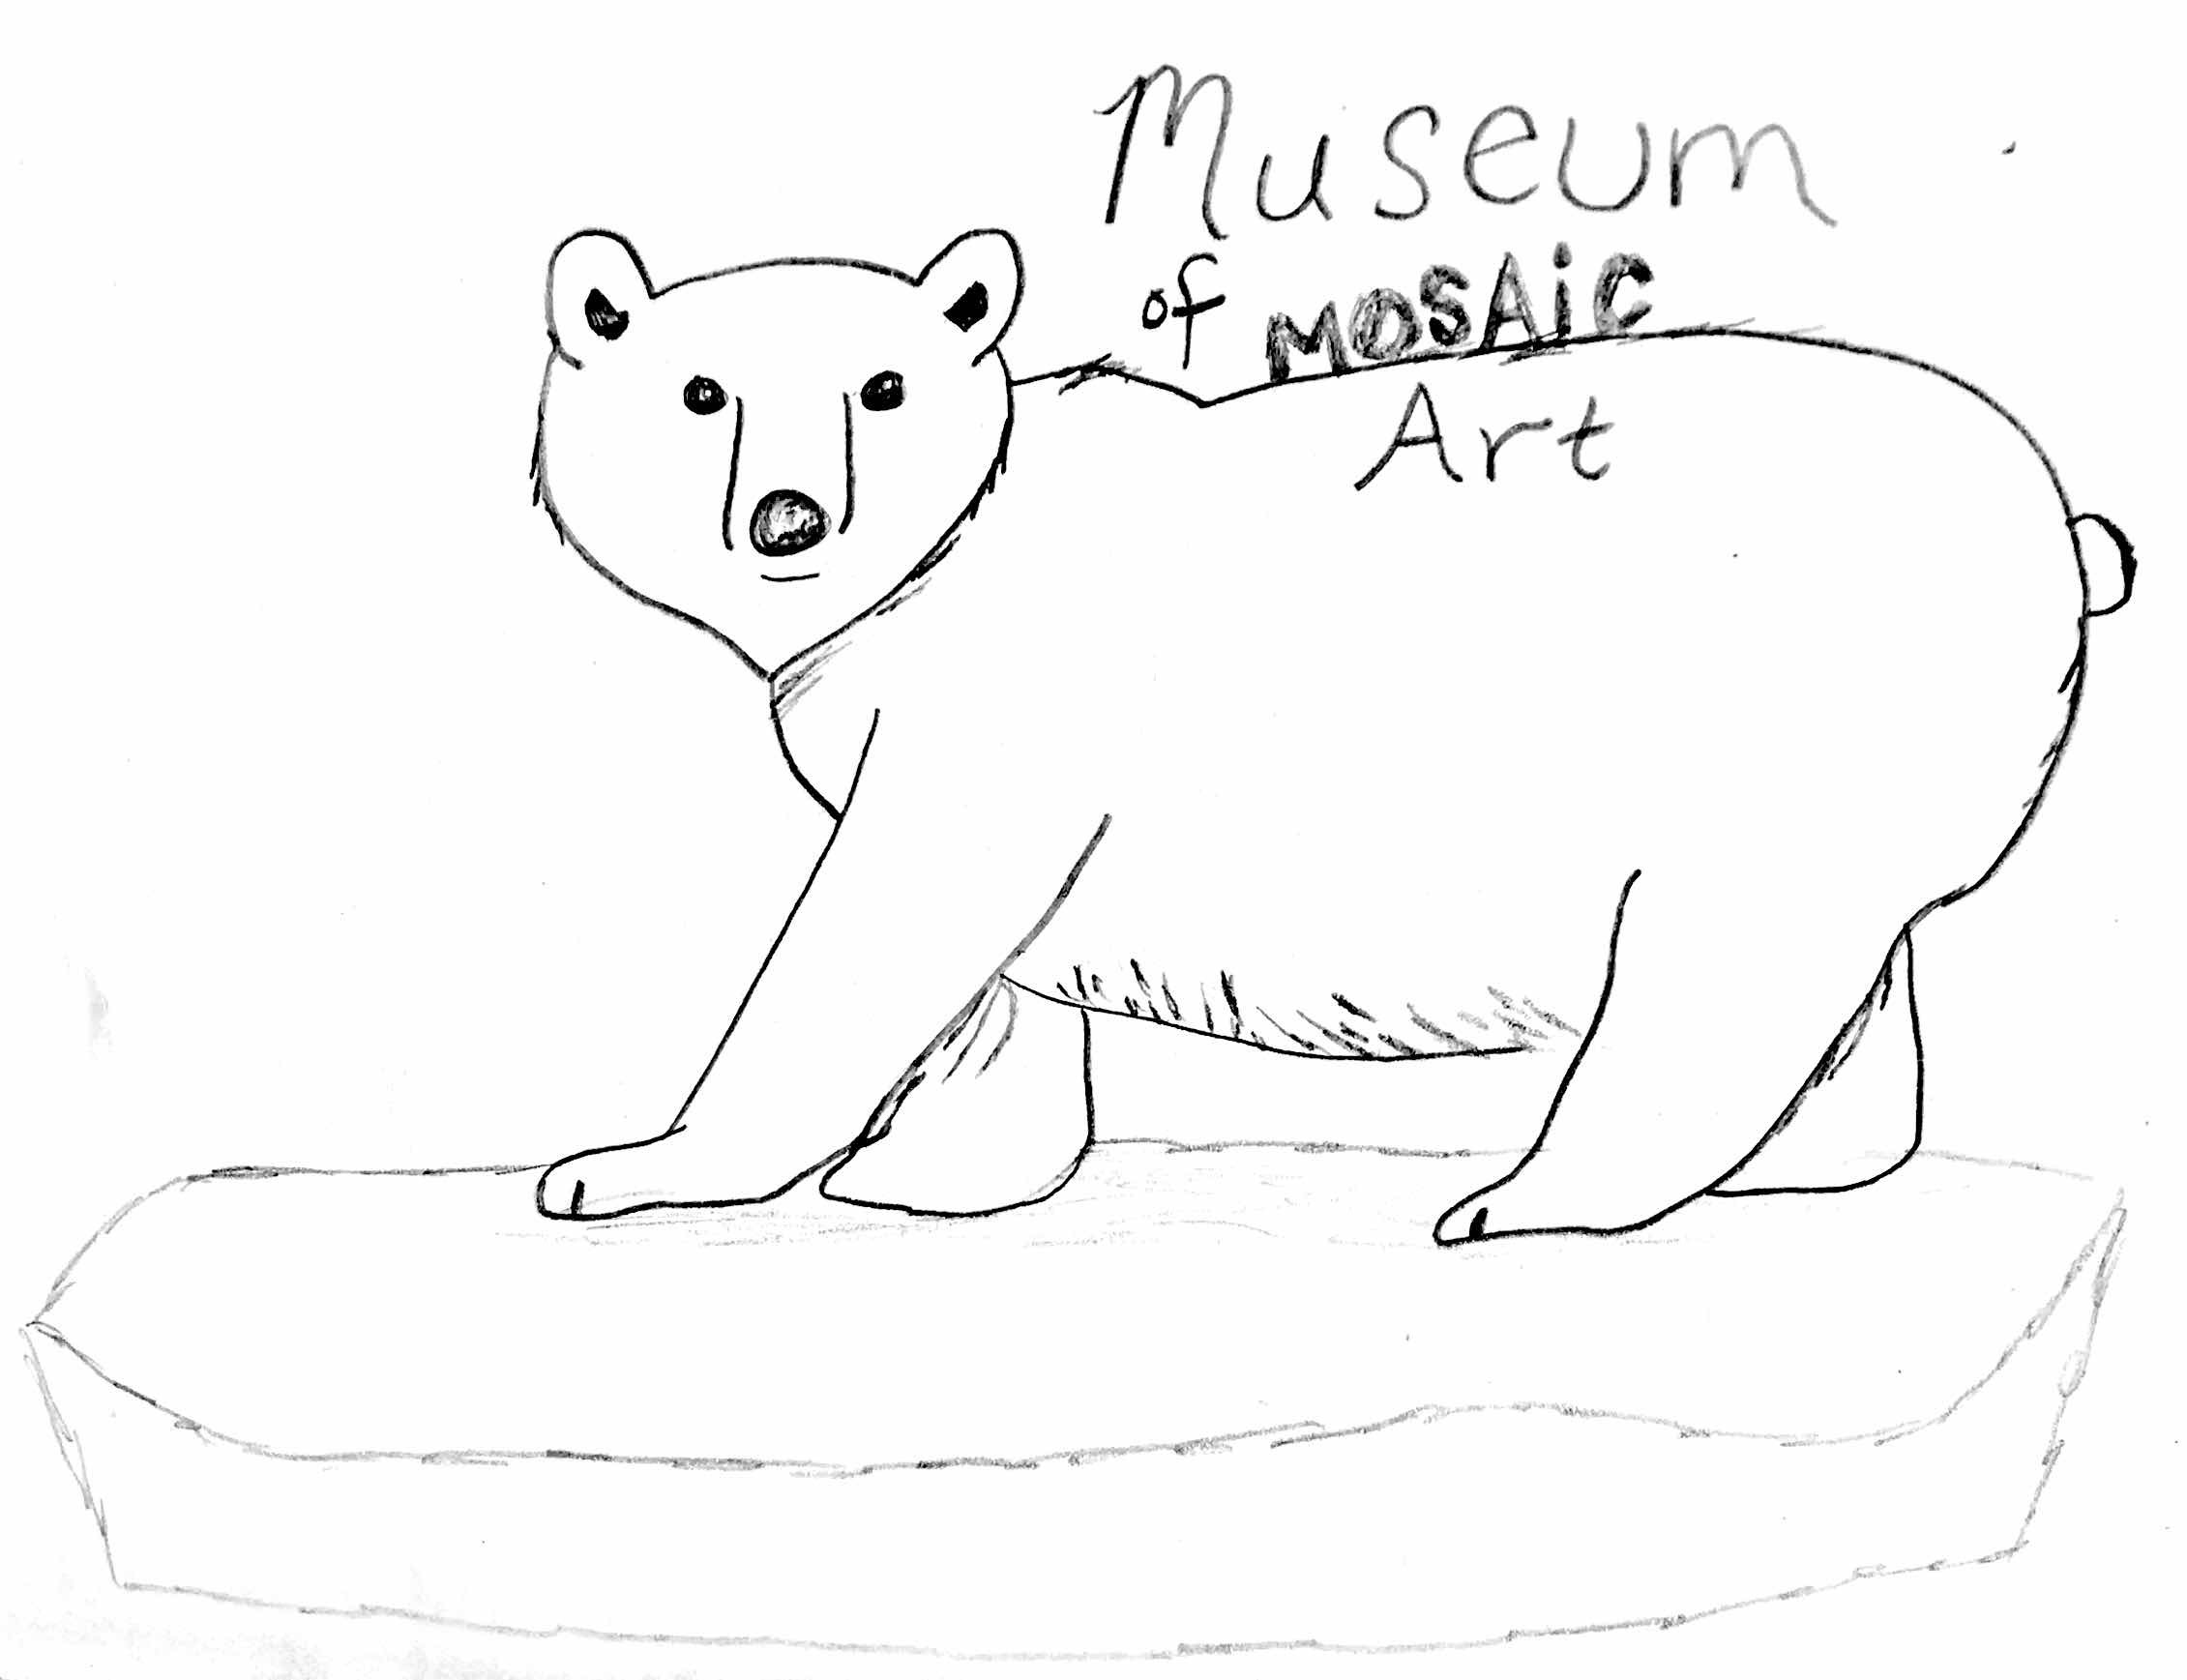
Do you like to draw, paint, sculpt, take photos, build models, knit, sew, write poetry, or engage in any other kind of creative endeavor? We want you to send us photos or scans of your MOSAiC-themed artwork! You can use any artistic medium you like and submit as many creations as you wish to the following categories:
- How the Arctic affects you
- Arctic exploration
- People of the Arctic
- MOSAiC science
- Arctic flora and fauna
- Arctic land and seascapes
- Life on an Arctic icebreaker
- Abstract Arctic
- Other
We'll be showcasing your artwork in the new virtual Museum of MOSAiC Art (MoMOA). Submit photos or scans of your artwork using the submission form below (open to all ages)!
Submit your artwork
Check out the Museum of MOSAiC Art
Questions? Email us with the subject line "MOSAiC Art": mosaic@colorado.edu
Opportunities for Students and Educators
MOSAiC + Reach the World
Exciting news! The MOSAiC education & outreach team has partnered with Reach the World to connect more classrooms to the MOSAiC expedition. Over the coming months, Reach the World will share MOSAiC team members' incredible stories about the expedition, its research, and the everyday challenges of life in the Arctic.
Happening now: MOSAiC expedition videographer and photographer Amy Richman and PolarTREC educator Katie Gavenus, both participants on MOSAiC Leg I, share why it is important to document expeditions like MOSAiC and places like the Arctic.
Learn more from Amy and Katie on Reach the World's MOSAiC expedition page
Watch Amy and Katie's classroom video call from March 2
Iceland: Nature Untamed Summer Experience for Middle Schoolers
Iceland, a land of natural wonders, is also a land of change, some of it good, some of it not so good. On this 11-day journey (June 23 - July 3) with a science expert from The New York Times, see how this transformation, some of it linked to climate change, shows up in its glaciers, waterfalls and thermal pools, and how Iceland is dealing with it. Seventh and eighth graders can get an inside look into how a small nation deals with some of the problems the rest of the world faces in this immersive experience.
Follow the 2020 PolarTREC Expedition With the International Arctic Buoy Programme
Follow PolarTREC educator Sarah Johnson as she joins the Arctic Science Expedition team with the International Arctic Buoy Programme this spring and summer to deploy buoys in the Arctic Ocean. Buoys are invaluable instruments that provide meteorological and oceanographic data for all sorts of purposes: scientific research, weather forecasting, climate model validation, and more!
Follow Sarah's blog and social media posts
Learn more about PolarTREC and the International Arctic Buoy Programme
 MOSAiC Monday and the NGSS
What do those funny symbols below some engagements mean?
Good news for educators in the U.S. teaching with the Next Generation Science Standards (NGSS) or similar! We will now be tagging MOSAiC Monday engagements with the NGSS Disciplinary Core Idea subject(s), Science and Engineering Practice(s), and Crosscutting Concept(s) that they most closely connect to. Look for these symbols listed below each engagement:
Disciplinary Core Idea Subjects
Science and Engineering Practices (adopted from the San Diego County Office of Education Science Resource Center)
Crosscutting Concepts (adopted from the San Diego County Office of Education Science Resource Center)
Is there something you'd like to see in MOSAiC Monday? Let us know!
Send us your feedback
New to MOSAiC Monday? Check out past editions!
Browse more expedition-related educational resources, videos, and blogs
Email us! mosaic@colorado.edu