 This week's Museum of MOSAiC Art Challenge: Create a sea ice design!
Submit your designs to be displayed in a MoMOA Virtual Gallery
Out With the Old
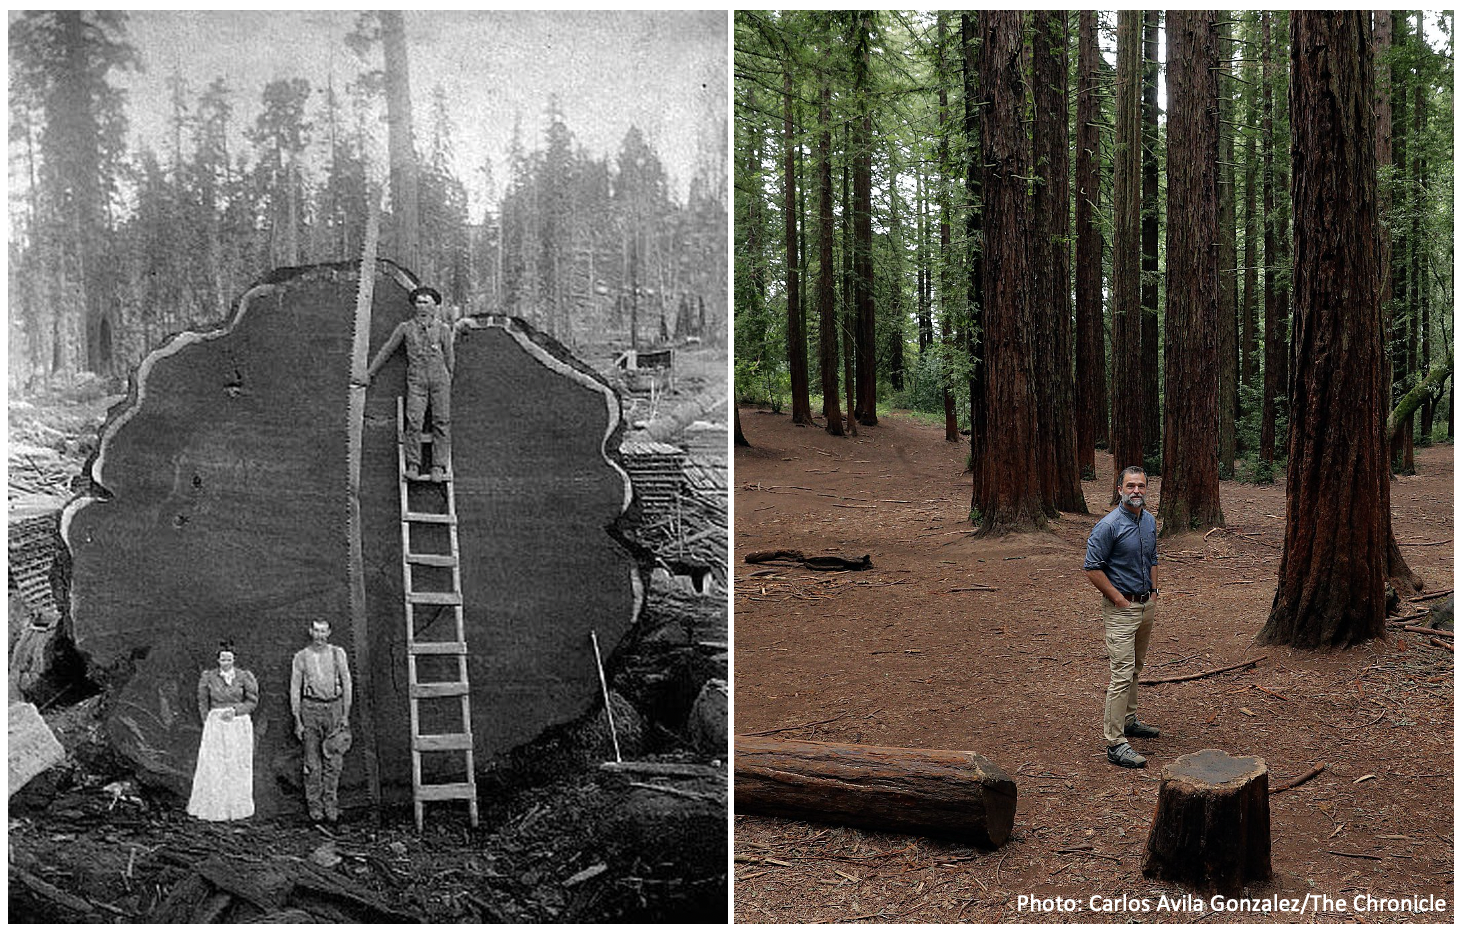
Thousands of miles away from the Arctic along the Central coast of California there is a small stand of magnificent trees upwards of 10 feet in diameter, hundreds of feet tall, and a thousand or more years old. These woodland giants are some of the last old growth redwoods left in California, and on the planet. Ninety-five percent of old growth redwoods have been cut down, stemming from the gold rush that brought throngs of people west in the United States in the mid-1800s and a subsequent demand for lumber. Most of the redwood forests in Central and Northern California now are made up of relatively young ‘second-growth’ trees, but they aren’t the same. Old growth redwoods are stronger and more durable than second growth, and they support ecosystems that are more diverse and resilient.
But what does this have to do with the Arctic?
In With the New
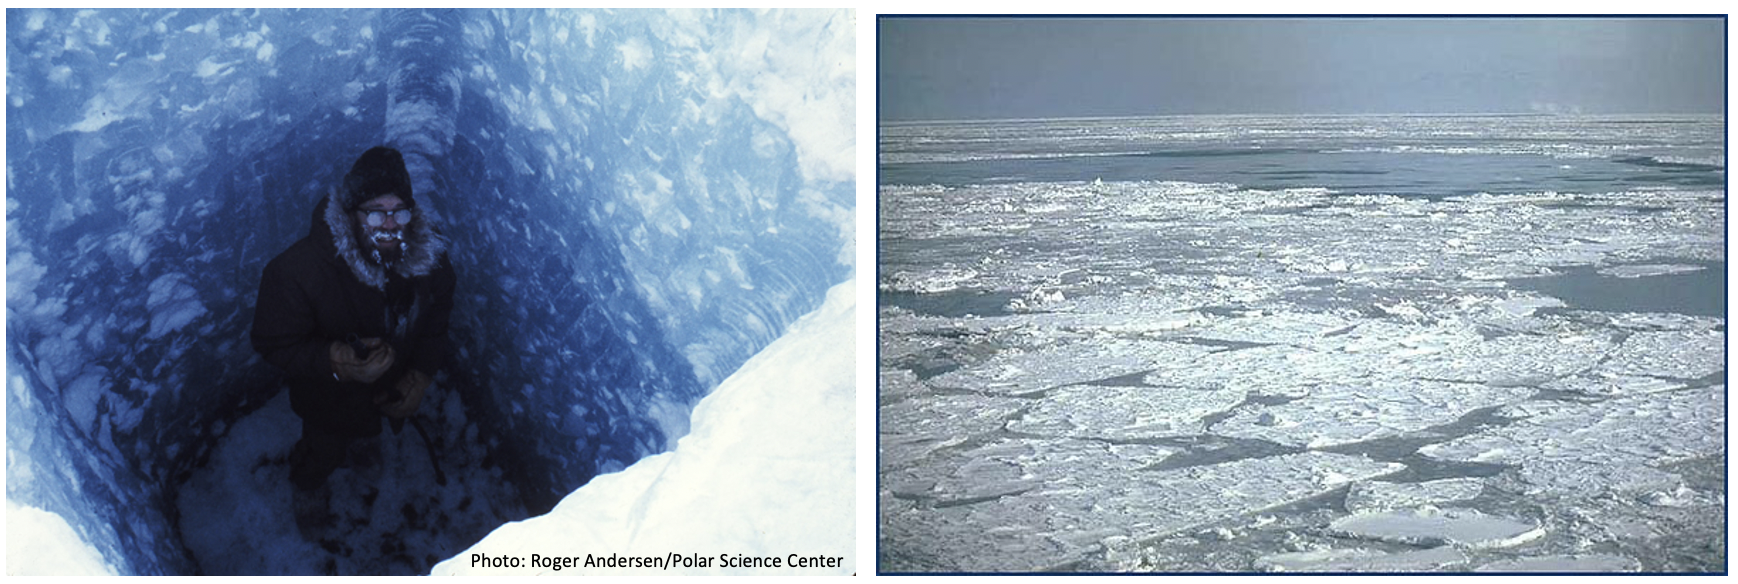
You won’t find any trees in the Central Arctic, but you will find plenty of sea ice. And it turns out that despite their geographic distance, Arctic sea ice and California redwood forests have something significant in common—over time, they are becoming younger, to the detriment of the ecosystems they support. In fact, there is an eerie parallel between redwood forests and Arctic sea ice—just as 95% of old growth forests have been cut down, the Arctic has lost 95% of its oldest, thickest sea ice, according to the 2018 Arctic Report Card.
Harder, Fresher, Older, Stronger
What makes old, or multiyear, sea ice more resilient than younger, or first-year, sea ice? To answer this question, we have to first explore what happens to sea ice throughout the year. Sea ice goes though what's called a growth and melt cycle. When sunlight and temperatures decrease in the fall and winter, sea ice in the Arctic freezes, growing thicker and more extensive. In the spring and summer when solar radiation and temperatures increase, sea ice melts. If sea ice has not grown thick enough in the fall and winter, it can actually melt completely in the spring and summer. Sea ice that is thick enough and doesn't melt completely will just thin out in the summer and grow thicker again in the winter - this is what we call multiyear ice. It's perhaps not surprising to know that there is a correlation between sea ice thickness and its age. Can you guess what that correlation is?
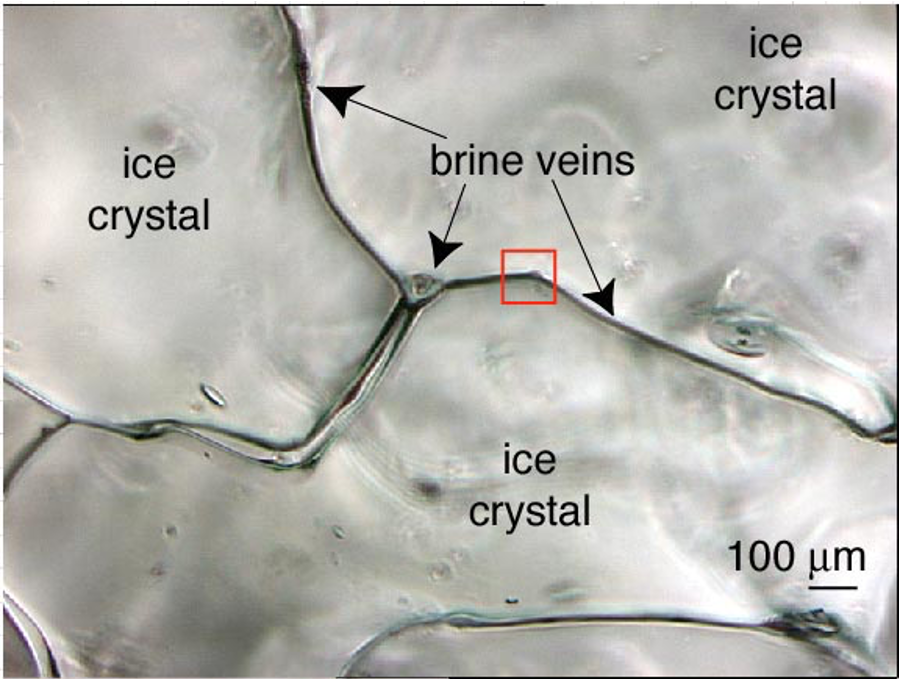
When sea ice forms, salt usually gets expelled into the water that is left behind, but some salt can actually get trapped in droplets in little pockets between ice crystals—we call these brine pockets (or if they are connected, brine channels or veins; Image credit: Junge et al., 2001). While some people get saltier with age, sea ice actually gets fresher—brine gets flushed out of sea ice during the melt season. Ice that has less brine in it is actually 'stiffer' than ice that has more brine pockets. So in addition to being thicker, multiyear ice is also more durable! Icebreaker ships like the Polarstern have a harder time breaking through multiyear ice than they do first-year ice.
Learn more about sea ice thickness with this self-guided activity from EarthLabs
What does sea ice look like under polarized light? Check out the many colors of ice
 Hands-On Science At Home: Create your own brine channels
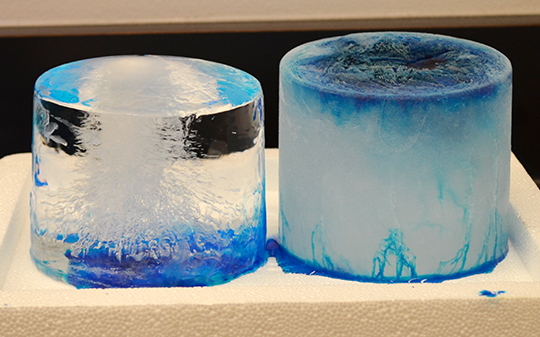
You can create your very own sea ice cores and observe brine channels with a few simple materials from your kitchen! Check out the experiment below, created by Kyle Kinzler at Arizona State University. Photo credit: ASU
Create your own sea ice cores and brine channels
 New Ice, New Problems
In last week's MOSAiC Monday, we told you how the Polarstern has drifted faster and farther than expected, which made expedition leaders wonder if it would melt out of its ice enclosure long before the expedition is supposed to end. While this is not really an issue any longer since the Polarstern has temporarily left its floe (more on this next week!), it is still an interesting and alarming phenomenon that stems from the fact that there is more new ice in the Arctic, and newer, thinner ice moves faster than older, thicker ice. There are other ways in which the Arctic is and could change as a result of the changing sea ice demographic. Can you think of any? Read the two short articles below, and write down a short summary of each that explains what the potential impacts of younger sea ice in the Arctic could be.
Article 1: Science News for Students: Arctic ice travels fast, carrying pollution
Article 2: Tanker becomes first to cross Arctic without icebreaker
 #askmosaic: There's Something in the Air
This question was submitted by Godlove at West Bronx Academy For the Future in NYC: What if a big volcano explosion were to happen where its ashes completely covered the sun? How would it affect the Arctic's climate and other surroundings? Will things go back to normal or will something change?
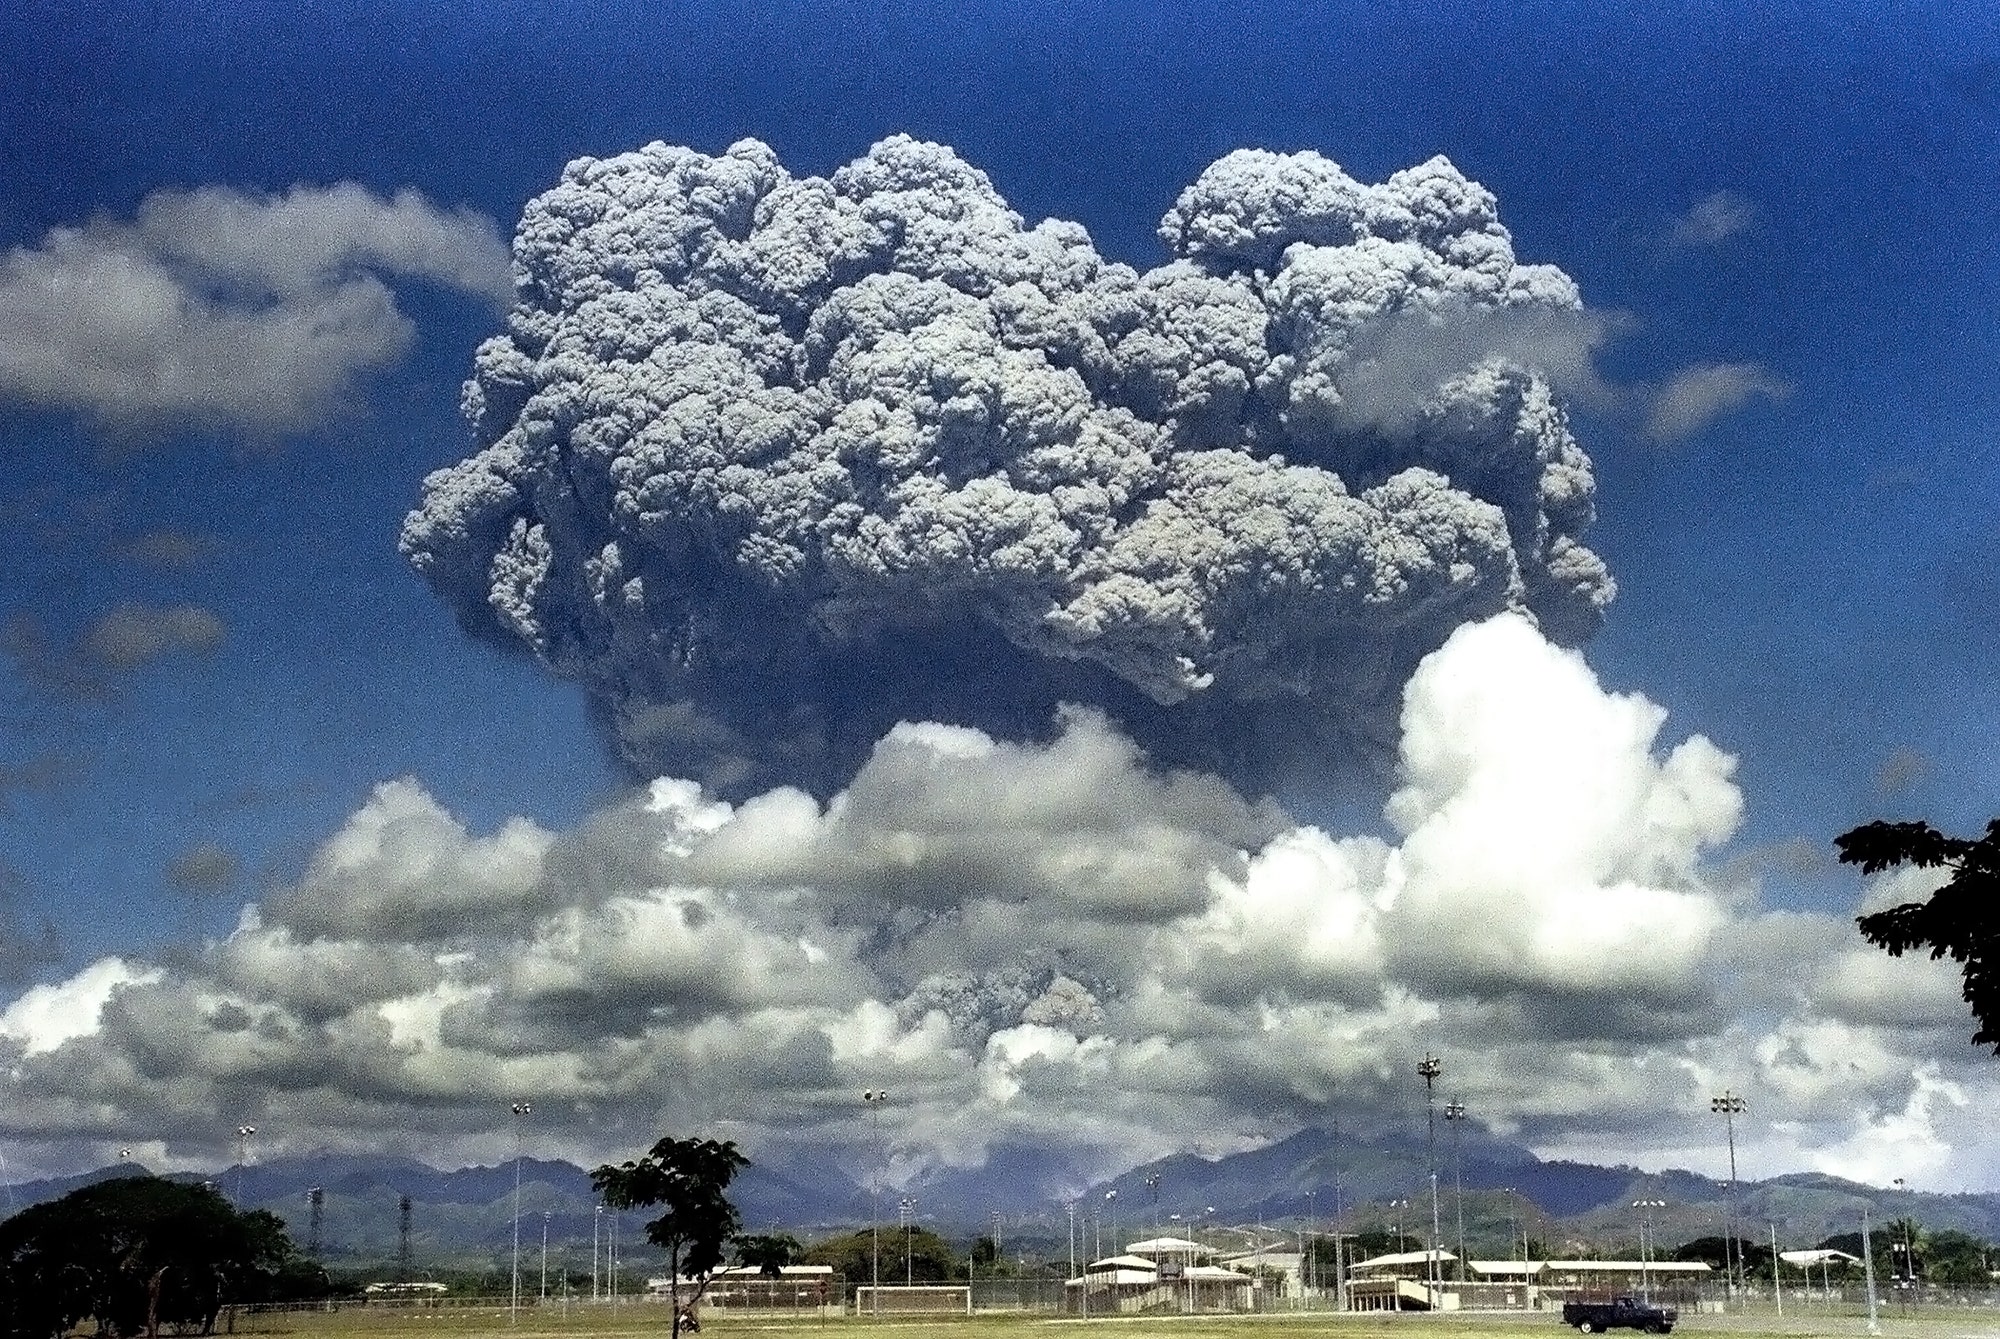
If the ash of a volcano (that is in reality particles created from sulfur dioxide that the volcano emits) reaches high altitudes like 20 km (~12 mi) or higher, then these particles can stay in the atmosphere for months and reflect more sunlight than the atmosphere would otherwise do. It will become colder on Earth for as long as the particles are there. One good example is the Pinatubo eruption in the beginning of the 90s. The planet cooling down by a fraction of a degree will mean that also the Arctic cools down. However, as soon as the particles are removed naturally, through falling out from the atmosphere, the effect is gone and all goes back to the current status.
-Julia Schmale, Aerosol Scientist and member of MOSAiC Team Atmosphere
The Mount Pinatubo eruption in the Philippines that occurred on June 15, 1991 (shown in the photo; photo credit: Arlan Naeg/AFP/Getty Images) sent a huge cloud of ash as high as 22 miles into the atmosphere. Twenty million tons of sulfur dioxide gas were also injected into Earth's stratosphere. If you remember from the February 24th MOSAiC Monday (seems like ages ago now!), the stratosphere is the layer above the troposphere in the atmosphere. The troposphere is where nearly all of Earth's weather occurs. When sulfur dioxide reacts with water in the atmosphere, it turns into droplets of sulfuric acid. Sulfuric acid in the troposphere would get fairly quickly washed out by rain. But sulfuric acid in the stratosphere can stay there for years, scattering and absorbing sunlight that would otherwise reach the earth's surface. This is exactly what happened after Pinatubo erupted, and as a result, this eruption caused a global cooling effect of about 1 degree F (0.6 degrees C) over the next two years!
Send us your #askmosaic questions!
Fun At Home: Color the Polarstern!
Need a calming and fun activity to do while you're at home? We invite you to color the Polarstern! Artist Richard Yeomans created this drawing of the Polarstern for the Alfred Wegener Institute, and now we're giving it to you. Click on the picture to download and print a larger version. If you like, send us your completed masterpieces to be showcased in the Museum of MOSAiC Art!
Submit your artwork to the Museum of MOSAiC Art
 This week's featured remote learning resources
NOAA Physical Sciences Laboratory: Funtastic Science Talks
NOAA;s Physical Sciences Laboratory presents Funtastic Science Talks, informal presentations for kids by NOAA and CIRES researchers about all sorts of engaging science topics like ocean creatures and Arctic exploration. MOSAiC scientist Taneil Uttal recently gave a presentation about what it was like to live and work on board a ship frozen in sea ice in the Arctic!
Learn more about Funtastic Science Talks
Watch Taneil Uttal's presentation about the MOSAiC expedition
Check out our full list of virtual and at-home polar learning resources here!
 MOSAiC Weekly Tracking
Plot the Polarstern
Each week we will provide you with the latitude and longitude coordinates of the Polarstern so that you can track its journey across the Arctic.
Download the map to plot coordinates
Download a larger map of the Arctic for a bigger picture view of the expedition area
Location of the Polarstern
| Date | Latitude | Longitude |
| September 16, 2019 | 69.68 N | 18.99 E |
| September 23, 2019 | 72.31 N | 26.93 E |
| September 30, 2019 | 85.12 N | 138.05 E |
| October 4, 2019** | 85.08 N | 134.43 E |
| October 7, 2019 | 85.10 N | 133.82 E |
| October 14, 2019 | 84.85 N | 135.03 E |
| October 21, 2019 | 84.97 N | 132.73 E |
| October 28, 2019 | 85.47 N | 127.07 E |
| November 4, 2019 | 85.88 N | 121.70 E |
| November 11, 2019 | 85.82 N | 116.00 E |
| November 18, 2019 | 86.05 N | 122.43 E |
| November 25, 2019 | 85.85 N | 121.35 E |
| December 2, 2019 | 85.97 N | 112.95 E |
| December 9, 2019 | 86.25 N | 121.40 E |
| December 16, 2019 | 86.62 N | 118.12 E |
| December 23, 2019 | 86.63 N | 113.20 E |
| December 30, 2019 | 86.58 N | 117.13 E |
| January 6, 2020 | 87.10 N | 115.10 E |
| January 13, 2020 | 87.35 N | 106.63 E |
| January 20, 2020 | 87.42 N | 97.77 E |
| January 27, 2020 | 87.43 N | 95.82 E |
| February 3, 2020 | 87.42 N | 93.65 E |
| February 10, 2020 | 87.78 N | 91.52 E |
| February 17, 2020 | 88.07 N | 78.52 E |
| February 24, 2020 | 88.58 N | 52.87 E |
| March 2, 2020 | 88.17 N | 31.02 E |
| March 9, 2020 | 87.93 N | 24.20 E |
| March 16, 2020 | 86.87 N | 12.70 E |
| March 23, 2020 | 86.20 N | 15.78 E |
| March 30, 2020 | 85.37 N | 13.27 E |
| April 6, 2020 | 84.52 N | 14.38 E |
| April 13, 2020 | 84.28 N | 14.97 E |
| April 20, 2020 | 84.52 N | 14.57 E |
| April 27, 2020 | 83.93 N | 15.65 E |
| May 4, 2020 | 83.92 N | 18.03 E |
| May 11, 2020 | 83.47 N | 13.08 E |
| May 18+, 2020 | 83.32 N | 8.68 E |
| May 25+, 2020 | 82.43 N | 8.28 E |
**Day when MOSAiC reached the ice floe that the Polarstern will become frozen in and drift with for the next year.
+ The Polarstern temporarily left its floe on Saturday, May 16th and is motoring south to meet up with the resupply vessel (not drifting)
Log MOSAiC Data
Keep track of Arctic conditions over the course of the expedition:
Download Data Logbook for Sept. 2019 - Dec. 2019
Download Data Logbook for Dec. 2019 - Mar. 2020
Download Data Logbook for Mar. 2020 - June 2020
| Date | Length of day (hrs) | Air temperature (deg C) at location of Polarstern | Arctic Sea Ice Extent (million km2) |
| September 16, 2019 | 13.25 | High: 10 Low: 4.4 | 3.9 |
| September 23, 2019 | 12.35 | High: 6 Low: -1 | 4.1 |
| September 30, 2019 | 9.1 | -4.7 | 4.4 |
| October 4, 2019** | 6.27 | -13.0 | 4.5 |
| October 7, 2019 | 3.05 | -8.2 | 4.6 |
| October 14, 2019 | 0 | -14.7 | 4.8 |
| October 21, 2019 | 0 | -12.8 | 5.4 |
| October 28, 2019 | 0 | -18.3 | 6.8 |
| November 4, 2019 | 0 | -18.9 | 8.0 |
| November 11, 2019 | 0 | -25.5 | 8.7 |
| November 18, 2019 | 0 | -10.7 | 9.3 |
| November 25, 2019 | 0 | -18.4 | 10.0 |
| December 2, 2019 | 0 | -26.6 | 10.4 |
| December 9, 2019 | 0 | -23.1 | 11.2 |
| December 16, 2019 | 0 | -19.2 | 11.8 |
| December 23, 2019 | 0 | -26.9 | 12.2 |
| December 30, 2019 | 0 | -26.4 | 12.6 |
| January 6, 2020 | 0 | -28.0 | 13.0 |
| January 13, 2020 | 0 | -30.7 | 13.1 |
| January 20, 2020 | 0 | -27.1 | 13.6 |
| January 27, 2020 | 0 | -22.5 | 13.8 |
| February 3, 2020 | 0 | -28.8 | 14.1 |
| February 10, 2020 | 0 | -26.2 | 14.5 |
| February 17, 2020 | 0 | -31.9 | 14.4 |
| February 24, 2020 | 0 | -24.0 | 14.6 |
| March 2, 2020 | 0 | -35.5 | 14.8 |
| March 9, 2020 | 0 | -37.9 | 14.7 |
| March 16, 2020 | 10.5 | -27.5 | 14.7 |
| March 23, 2020 | 16.5 | -28.7 | 14.4 |
| March 30, 2020 | 24 | -28.6 | 14.0 |
| April 6, 2020 | 24 | -18.2 | 13.7 |
| April 13, 2020 | 24 | -25.8 | 13.6 |
| April 20, 2020 | 24 | -10.2 | 13.3 |
| April 27, 2020 | 24 | -11.7 | 12.8 |
| May 4, 2020 | 24 | -16.2 | 12.8 |
| May 11, 2020 | 24 | -10.4 | 12.4 |
| May 18, 2020 | 24 | -5.1 | 11.7 |
| May 25, 2020 | 24 | 0.4 | 11.5 |
*Note: We expect data to fall within the following ranges: Length of day, 0-24 hours; Temperature, -40 to 14 degrees C; Sea ice extent, 3-15 million km2
**Day when MOSAiC reached the ice floe that the Polarstern will become frozen in and drift with for the next year.
Is there something you'd like to see in MOSAiC Monday? Let us know!
Send us your feedback
New to MOSAiC Monday? Check out past editions!
Browse more expedition-related educational resources, videos, and blogs
Email us! mosaic@colorado.edu

