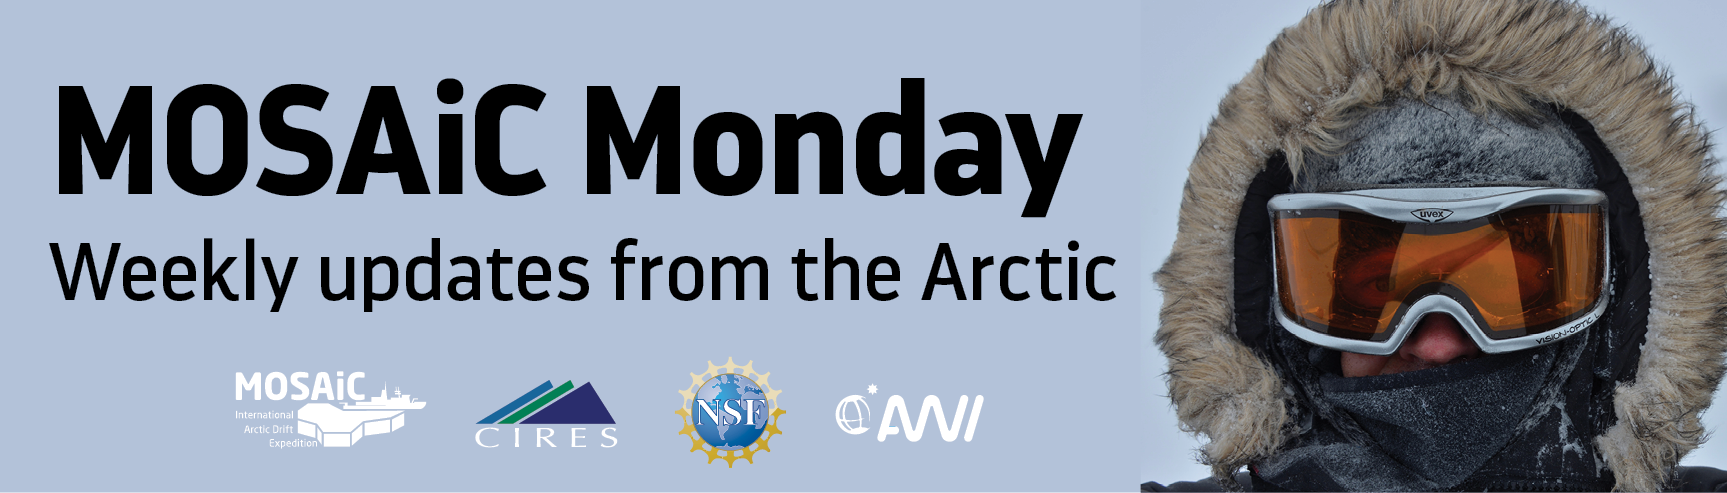
What's New: Remote Sensing in Remote Places
The KuKa radar of the University of Manitoba was just installed on the ice at the remote sensing site next to Ocean City near the Polarstern (photo: Stefan Hendricks). The radar will support future satellite sea ice measurements and help scientists better understand the influence of snow on sea ice thickness.
What is remote sensing?
40+ years of sea ice satellite data
About the MOSAiC ice camp and 'science cities'
How can MOSAiC Monday best serve you?
We want to make sure you're getting the resources and information you want from MOSAiC Monday. Is there something you'd like to see, or that you'd like more of? If you are an educator, are you using MOSAiC Monday in your classroom, and if so, how? Let us know what you think!
Send us your feedback
 #askmosaic: And to All a Polar Night
Student Question: The Polarstern is now in polar night, so there is no sunrise or sunset seen from the ship. What is the meaning of 'length of day' in the MOSAiC Weekly Tracking data log?
You caught us! If you've been keeping track of the Arctic Data we provide each week (see 'MOSAiC Weekly Tracking' below), you might have noticed something a little weird going on with the 'length of day' numbers in the Arctic Data table (mainly that we've changed them a few times!). Since direct communication with folks aboard the ship isn't always easy and the weather doesn't always cooperate, we've been using models to calculate and estimate day length in the Arctic. As we've been able to find more refined models, we've updated our numbers.
All of the Arctic data we report is for the location of the Polarstern, which changed latitudes quickly in the beginning of the expedition as it traveled north in the Arctic looking for a sea ice floe. Latitude is one of the main determinants of day length at a particular location throughout the year.
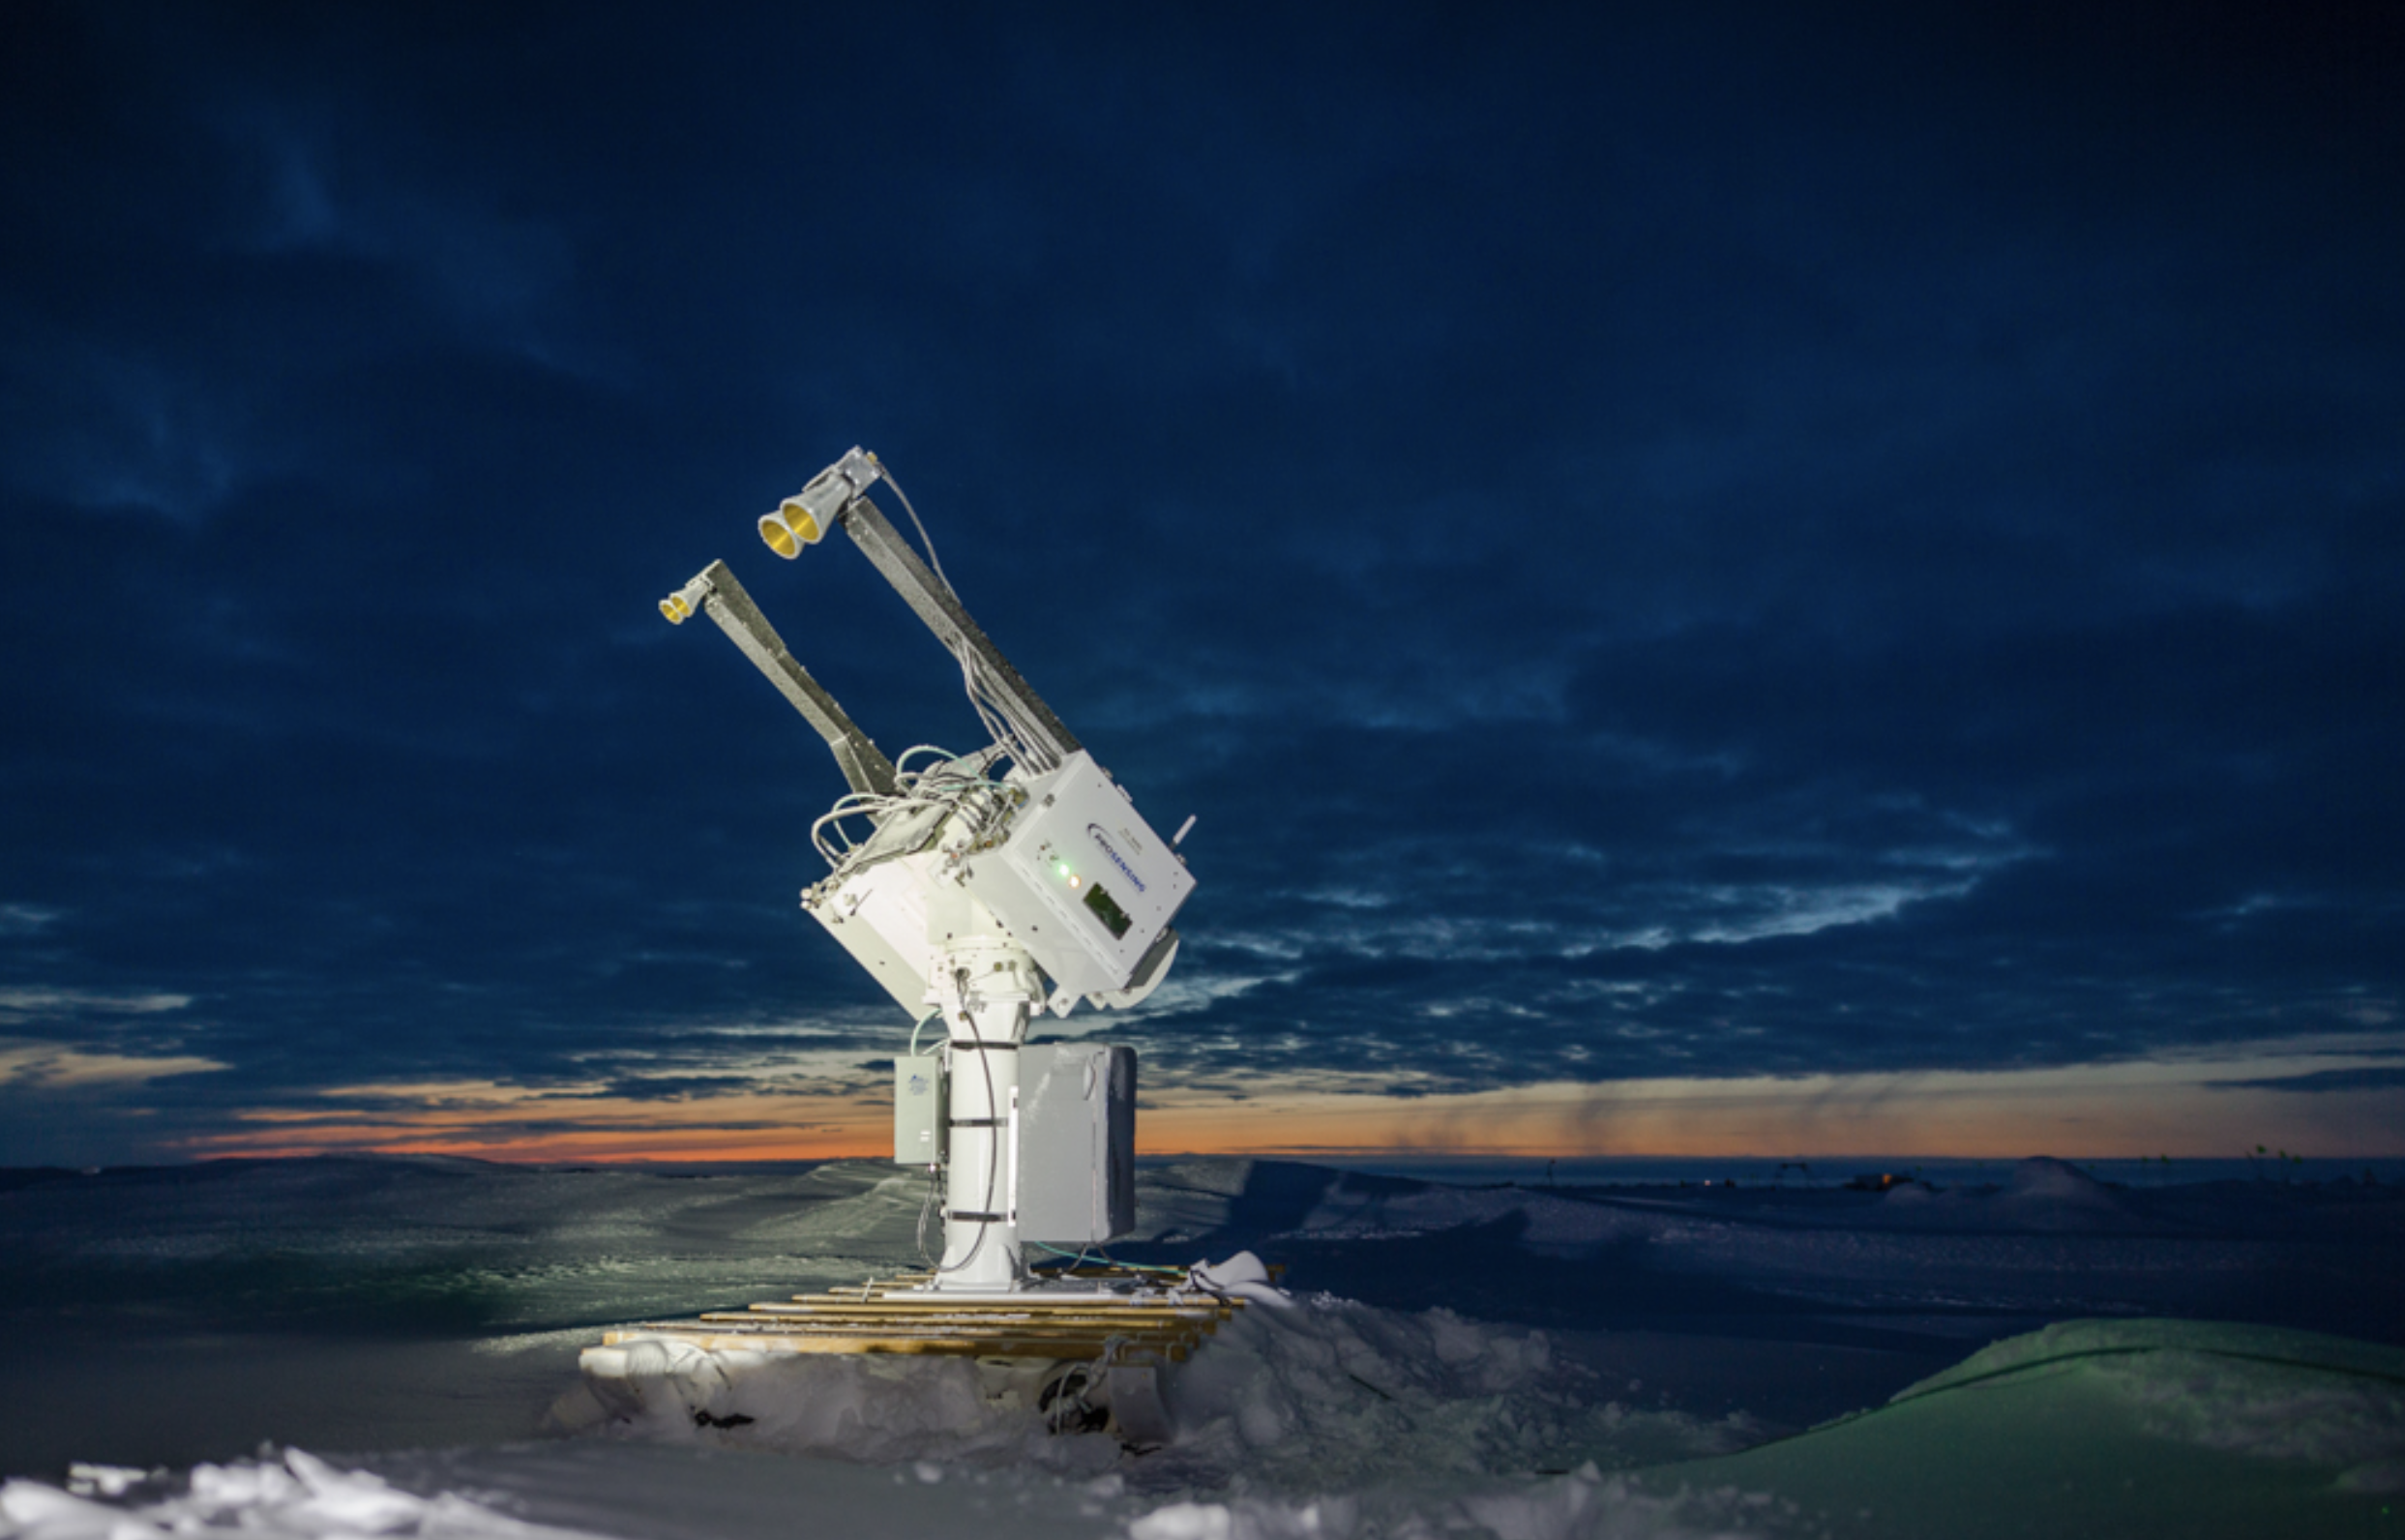
So what exactly do we mean by day length? We are referring specifically to the amount of time the sun spends above the horizon. MOSAiC expedition participants aboard the Polarstern are now in polar night, meaning the sun doesn't rise above the horizon at any time. Photo: Polarstern in polar night; Esther Horvath.
Read more about a firsthand experience of polar winter
Send us your questions!
![]()
![]()
![]()
 Quick Bite: Here Comes the Sun...Eventually
How long will the Polarstern be in polar night? When will those aboard the icebreaker next see the sun rise? In small groups, have students predict what day they think the sun will next rise for those aboard the Polarstern. Write all predictions on the board. Then, have students use the Day Length Calculator to figure out what day the sun will next rise based on an estimated location of the icebreaker.
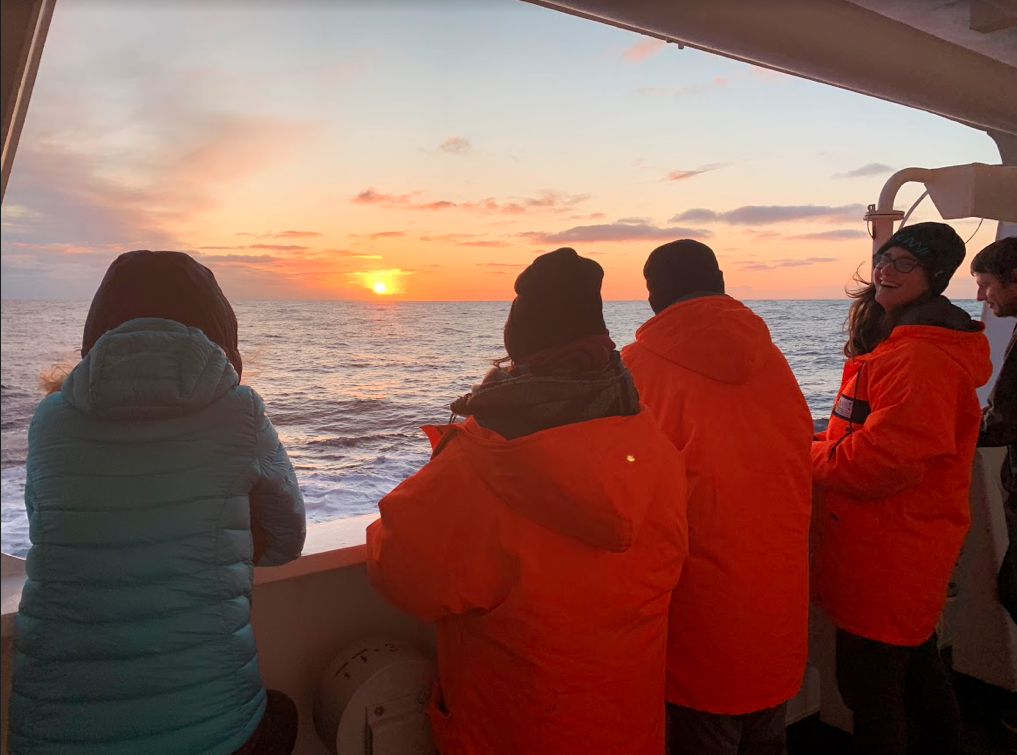
Photo below: Participants aboard the Russian support icebreaker Fedorov were excited see the sun rise for the first time in about a week as they made their way south back to Tromsø to pick up participants for the next leg of the expedition; Photo credit: Anne Gold
How to use the Day Length Calculator
1. Enter in a latitude and longitude location for the Polarstern in the 'Location' box. This will be the predicted approximate location for the Polarstern for whatever date the students chose for when the sun will rise next--they can use the map in this article of the Polarstern's projected drift path to estimate a location. To keep it simple, you can ignore the time zone (this means the predicted date of next sunrise could be off by as much as one day, but that's still a close approximation).
2. Enter in the predicted day of next sunrise in the 'Date' box. Double check the year is correct, and choose whatever time you like.
3. The calculator will automatically do its thing. The 'Apparent Sunrise' will either display the date of the next sunrise at the location you chose if you did not choose a date far enough in advance, or it will show the time of sunrise if you did. Play around with the calculator until you figure out the date of the next sunrise at the Polarstern. How does it compare to your prediction?
Day Length Calculator
![]()
![]()
 Daylight to Darkness: Constructing an Explanation
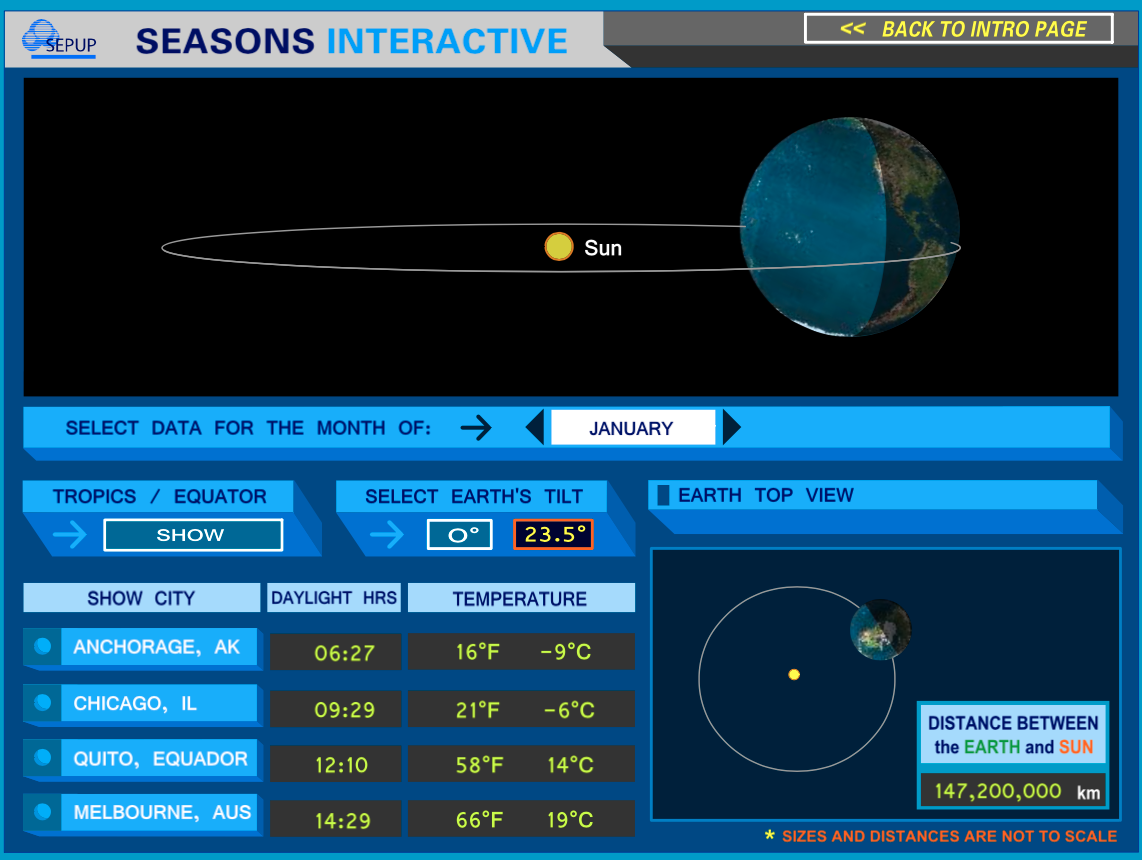
Why does the amount of daylight the Arctic region gets throughout the year vary so much more than regions at lower latitudes? In groups of 2 (or as a whole class), give students a few minutes to play around with this Seasons Interactive. They can change the month of the year which will in turn change the position of the earth in its orbit around the sun. Remind your students that the sizes and distances in this simulation are not to scale! Encourage students to switch the Earth's tilt back and forth between 0 and 23.5 degrees. What do you notice? Can you use this simulation to construct an explanation for why the amount of daylight the high Arctic region gets throughout the year changes from 24 hours in the summer to 0 hours in the winter?
Seasons Interactive
Video: Land of the Midnight Sun
![]()
![]()
![]()
![]()
 MOSAiC Weekly Tracking
Plot the Polarstern
Each week we will provide you with the latitude and longitude coordinates of the Polarstern so that your students can track its journey across the Arctic in your classroom.
Download the map to plot coordinates
Download a larger map of the Arctic for a bigger picture view of the expedition area
Location of the Polarstern
| Date | Latitude | Longitude |
| September 16, 2019 | 69.68 N | 18.99 E |
| September 23, 2019 | 72.31 N | 26.93 E |
| September 30, 2019 | 85.12 N | 138.05 E |
| October 4, 2019** | 85.08 N | 134.43 E |
| October 7, 2019 | 85.10 N | 133.82 E |
| October 14, 2019 | 84.85 N | 135.03 E |
| October 21, 2019 | 84.97 N | 132.73 E |
| October 28, 2019 | 85.47 N | 127.07 E |
| November 4, 2019 | 85.88 N | 121.70 E |
| November 11, 2019 | 85.82 N | 116.00 E |
**Day when MOSAiC reached the ice floe that the Polarstern will become frozen in and drift with for the next year.
Log MOSAiC Data
Download a MOSAiC Data Logbook to keep track of Arctic conditions over the course of the expedition
Arctic Data* - NOTE: Length of day numbers have been updated based on more accurate models!
| Date | Length of day (hrs) | Air temperature (deg C) at location of Polarstern | Arctic Sea Ice Extent (million km2) |
| September 16, 2019 | 13.25 | High: 10 Low: 4.4 | 3.9 |
| September 23, 2019 | 12.35 | High: 6 Low: -1 | 4.1 |
| September 30, 2019 | 9.1 | -4.7 | 4.4 |
| October 4, 2019** | 6.27 | -13.0 | 4.5 |
| October 7, 2019 | 3.05 | -8.2 | 4.6 |
| October 14, 2019 | 0 | -14.7 | 4.8 |
| October 21, 2019 | 0 | -12.8 | 5.4 |
| October 28, 2019 | 0 | -18.3 | 6.8 |
| November 4, 2019 | 0 | -18.9 | 8.0 |
| November 11, 2019 | 0 | -25.5 | 8.7 |
*Note: We expect data to fall within the following ranges: Length of day, 0-24 hours; Temperature, -40 to 14 degrees C; Sea ice extent, 3-15 million km2
**Day when MOSAiC reached the ice floe that the Polarstern will become frozen in and drift with for the next year.
 MOSAiC Monday and the NGSS
What do those funny symbols below each engagement mean?
Good news for educators in the U.S. teaching with the Next Generation Science Standards (NGSS) or similar! We will now be tagging MOSAiC Monday engagements with the NGSS Disciplinary Core Idea subject(s), Science and Engineering Practice(s), and Crosscutting Concept(s) that they most closely connect to. Look for these symbols listed below each engagement:
Disciplinary Core Idea Subjects
Science and Engineering Practices (adopted from the San Diego County Office of Education Science Resource Center)
Crosscutting Concepts (adopted from the San Diego County Office of Education Science Resource Center)
 Opportunity for Educators: Climate Education Resources Webinar
Are you looking for other ways to bring climate education into your classroom? Join the Alliance for Climate Education (ACE) next Thursday, November 14 at 7:00 ET / 4:00 PT for a one-hour webinar to introduce new teachers to Our Climate Our Future, ACE’s climate education resource. If you've heard of Our Climate Our Future but never got around to exploring the resource to see if it’ll work for your class, this webinar is for you. All teachers get a certificate for 60 minutes of continuing education credit and one lucky teacher will go home with a $50 cash prize!
 Follow the Journey
PolarTREC educator Katie Gavenus just returned from a 6-week stint in the Arctic aboard the Russian icebreaker Fedorov on the first leg of the MOSAiC expedition. Read the journal entries she wrote during her time there, and check out the Education Extensions at the end of each journal entry for more Arctic-related classroom activities.