A Literal Mosaic of Science
Building Cities on the Ice
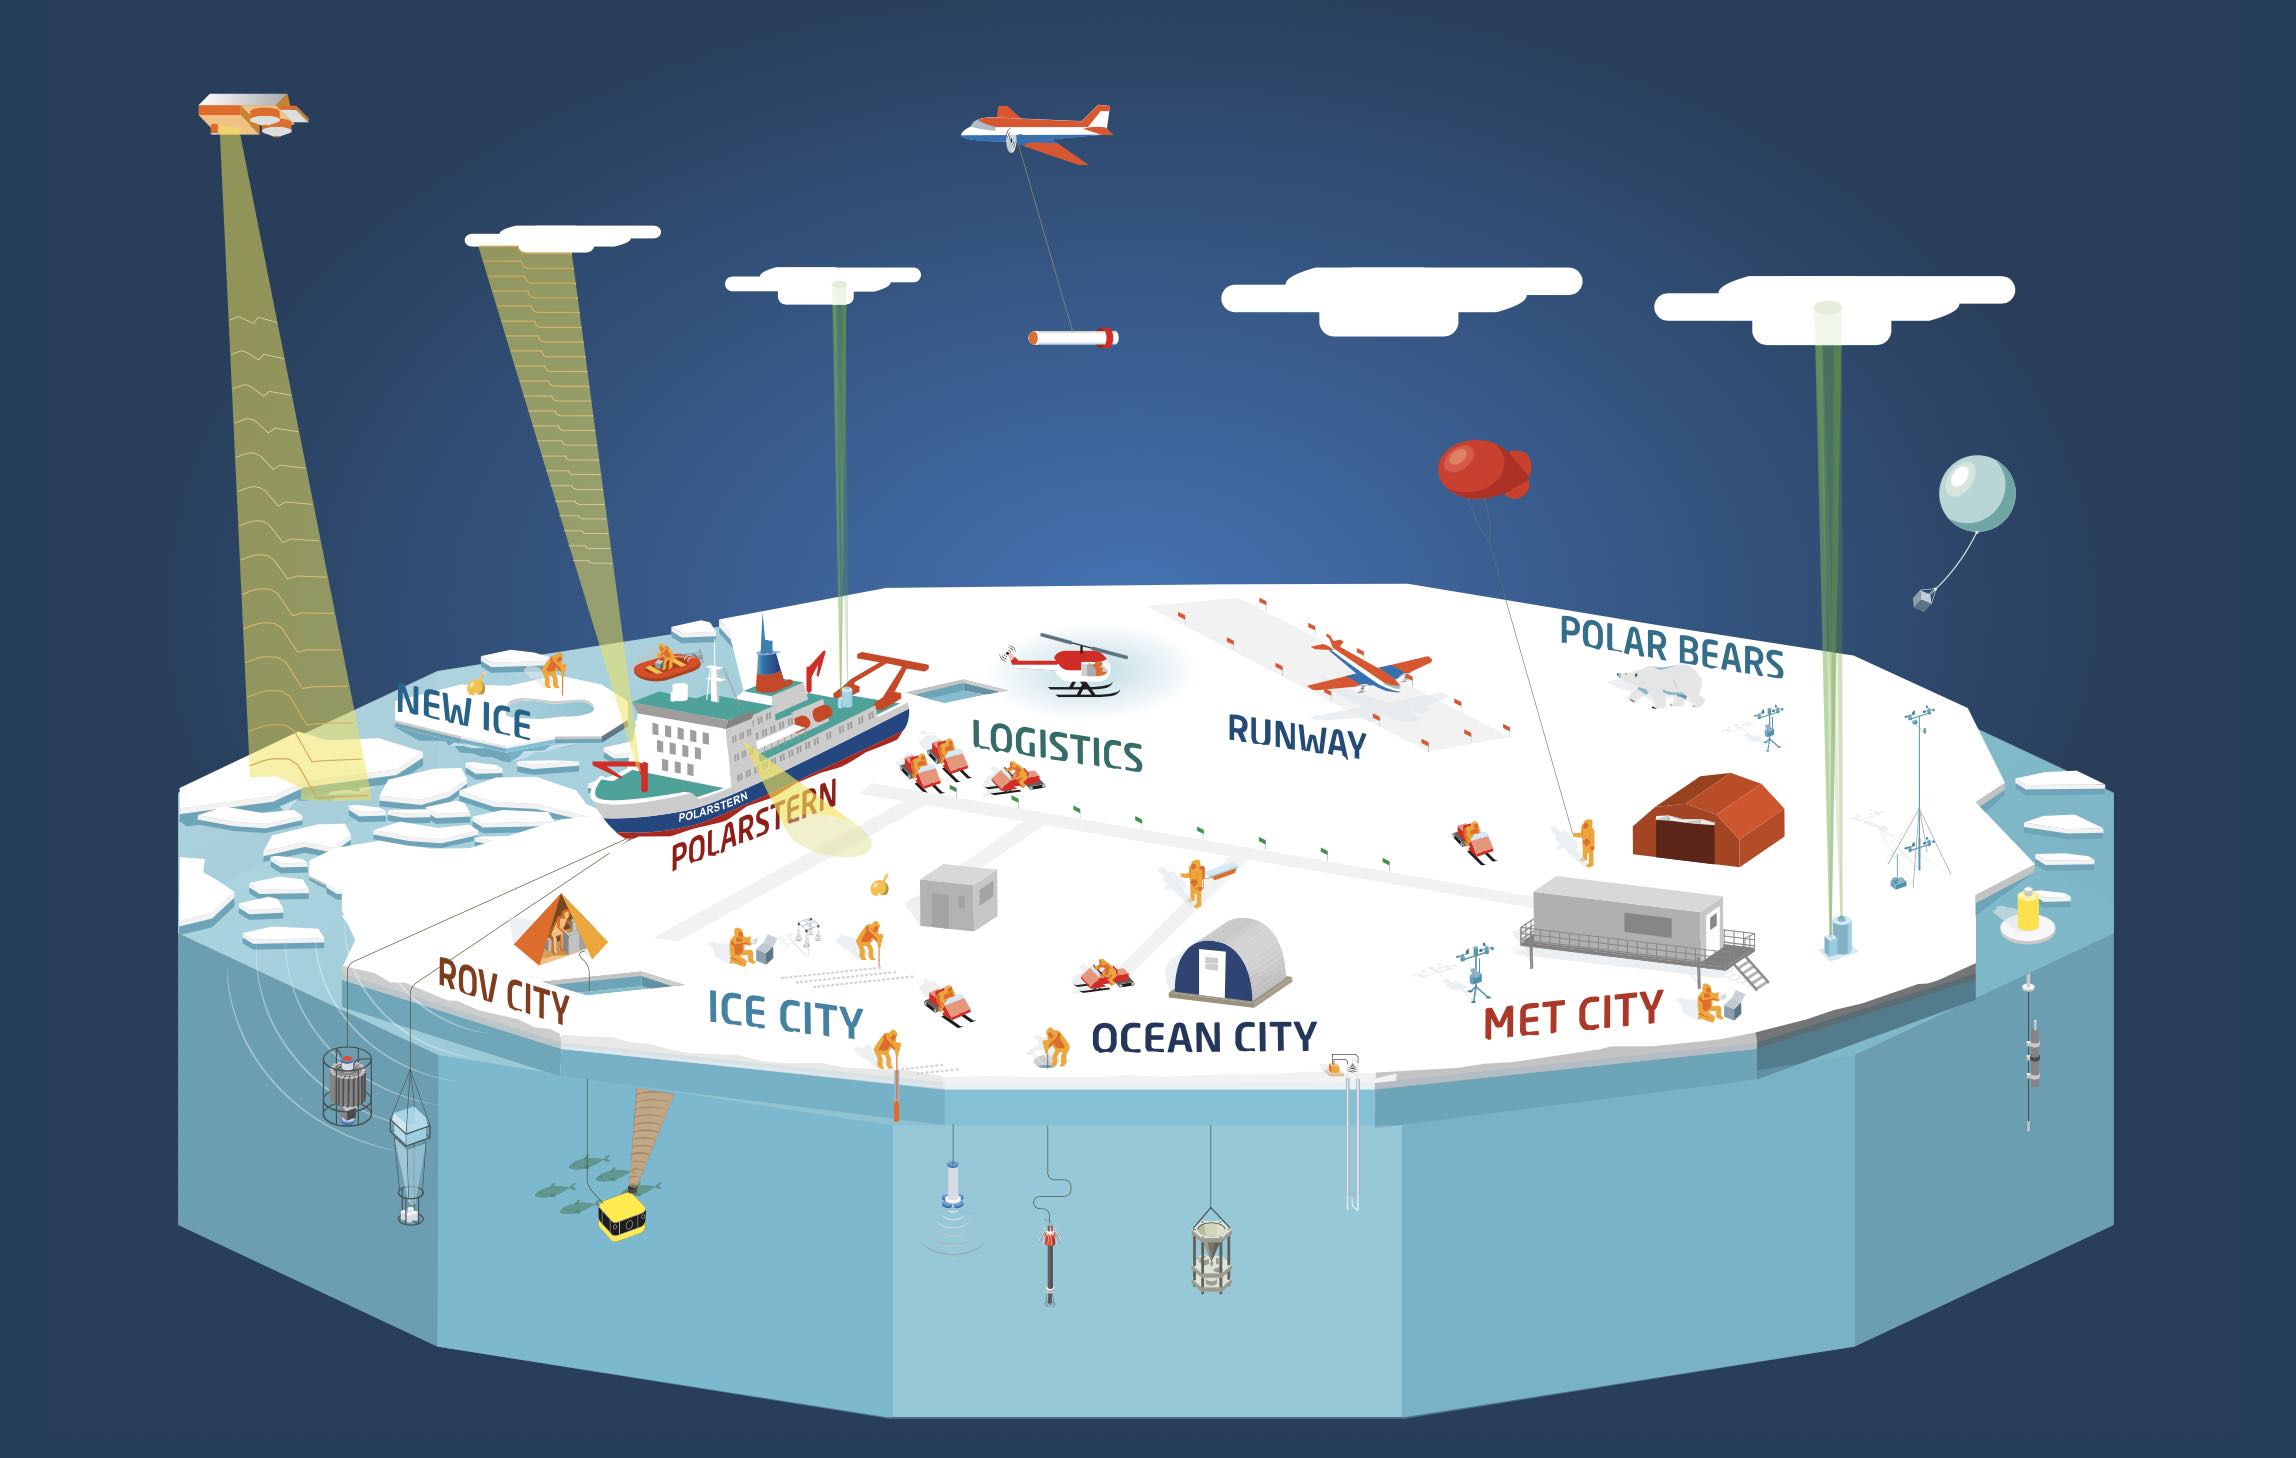
Now that the Polarstern has docked with the ice floe it will become frozen in, scientists are getting to work. But this doesn't just mean taking measurements from the deck of the ship. Rather, an entire scientific community will be erected around the Polarstern, complete with multiple science 'cities' where scientists will keep instruments and collect data, a runway where DC 3 polar aircraft will take off and land, and trip wires for detecting polar bears! In addition to the cities on the ice, drones packed with scientific instruments will fly above the ice to gather information about the atmosphere, and remotely operated vehicles (ROVs) will be deployed beneath the ice to explore the mysterious polar ocean world below. Image credit: AWI
Read more: Science cities
MOSAiC science overview
 #askmosaic: What and Where is the Arctic?
Student submitted question: How do we define the Arctic?
Did you know that there is no consensus on how we define the Arctic region geographically? Depending on what parameter you use (ecosystem boundaries, the Arctic Circle, treeline, etc.), you could come up with at least 6 different delineations of the Arctic!
Provide your students with a map of Definitions of the Arctic from Nordregio. Then, do a ~10-minute Think-Pair-Share in which students analyze the various definitions of the Arctic and discuss how they all compare. Why do you think there is no one way in which we define the Arctic?
Download the Definitions of the Arctic map
![]()
![]()
![]()
![]()
 Quick Bite: Back to the Fram
Two weeks ago we introduced you to the Fram expedition led by Fridtjof Nansen 125 years ago that inspired MOSAiC. This week, learn more about what was known and not known about the Arctic during the time of the Fram and what kinds of scientific observations they made during their three years locked in the ice. Check out the optional activity at the end of the reading where your students can compare the science goals of the Fram and MOSAiC expeditions.
Read about the goals of the Fram expedition
 *New* Track the Polarstern with the MOSAiC Web App
Don't want to wait a week for an update on the Polarstern's location and Arctic conditions? You can track the expedition in real time and from anywhere using the MOSAiC web app! In addition to seeing where the Polarstern is, you can also check on the Arctic temperature and sea ice extent. Want to compare where the Fram expedition was on this day 125 years ago? You can do that too!
MOSAiC Weekly Tracking
Plot the Polarstern
Each week we will provide you with the latitude and longitude coordinates of the Polarstern so that your students can track its journey across the Arctic in your classroom.
Download the map to plot coordinates
Download a larger map of the Arctic for a bigger picture view of the expedition area
Location of the Polarstern
| Date | Latitude | Longitude |
| September 16, 2019 | 69.68 N | 18.99 E |
| September 23, 2019 | 72.31 N | 26.93 E |
| September 30, 2019 | 85.12 N | 138.05 E |
| October 4, 2019** | 85.08 N | 134.43 E |
| October 7, 2019 | 85.10 N | 133.82 E |
| October 14, 2019 | 84.85 N | 135.03 E |
**Day when MOSAiC reached the ice floe that the Polarstern will become frozen in and drift with for the next year.
Log MOSAiC Data
Download a MOSAiC Data Logbook to keep track of Arctic conditions over the course of the expedition
Arctic Data*
| Date | Length of day (hrs) at location of Polarstern | Air temperature (deg C) at location of Polarstern | Arctic Sea Ice Extent (million km2) |
| September 16, 2019 | 13.25 | High: 10 Low: 4.4 | 3.9 |
| September 23, 2019 | 12.35 | High: 6 Low: -1 | 4.1 |
| September 30, 2019 | 9.1 | -4.7 | 4.4 |
| October 4, 2019** | 6.27 | -13.0 | 4.5 |
| October 7, 2019 | 3.05 | -8.2 | 4.6 |
| October 14, 2019 | 0 | -14.7 | 4.8 |
*Note: We expect data to fall within the following ranges: Length of day, 0-24 hours; Temperature, -40 to 14 degrees C; Sea ice extent, 3-15 million km2
**Day when MOSAiC reached the ice floe that the Polarstern will become frozen in and drift with for the next year.
 Follow the Journey
PolarTREC educator Katie Gavenus will be keeping a journal during her time aboard the Russian icebreaker Federov on the first leg of the MOSAiC expedition. Check out her Education Extensions at the end of each journal entry for more Arctic-related classroom activities.
Read Katie's journals
Peruse other expedition blogs
Browse all Arctic and polar-related educational resources
Check out the MOSAiC Monday Archives
 *Update* MOSAiC Monday and the NGSS
Good news for educators in the U.S. teaching with the Next Generation Science Standards (NGSS) or similar! We will now be tagging MOSAiC Monday engagements with the NGSS Disciplinary Core Idea subject(s), Science and Engineering Practice(s), and Crosscutting Concept(s) that they most closely connect to. Look for these symbols listed below each engagement:
Disciplinary Core Idea Subjects
Science and Engineering Practices (adopted from the San Diego County Office of Education Science Resource Center)
Crosscutting Concepts (adopted from the San Diego County Office of Education Science Resource Center)
Is there something you'd like to see in MOSAiC Monday? Let us know!
Send us your feedback