 Note to Educators: Bring MOSAiC into your virtual classroom with Reach the World
We're thrilled to announce that we will be partnering again this fall with our friends at Reach the World and Exploring by the Seat of Your Pants to help you connect your students virtually to MOSAiC team members and crew!
Next featured MOSAiC team member: Dr. Jessie Creamean
Dr. Jessie Creamean is a research scientist at Colorado State University who studies atmospheric aerosols and their impacts on cloud formation and precipitation. Check out the Reach the World MOSAiC program page to read Jessie's article describing who lives in the Polarstern's 'backyard' and how this relates to her interest in atmospheric aerosols. Follow the link below to tune into Jessie's live video call or even sign up for an on-camera spot!
Tune in to Jessie's live video chat on Monday September 14th at 4:00 pm ET
Learn more about Reach the World
Change is in the Air
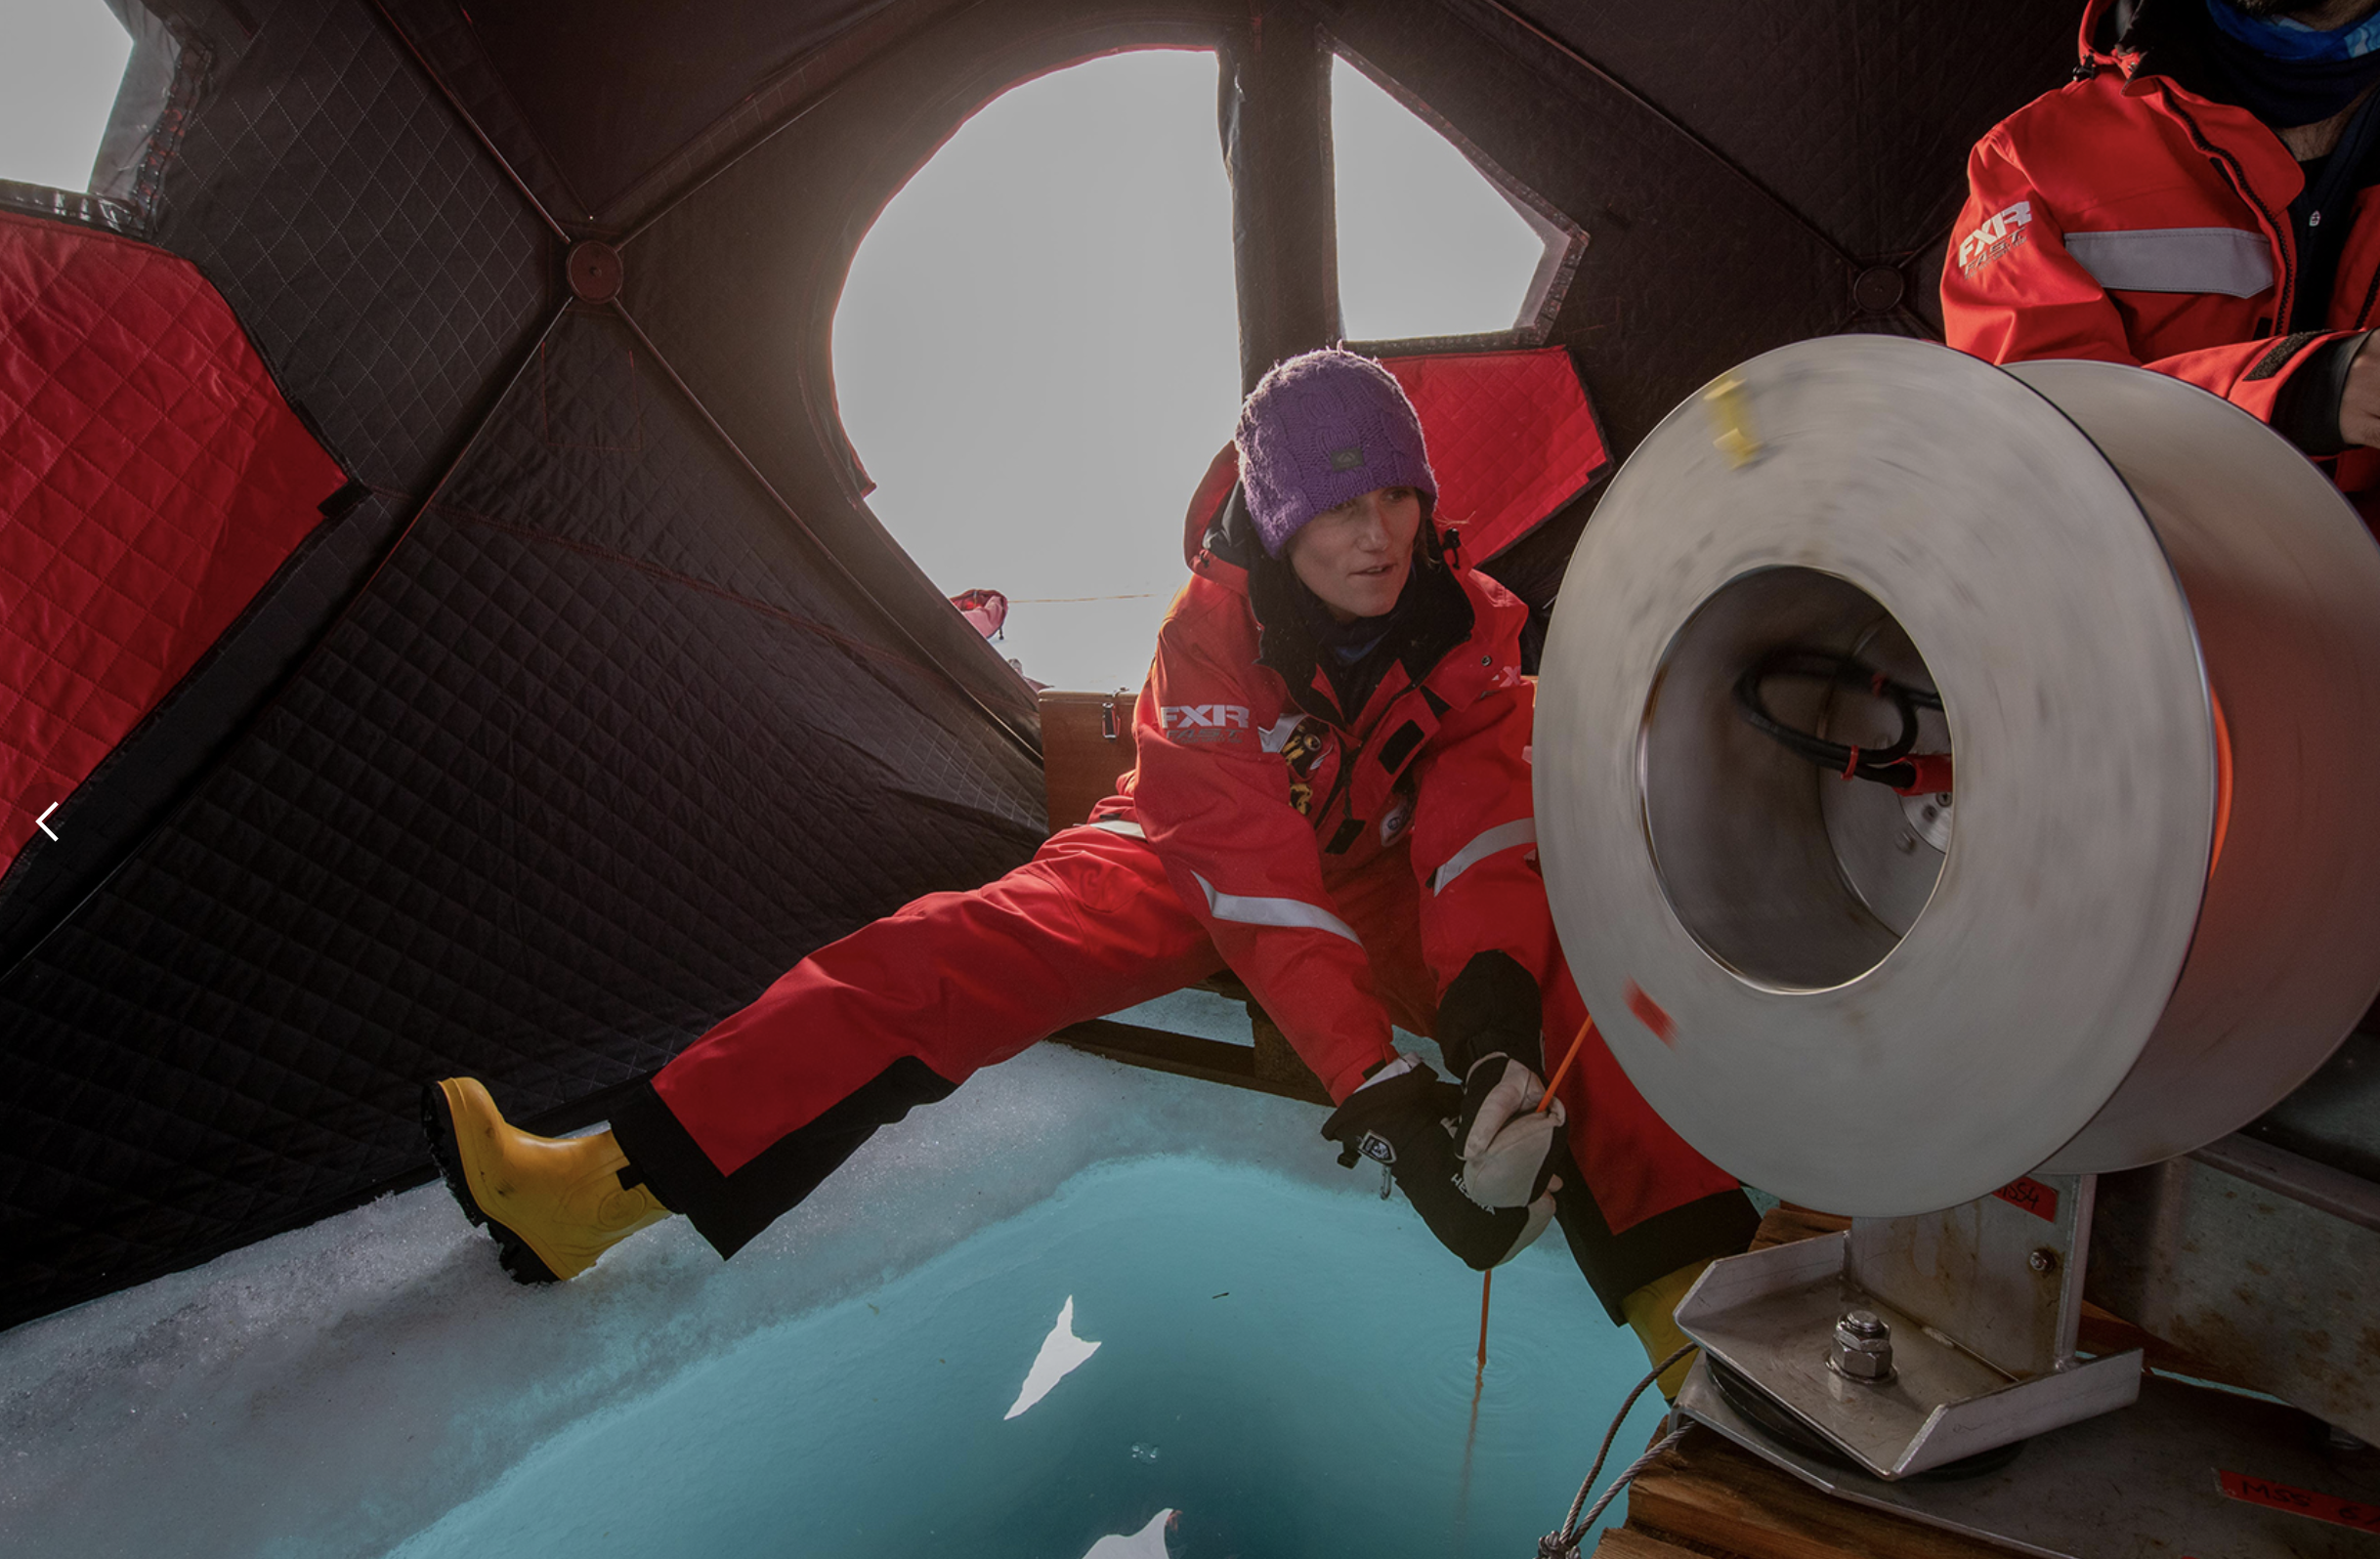
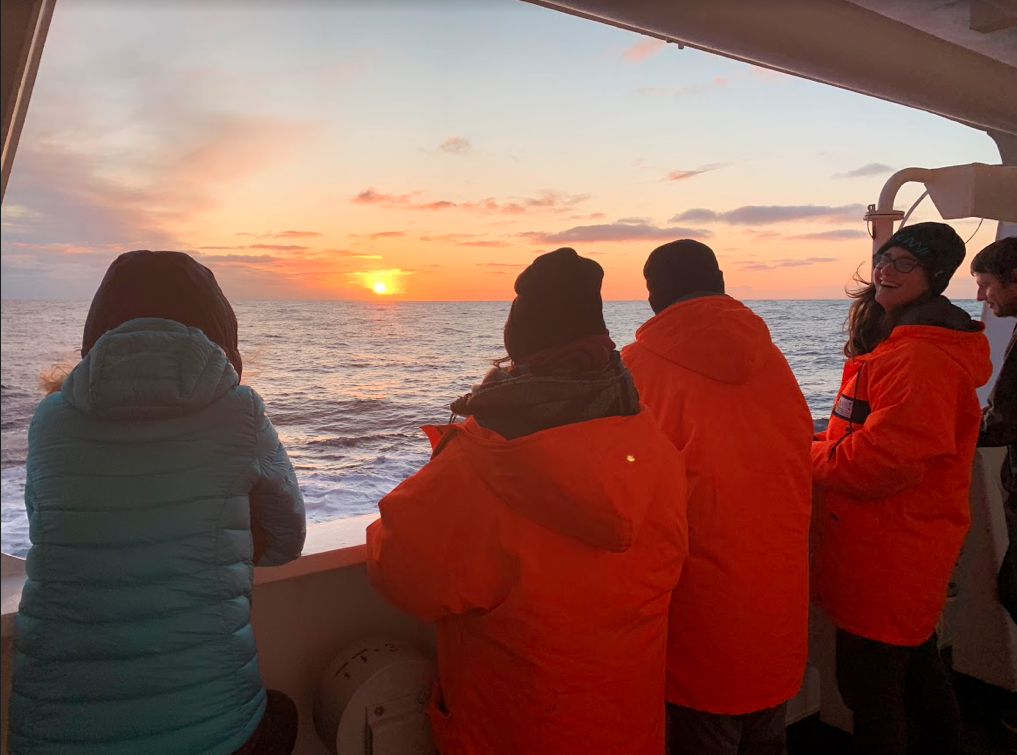
In late March, the sun rose above the Arctic horizon and never set. It has been this way ever since for MOSAiC team members on board the Polarstern, just circling the sky for 24 hours a day. But things are changing—the sun is circling lower in the sky, and temperatures are dropping. Last week a low pressure system passed over the MOSAiC floe, bringing stronger winds and below freezing temperatures. MOSAiC Teams Ocean and Eco took this opportunity to conduct an 'intensive observation' session, taking continuous measurements of the ocean over a 36-hour period to see how this low pressure system would impact the water column.
Photo: MOSAiC team member Zoe Koenig helps lower an instrument through the ice into the water below; Photo credit: Lianna Nixon, CIRES/CU Boulder
NOAA SciJinks: What is a Polar Vortex?
Explore air pressure on the molecular scale with this PhET simulation: Gases Intro
Reason for the Seasons
Different regions around the globe experience seasonality differently. Near the equator there are fairly minimal changes in temperature and daylight throughout the year, while the north and south poles alternate between 24 hours of daylight and 24 hours of sunlight, with temperatures varying between above freezing to well below. What is it like where you live throughout the year? What is the reason for the seasons?
 Daylight to Darkness: Constructing an Explanation
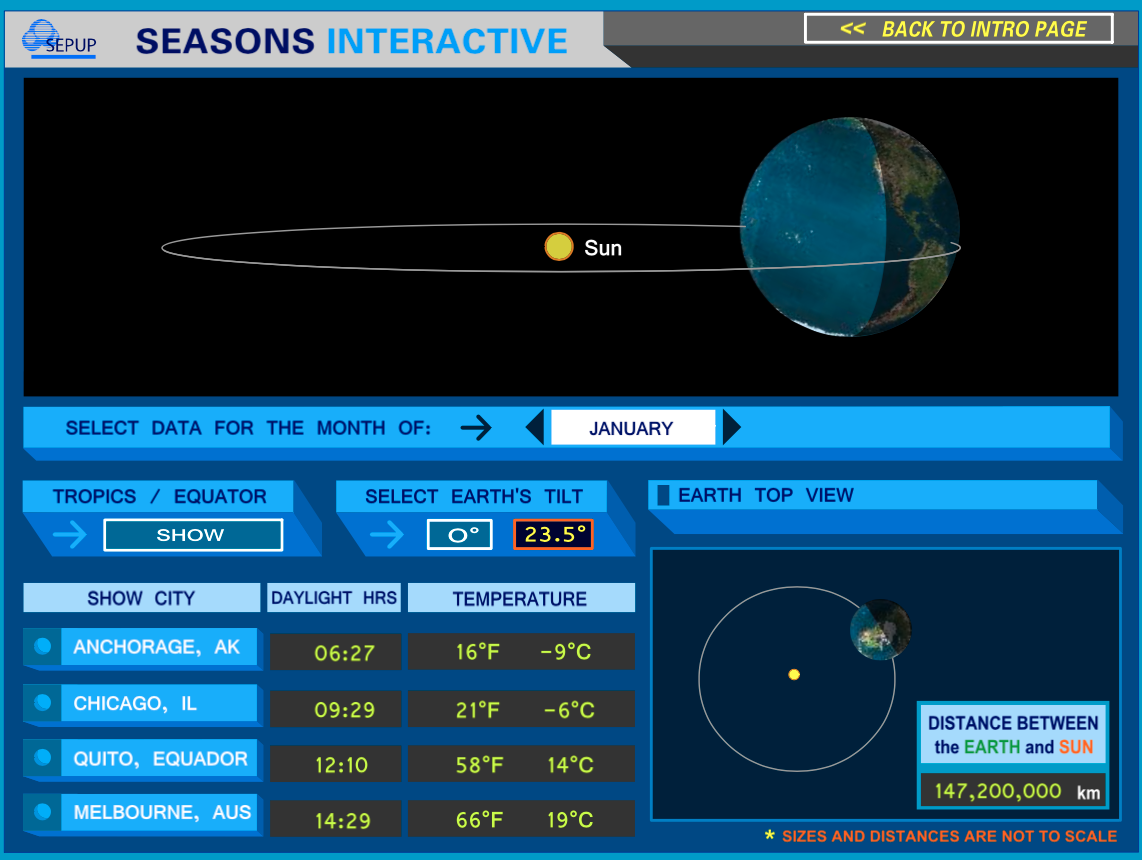
Why does the amount of daylight the Arctic region gets throughout the year vary so much more than regions at lower latitudes? Give students a few minutes to play around with this Seasons Interactive. They can change the month of the year which will in turn change the position of the earth in its orbit around the sun. Remind your students that the sizes and distances in this simulation are not to scale! Encourage students to switch the Earth's tilt back and forth between 0 and 23.5 degrees. What do you notice? Can you use this simulation to construct an explanation for why the amount of daylight the high Arctic region gets throughout the year changes from 24 hours in the summer to 0 hours in the winter?
Seasons Interactive
Video: Land of the Midnight Sun
![]()
![]()
![]()
![]()
Quick Bite: Predicting Polar Night
When will the Arctic fade once again into 24 hours of polar night? In small groups, have students predict what day they think the sun will no longer rise for those on board the Polarstern. Write all predictions on the board. Then, have students use the Day Length Calculator to figure out what day the sun will set and not rise again until next year based on an estimated location of the icebreaker. Photo credit: Anne Gold
How to use the Day Length Calculator
1. Enter in a latitude and longitude location for the Polarstern in the 'Location' box. This will be the predicted approximate location for the Polarstern for whatever date the students chose for when the sun will set--they can use the MOSAiC web app to estimate a location. To keep it simple, you can ignore the time zone.
2. Enter in the predicted day of seasonal 'permanent' sunset in the 'Date' box. Double check the year is correct, and choose whatever time you like.
3. The calculator will automatically do its thing. The 'Apparent Sunrise' and 'Apparent Sunset' boxes will either display the date of the next sunrise/sunset at the location you chose if you guessed too far ahead, or it will show the time of sunrise/sunset on that day if you didn't choose far enough ahead in time. Play around with the calculator until you figure out the date that the sun will no longer rise at the Polarstern. How does it compare to your prediction?
Day Length Calculator
![]()
![]()
Resources for Educators: Linking Your Place to the MOSAiC Expedition
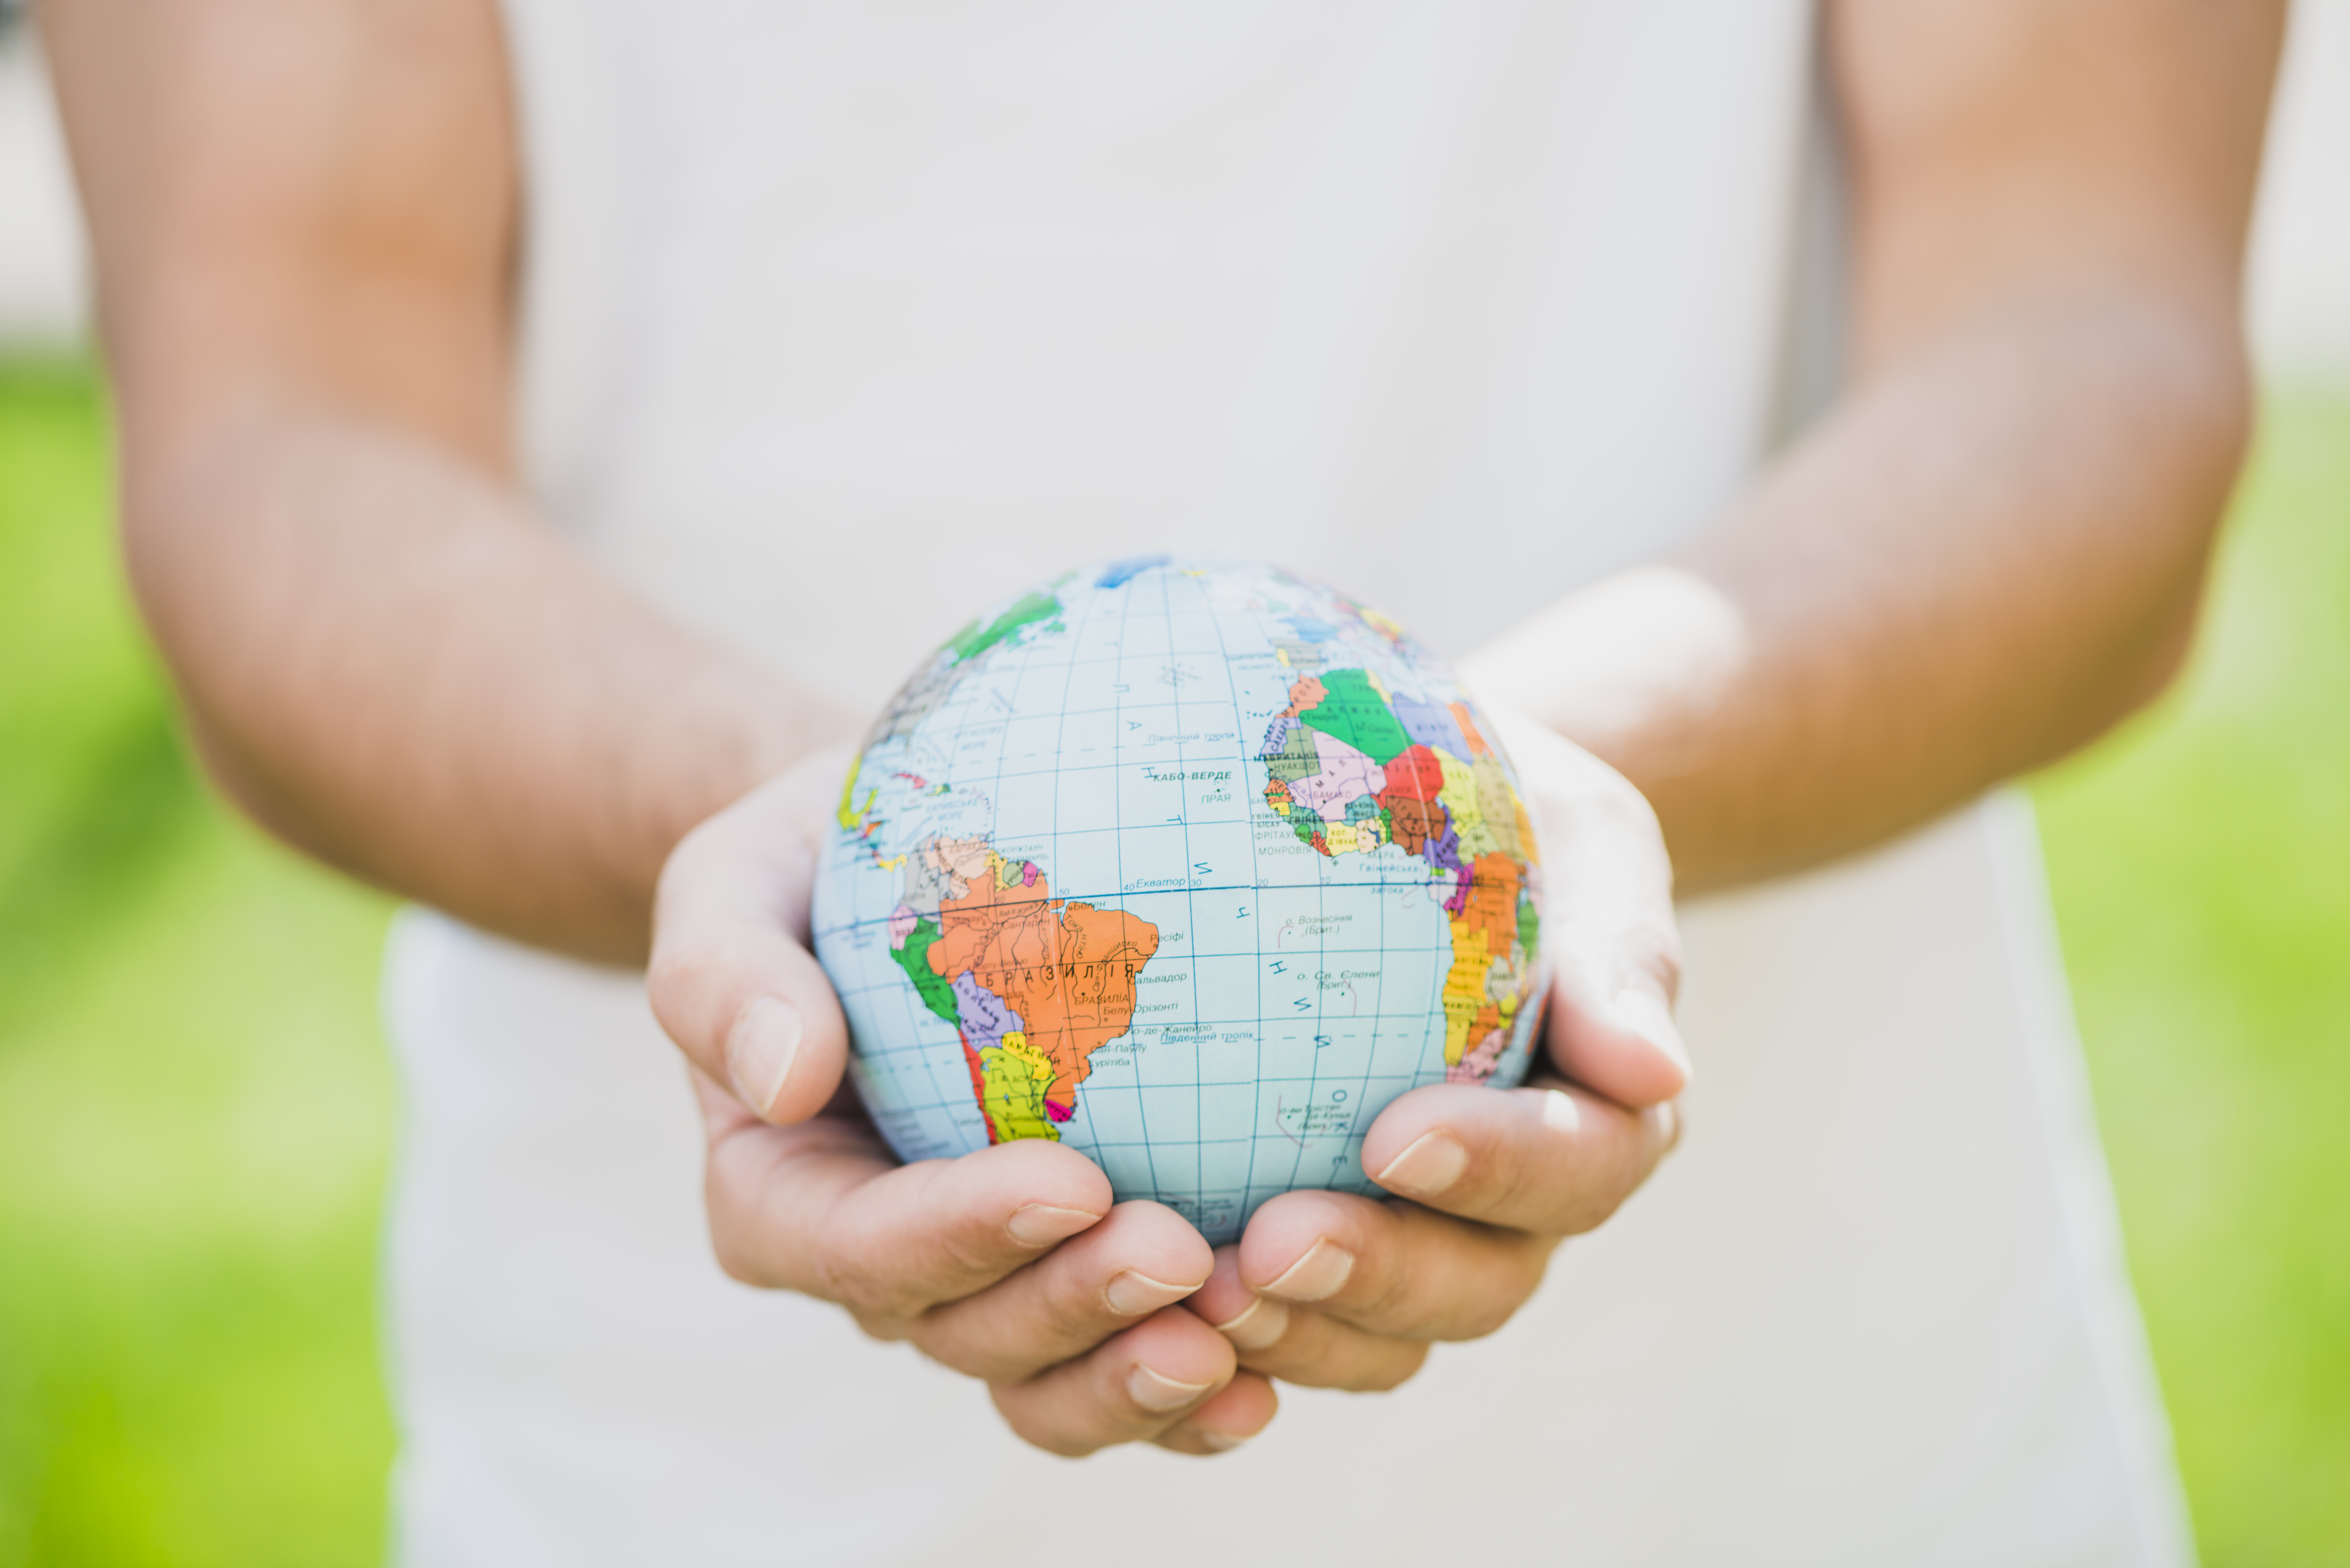
PolarTREC educator Katie Gavenus experienced the shift from polar day to polar night when she was on leg 1 of the MOSAiC expedition almost one year ago. Katie has since put together a series of educational resources for teaching students of all ages about seasonal changes through the equinoxes and solstices. Check them out below! Photo credit: freepik
Arctic Connections: September Equinox Activities
Arctic Connections: December Solstice Edition
Arctic Connections: March Equinox Activities
Arctic Connections: June Solstice Edition
 #askmosaic: Remote but not Alone
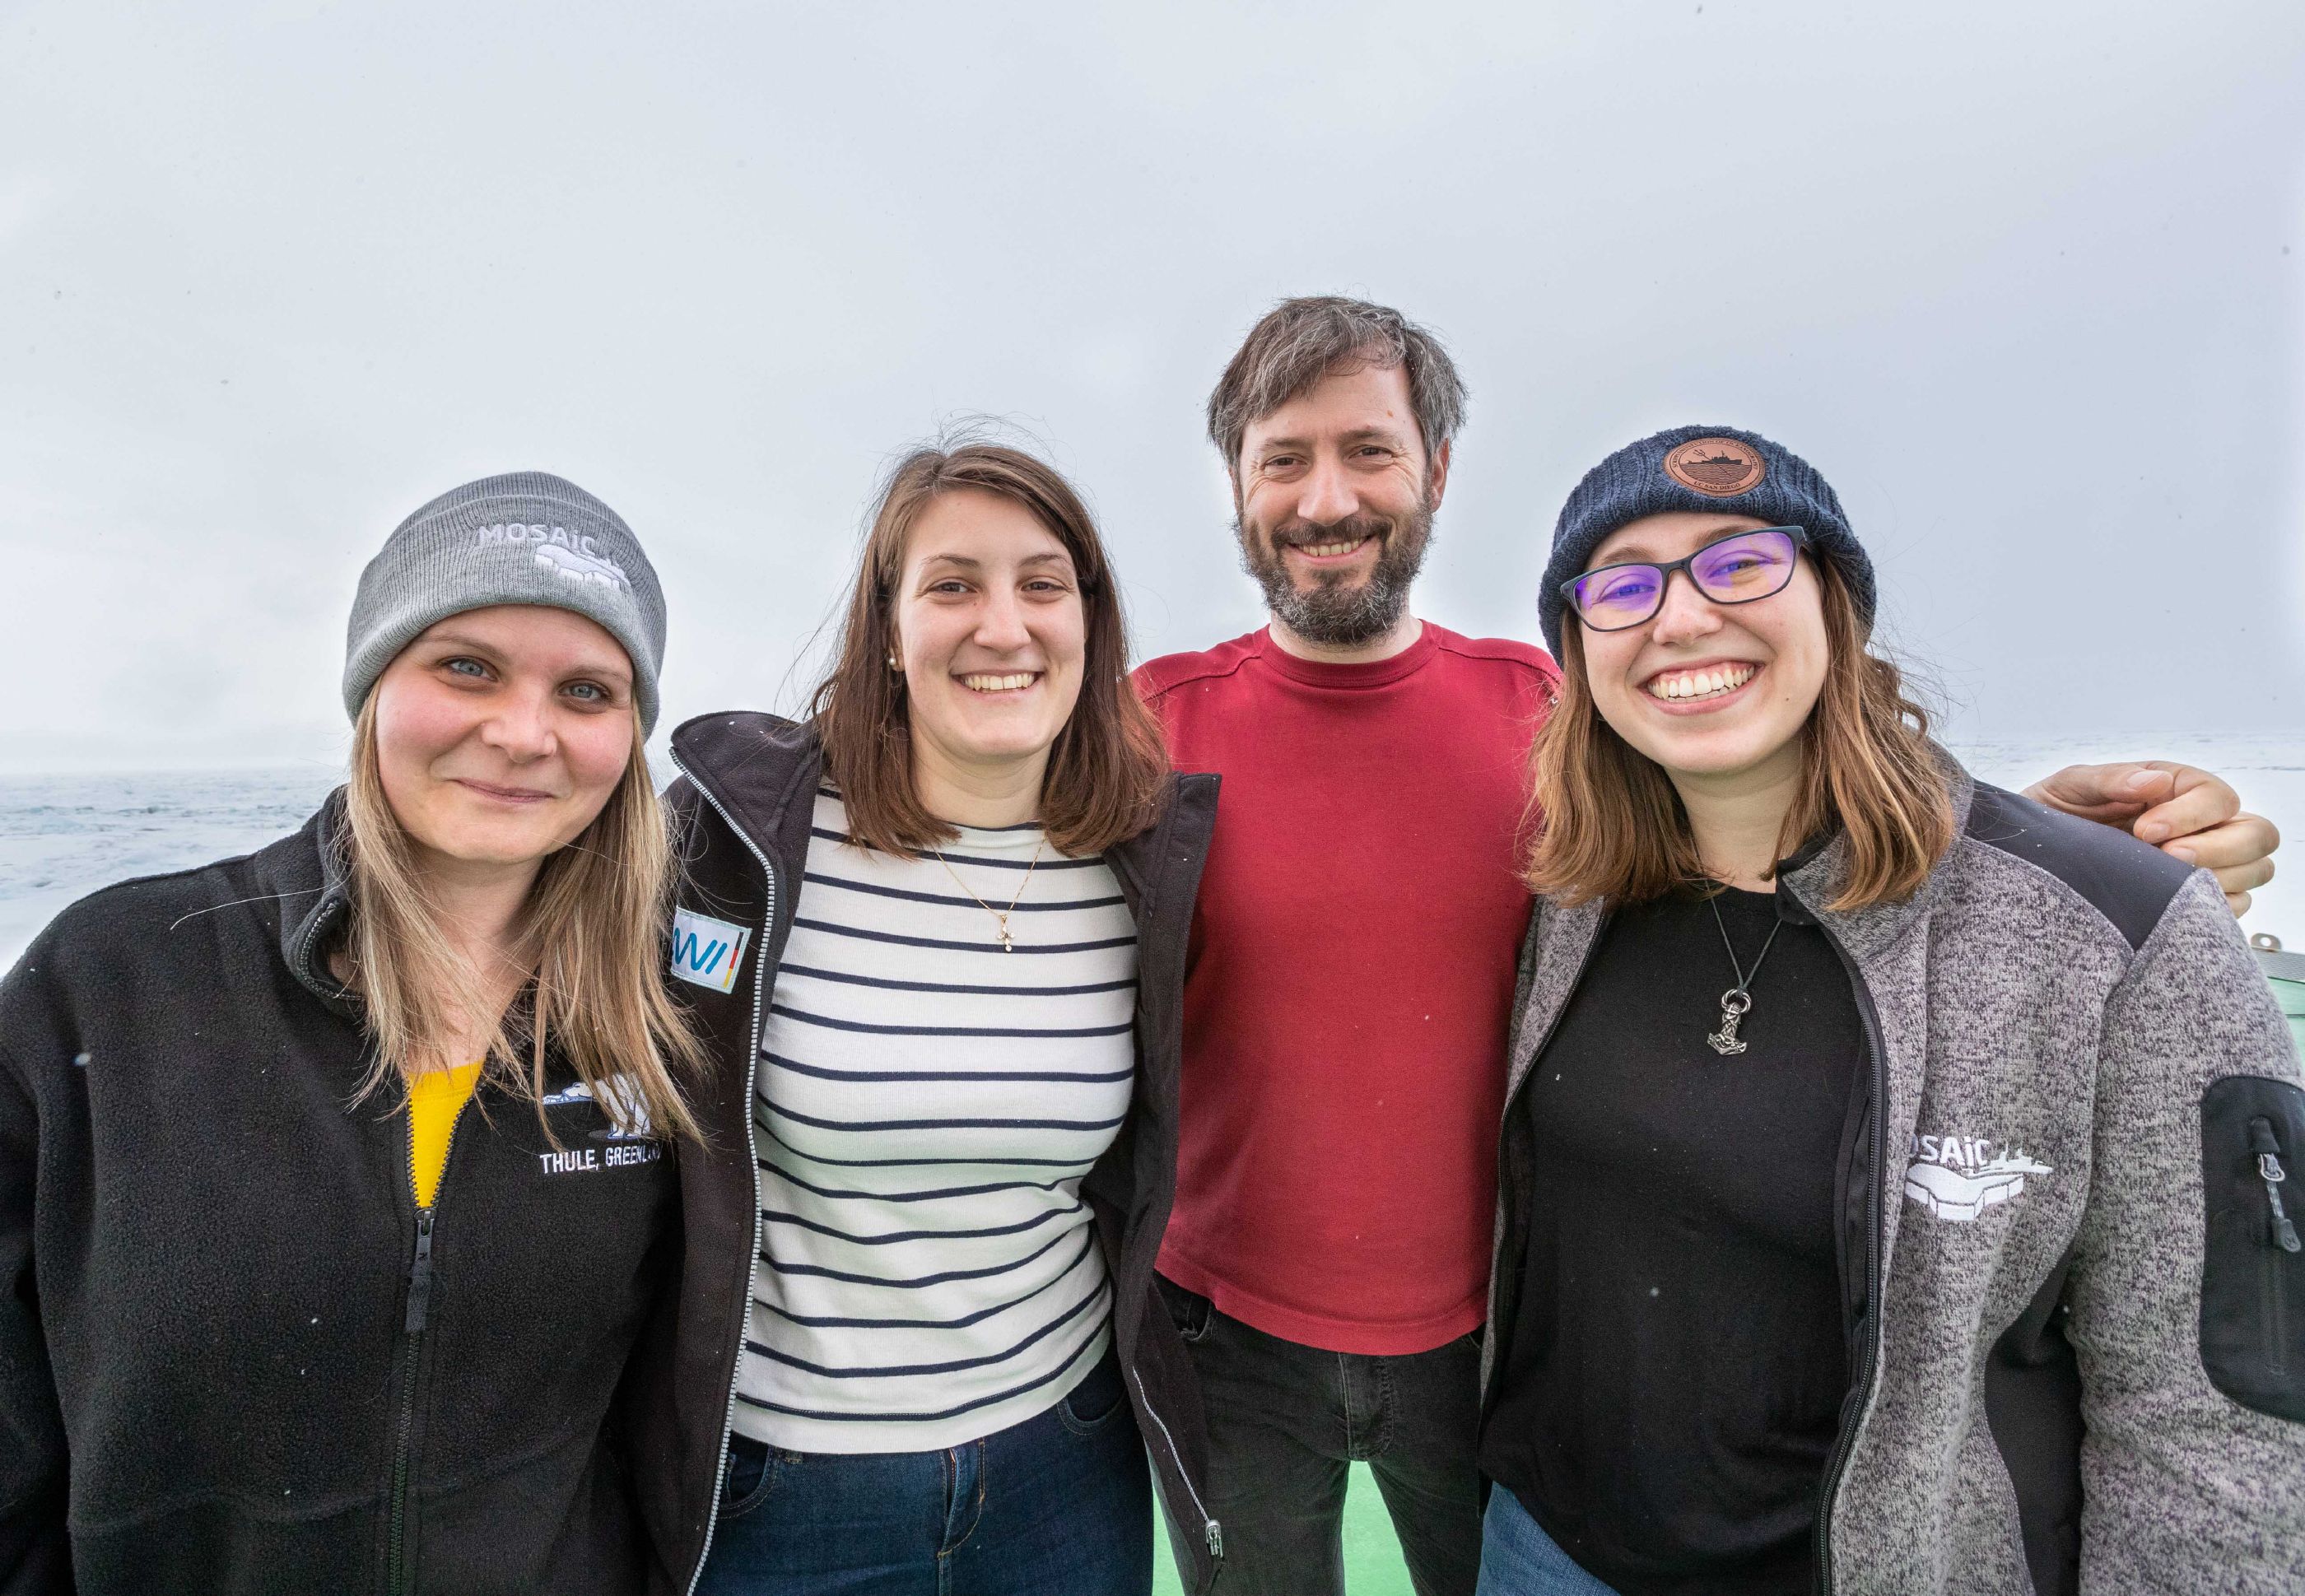
This question was submitted by Ashlyn from Middleton Middle School: Is it scary at all, being out there alone in the Arctic?
"Good question, but surprisingly not really, no. First of all, on a ship, you are never actually alone. You are constantly surrounded by your colleagues and teammates. We take all of our meals together, work in the field together, and almost everyone on board has a roommate. In addition, we are lucky to have an incredible ship's crew and logistics team who work hard to keep us comfortable and safe every day both on and off the ice. Even being far away from the rest of the world, we have each other to lean on, and with that knowledge, I know I don't feel so afraid. Occasionally we do get the chance to leave the primary field camp though and explore/collect samples far away from the ship. In these moments, the Arctic does feel much more wild and dangerous - although mostly it's just nice to get away from the busy ship noise and experience the peace and quiet of the ice."
-Emelia Chamberlain, Scripps Institution of Oceanography, MOSAiC Team ECO and BGC
Photo (left to right): Allesandra D'Angelo, Debby Bozzaato, Falk Patzold, Emelia Chamberlain of Leg 4 Team Biogeochemistry; Photo credit: Lianna Nixon, CIRES/CU Boulder
Curious about the Arctic and MOSAiC expedition? Here are three ways you can send us your #askmosaic questions:
1. Submit them
2. Email them: mosaic@colorado.edu with subject line "#askmosaic"
3. Tag us on social media: #askmosaic
 MOSAiC Weekly Tracking
Plot the Polarstern
Each week we will provide you with the latitude and longitude coordinates of the Polarstern so that you can track its journey across the Arctic.
Download the map to plot coordinates
Download a larger map of the Arctic for a bigger picture view of the expedition area
Location of the Polarstern
| Date | Latitude | Longitude |
| September 16, 2019 | 69.68 N | 18.99 E |
| September 23, 2019 | 72.31 N | 26.93 E |
| September 30, 2019 | 85.12 N | 138.05 E |
| October 4, 2019** | 85.08 N | 134.43 E |
| October 7, 2019 | 85.10 N | 133.82 E |
| October 14, 2019 | 84.85 N | 135.03 E |
| October 21, 2019 | 84.97 N | 132.73 E |
| October 28, 2019 | 85.47 N | 127.07 E |
| November 4, 2019 | 85.88 N | 121.70 E |
| November 11, 2019 | 85.82 N | 116.00 E |
| November 18, 2019 | 86.05 N | 122.43 E |
| November 25, 2019 | 85.85 N | 121.35 E |
| December 2, 2019 | 85.97 N | 112.95 E |
| December 9, 2019 | 86.25 N | 121.40 E |
| December 16, 2019 | 86.62 N | 118.12 E |
| December 23, 2019 | 86.63 N | 113.20 E |
| December 30, 2019 | 86.58 N | 117.13 E |
| January 6, 2020 | 87.10 N | 115.10 E |
| January 13, 2020 | 87.35 N | 106.63 E |
| January 20, 2020 | 87.42 N | 97.77 E |
| January 27, 2020 | 87.43 N | 95.82 E |
| February 3, 2020 | 87.42 N | 93.65 E |
| February 10, 2020 | 87.78 N | 91.52 E |
| February 17, 2020 | 88.07 N | 78.52 E |
| February 24, 2020 | 88.58 N | 52.87 E |
| March 2, 2020 | 88.17 N | 31.02 E |
| March 9, 2020 | 87.93 N | 24.20 E |
| March 16, 2020 | 86.87 N | 12.70 E |
| March 23, 2020 | 86.20 N | 15.78 E |
| March 30, 2020 | 85.37 N | 13.27 E |
| April 6, 2020 | 84.52 N | 14.38 E |
| April 13, 2020 | 84.28 N | 14.97 E |
| April 20, 2020 | 84.52 N | 14.57 E |
| April 27, 2020 | 83.93 N | 15.65 E |
| May 4, 2020 | 83.92 N | 18.03 E |
| May 11, 2020 | 83.47 N | 13.08 E |
| May 18+, 2020 | 83.32 N | 8.68 E |
| May 25+, 2020 | 82.43 N | 8.28 E |
| June 1+, 2020 | 81.33 N | 9.93 E |
| June 8+, 2020 | 78.10 N | 12.73 E |
| June 15+, 2020 | 82.20 N | 8.18 E |
| June 22, 2020 | 81.95 N | 9.27 E |
| June 29, 2020 | 82.03 N | 9.88 E |
| July 6, 2020 | 81.67 N | 5.22 E |
| July 13, 2020 | 81.40 N | 0.28 E |
| July 20, 2020 | 80.78 N | 0.42 W |
| July 27, 2020 | 79.55 N | 2.37 W |
| August 3, 2020 | 78.60 N | 4.37 W |
| August 10, 2020 | 79.90 N | 5.52 W |
| August 17+, 2020 | 88.28 N | 34.63 W |
| August 24, 2020 | 87.77 N | 105.67 E |
| August 31, 2020 | 88.30 N | 114.23 E |
| September 7, 2020 | 88.68 N | 111.57 E |
| September 14, 2020 | 89.03 N | 103.10 E |
**Day when MOSAiC reached the ice floe that the Polarstern will become frozen in and drift with for the next year.
+ Indicates when the Polarstern traveled under its own engine power (no drifting)
Log MOSAiC Data
Keep track of Arctic conditions over the course of the expedition:
**Note to students: If you are trying to access these documents in Google Drive and are unable to, it is likely because your school has blocked access. Try using a personal account to access them, or contact your teacher.
Download Data Logbook for Sept. 2019 - Dec. 2019
Download Data Logbook for Dec. 2019 - Mar. 2020
Download Data Logbook for Mar. 2020 - June 2020
Download Data Logbook for July 2020 - Oct. 2020
| Date | Length of day (hrs) | Air temperature (deg C) at location of Polarstern | Arctic Sea Ice Extent (million km2) |
| September 16, 2019 | 13.25 | High: 10 Low: 4.4 | 3.9 |
| September 23, 2019 | 12.35 | High: 6 Low: -1 | 4.1 |
| September 30, 2019 | 9.1 | -4.7 | 4.4 |
| October 4, 2019** | 6.27 | -13.0 | 4.5 |
| October 7, 2019 | 3.05 | -8.2 | 4.6 |
| October 14, 2019 | 0 | -14.7 | 4.8 |
| October 21, 2019 | 0 | -12.8 | 5.4 |
| October 28, 2019 | 0 | -18.3 | 6.8 |
| November 4, 2019 | 0 | -18.9 | 8.0 |
| November 11, 2019 | 0 | -25.5 | 8.7 |
| November 18, 2019 | 0 | -10.7 | 9.3 |
| November 25, 2019 | 0 | -18.4 | 10.0 |
| December 2, 2019 | 0 | -26.6 | 10.4 |
| December 9, 2019 | 0 | -23.1 | 11.2 |
| December 16, 2019 | 0 | -19.2 | 11.8 |
| December 23, 2019 | 0 | -26.9 | 12.2 |
| December 30, 2019 | 0 | -26.4 | 12.6 |
| January 6, 2020 | 0 | -28.0 | 13.0 |
| January 13, 2020 | 0 | -30.7 | 13.1 |
| January 20, 2020 | 0 | -27.1 | 13.6 |
| January 27, 2020 | 0 | -22.5 | 13.8 |
| February 3, 2020 | 0 | -28.8 | 14.1 |
| February 10, 2020 | 0 | -26.2 | 14.5 |
| February 17, 2020 | 0 | -31.9 | 14.4 |
| February 24, 2020 | 0 | -24.0 | 14.6 |
| March 2, 2020 | 0 | -35.5 | 14.8 |
| March 9, 2020 | 0 | -37.9 | 14.7 |
| March 16, 2020 | 10.5 | -27.5 | 14.7 |
| March 23, 2020 | 16.5 | -28.7 | 14.4 |
| March 30, 2020 | 24 | -28.6 | 14.0 |
| April 6, 2020 | 24 | -18.2 | 13.7 |
| April 13, 2020 | 24 | -25.8 | 13.6 |
| April 20, 2020 | 24 | -10.2 | 13.3 |
| April 27, 2020 | 24 | -11.7 | 12.8 |
| May 4, 2020 | 24 | -16.2 | 12.8 |
| May 11, 2020 | 24 | -10.4 | 12.4 |
| May 18, 2020 | 24 | -5.1 | 11.7 |
| May 25, 2020 | 24 | 0.4 | 11.5 |
| June 1, 2020 | 24 | 0.0 | 11.1 |
| June 8+, 2020 | 24 | -0.1 | 10.6 |
| June 15+, 2020 | 24 | -0.4 | 10.1 |
| June 22, 2020 | 24 | -0.4 | 9.6 |
| June 29, 2020 | 24 | 0.5 | 9.2 |
| July 6, 2020 | 24 | 0.6 | 8.2 |
| July 13, 2020 | 24 | 0.2 | 7.2 |
| July 20, 2020 | 24 | -0.1 | 6.2 |
| July 27, 2020 | 24 | 1.9 | 5.8 |
| August 3, 2020 | 24 | 1.2 | 5.5 |
| August 10, 2020 | 24 | 0.9 | 5.1 |
| August 17, 2020 | 24 | 0.7 | 4.6 |
| August 24, 2020 | 24 | -0.9 | 3.9 |
| August 31, 2020 | 24 | -0.9 | 3.7 |
| September 7, 2020 | 24 | -5.9 | 3.4 |
| September 14, 2020 | 24 | -0.5 | 3.8 |
*Note: We expect data to fall within the following ranges: Length of day, 0-24 hours; Temperature, -40 to 14 degrees C; Sea ice extent, 3-15 million km2
**Day when MOSAiC reached the ice floe that the Polarstern will become frozen in and drift with for the next year.
Opportunities for Students and Educators
CIRES/NOAA Science at Home Webinar Series
Join us every Tuesday at 1:00 pm from now through December for the CIRES/NOAA Science at Home webinar series! Each webinar features a 10-15 minute presentation by a scientist about how they got into science and what they do as a scientist, followed by 10-15 minutes of live Q&A.
Here is the line-up of September speakers:
September 15th - Dr. Michael Koontz will present on: Understanding where wildfires and insects kill trees using drones and satellites
September 22nd - Dr. Joshua “Shuka” Schwarz will present: Fires! Smoke! Airplanes! Action! How we're learning about wildfires and crop burning smoke
September 29th – PhD Candidate Mel Zhang will present on: Seismology: What it is and how I got into it
See the full speaker line-up on the Science at Home website
Register to receive weekly Science at Home email reminders
MOSAiC Weekly Webinar Series
Teachers, join us every Wednesday (3:30 - 4:00 pm MT) during the month of September for short (30 minute) webinars to learn more about MOSAiC virtual educational resources and how you can integrate them into your teaching. How can you introduce your students to the MOSAiC expedition with videos and ArcGIS Storymaps? How do you sign your students up for MOSAiC scientist classroom calls? How do students track the expedition? How can students submit questions directly to the scientists? All of these questions and more will be answered during these weekly webinars! Register for each webinar by clicking on the events below. Please contact jonathan.griffith@
Events:
Week 3 (9/16, 3:30-4:00 pm MT): Teaching with MOSAiC Media (videos, images, podcasts, and more!)
Week 4 (9/23, 3:30-4:00 pm MT): “Exploring the New and Old Arctic” curriculum (MS/HS unit)
Week 5 (9/30, 3:30-4:00 pm MT): “Arctic Feedbacks” curriculum (MS/HS unit)
 MOSAiC Monday and the NGSS
What do those funny symbols below some engagements mean?
Good news for educators in the U.S. teaching with the Next Generation Science Standards (NGSS) or similar! We will now be tagging MOSAiC Monday engagements with the NGSS Disciplinary Core Idea subject(s), Science and Engineering Practice(s), and Crosscutting Concept(s) that they most closely connect to. Look for these symbols listed below each engagement:
Disciplinary Core Idea Subjects
Science and Engineering Practices (adopted from the San Diego County Office of Education Science Resource Center)
Crosscutting Concepts (adopted from the San Diego County Office of Education Science Resource Center)
Is there something you'd like to see in MOSAiC Monday? Let us know!
Send us your feedback
New to MOSAiC Monday? Check out past editions!
Browse more expedition-related educational resources, videos, and blogs
Email us! mosaic@colorado.edu
- Time to celebrate: MOSAiC begin exactly one year ago!
- Check in with the Polarstern