Ways to Learn More About CIRES and MOSAiC Science
 Tune in weekly from now through December for the CIRES/NOAA Science at Home Webinar Series!
Join us every Tuesday at 1:00 pm from now through December for the CIRES/NOAA Science at Home webinar series! Each webinar features a 10-15 minute presentation by a scientist about how they got into science and what they do as a scientist, followed by 10-15 minutes of live Q&A.
Here is the line-up of the remaining September speakers:
September 22nd - Dr. Joshua “Shuka” Schwarz will present: Fires! Smoke! Airplanes! Action! How we're learning about wildfires and crop burning smoke
September 29th – PhD Candidate Mel Zhang will present on: Seismology: What it is and how I got into it
See the full speaker line-up on the Science at Home website
Register to receive weekly Science at Home email reminders
 Connect with MOSAiC scientists with Reach the World
Join us as we partner again this fall with our friends at Reach the World and Exploring by the Seat of Your Pants to help you connect your students virtually to MOSAiC team members and crew!
This week's featured MOSAiC team member: Dr. Jessie Creamean
Dr. Jessie Creamean is a research scientist at Colorado State University who studies atmospheric aerosols and their impacts on cloud formation and precipitation. Check out the Reach the World MOSAiC program page to read Jessie's field notes describing who lives in the Polarstern's 'backyard' and how this relates to her interest in atmospheric aerosols. Did you miss Jessie's live video call last week? Not to worry! You can watch a recording of the call on both the Reach the World MOSAiC program page, or on Exploring by the Seat of Your Pants' YouTube channel.
Learn more about Reach the World
Learn more about Exploring by the Seat of Your Pants
 MOSAiC Weekly Webinar Series for Educators
Teachers, join us every Wednesday (3:30 - 4:00 pm MT) during the month of September for short (30 minute) webinars to learn more about MOSAiC virtual educational resources and how you can integrate them into your teaching. Register for each webinar by clicking on the events below. Please contact jonathan.griffith@
Events:
Week 4 (9/23, 3:30-4:00 pm MT): “Exploring the New and Old Arctic” curriculum (MS/HS unit)
Week 5 (9/30, 3:30-4:00 pm MT): “Arctic Feedbacks” curriculum (MS/HS unit)
 Celebrating 1 Year Since Launch!
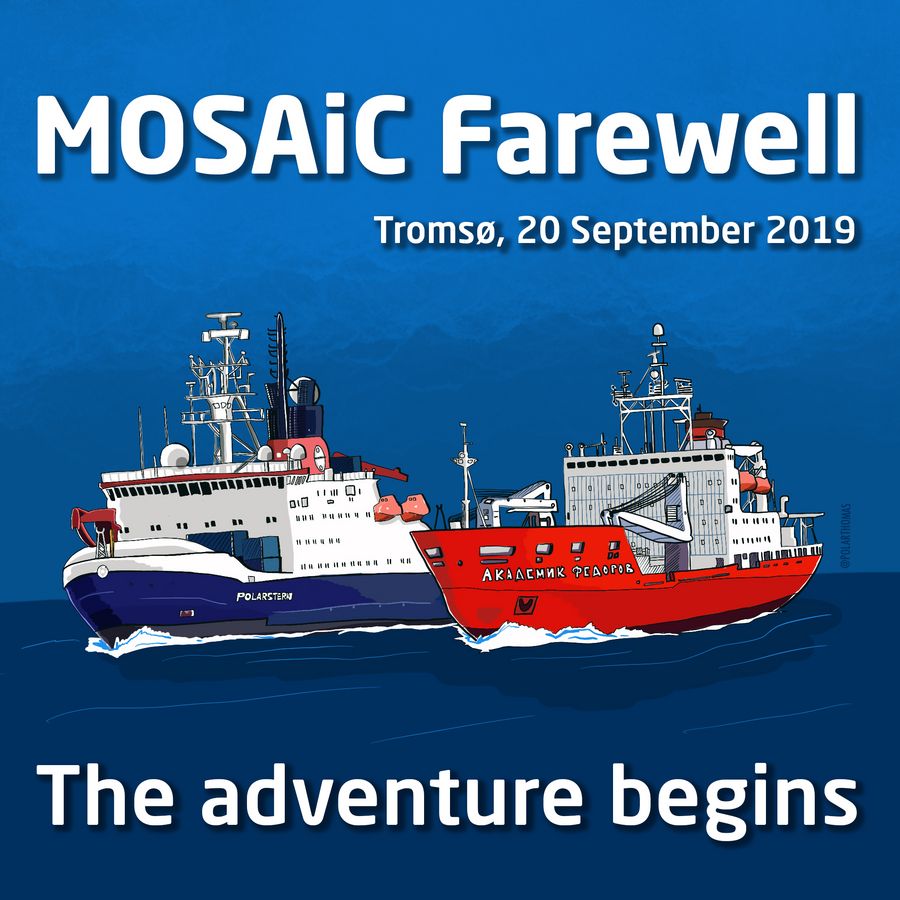
Almost exactly one year ago today, the Polarstern set sail from Tromsø, Norway and headed for the central Arctic to officially begin the 2019-2020 MOSAiC expedition! Close on its heels was the Russian research vessel Akademik Fedorov, which would set up the distributed network of autonomous instruments in a wide radius around the MOSAiC central observatory (Polarstern + research camps) before heading back to port.
A lot has happened over this past year. The Polarstern has traveled over 10,600 km (>6600 mi), which is the equivalent of sailing once around the Moon (if it were covered in an ocean). The ship successfully drifted with the transpolar current across the Arctic, seeing its original ice floe through until the end when it broke apart, and then sailing to the North Pole before finding a new ice floe. MOSAiC scientists conducted research on the ice in frigid temperatures in 24 hours of darkness, and in 24 hours of daylight. They endured gale-force winds and storms that buried power cables in ice ridges and toppled instruments. They were visited by several polar bears and even a mischievous little snow white Arctic fox!
Look back in time at the MOSAiC expedition's adventures
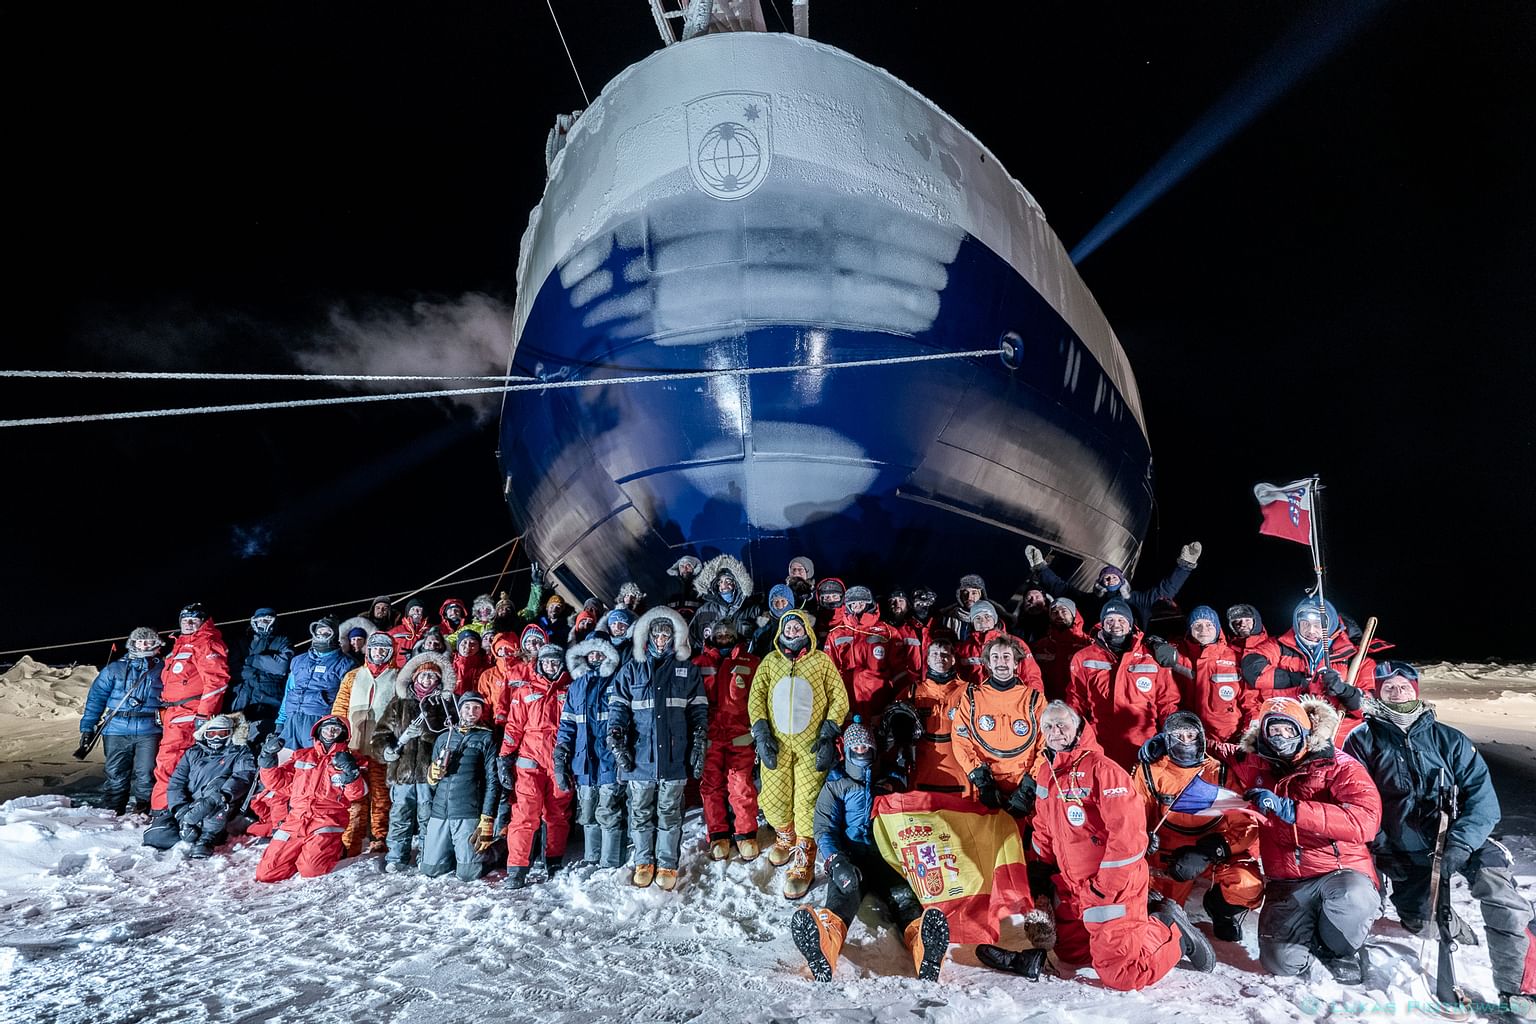
Hundreds of people have participated in the expedition, both on board the ship and remotely from afar, all contributing to the expedition's goal of working to better understand the Arctic climate system. The Polarstern will soon detach itself from floe #2 and begin its journey back to port. But although this will be the end of the field portion of MOSAiC, it won't truly be the end of the expedition. For years to come, scientists will analyze the data collected during the past year, building a more complete picture of seasonal and climatic processes in the Arctic, and how the Arctic Ocean, sea ice, atmosphere, and ecosystems are connected. They will use these data and understandings to improve climate model representations of the Arctic, and to make more accurate projections of its future state. And as the MOSAiC team members return to their various countries and lives, the Polarstern will set sail on its next adventure, likely somewhere cold and remote.
Image credit (top L): Thomas Rackow/AWI
Photo (bottom R): Leg II participants; Photo credit: Lukas Pietrowski
 Send Us Your Arctic Artwork!
Do you have a favorite moment from the MOSAiC expedition? Sketch it, sculpt it, or write a poem about it and submit your creative work to be showcased in the Museum of MOSAiC Art!
Virtually browse the MoMOA galleries
 What's Afloat? Exploring MOSAiC Buoy Data
Last October, researchers on the MOSAiC expedition deployed three SIMB buoys through the frigid Arctic sea ice. SIMB stands for Seasonal Ice Mass Balance, and the SIMB buoys have been collecting data like air pressure, air temperature, ice thickness, and more over the past year. Like the Polarstern, the SIMB buoys have been drifting along with the sea ice.
Buoys in the ocean come in all different shapes, sizes, and kinds. Most float on top of or within the water and either drift with the currents or are anchored in one place. Different buoys are equipped with different kinds of instruments to measure different things.
How do you deploy a buoy in the Arctic?
One MOSAiC researcher filmed herself and her colleagues deploying a MOSAiC SIMB buoy in the sea ice so that you can see the entire process firsthand from start to finish! Video produced by Ph.D. student and MOSAiC School participant Ryleigh Moore.
MOSAiC Expedition: SIMB3 Buoy Installation Video by Ryleigh Moore from APECS Webinars on Vimeo.
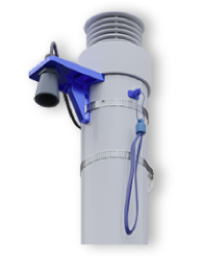
 Buoy Structure and Function
Have your students watch the video above and look at a picture and diagram of a SIMB buoy. As a class, brainstorm and discuss how the structure and design of the buoy relates to its function, i.e., the data it is supposed to collect. What special considerations do you think have to be taken into account when designing a buoy for harsh Arctic conditions versus other places on the globe?
![]()
![]()
![]()
 Quick Bite: Analyzing MOSAiC Buoy Data
What, if anything, does the data that has come in from the buoy tell us? Check out the data that has already come in from the MOSAiC SIMB buoys. Click on Current Report to see where the buoy is and the most recent data it transmitted. Click on Time Series to see various time series plots of the different kinds of data the buoy is collecting. What do you notice? What kinds of data is the buoy collecting? Do you notice any patterns in the data? Why do you think MOSAiC scientists are interested in these kinds of data?
MOSAiC SIMB buoy data (click on 'Time Series')
![]()
![]()
![]()
 #askmosaic: Expedition Essentials
This week's submitted question: Is there anything you brought with you to the Arctic that you were really glad to have?
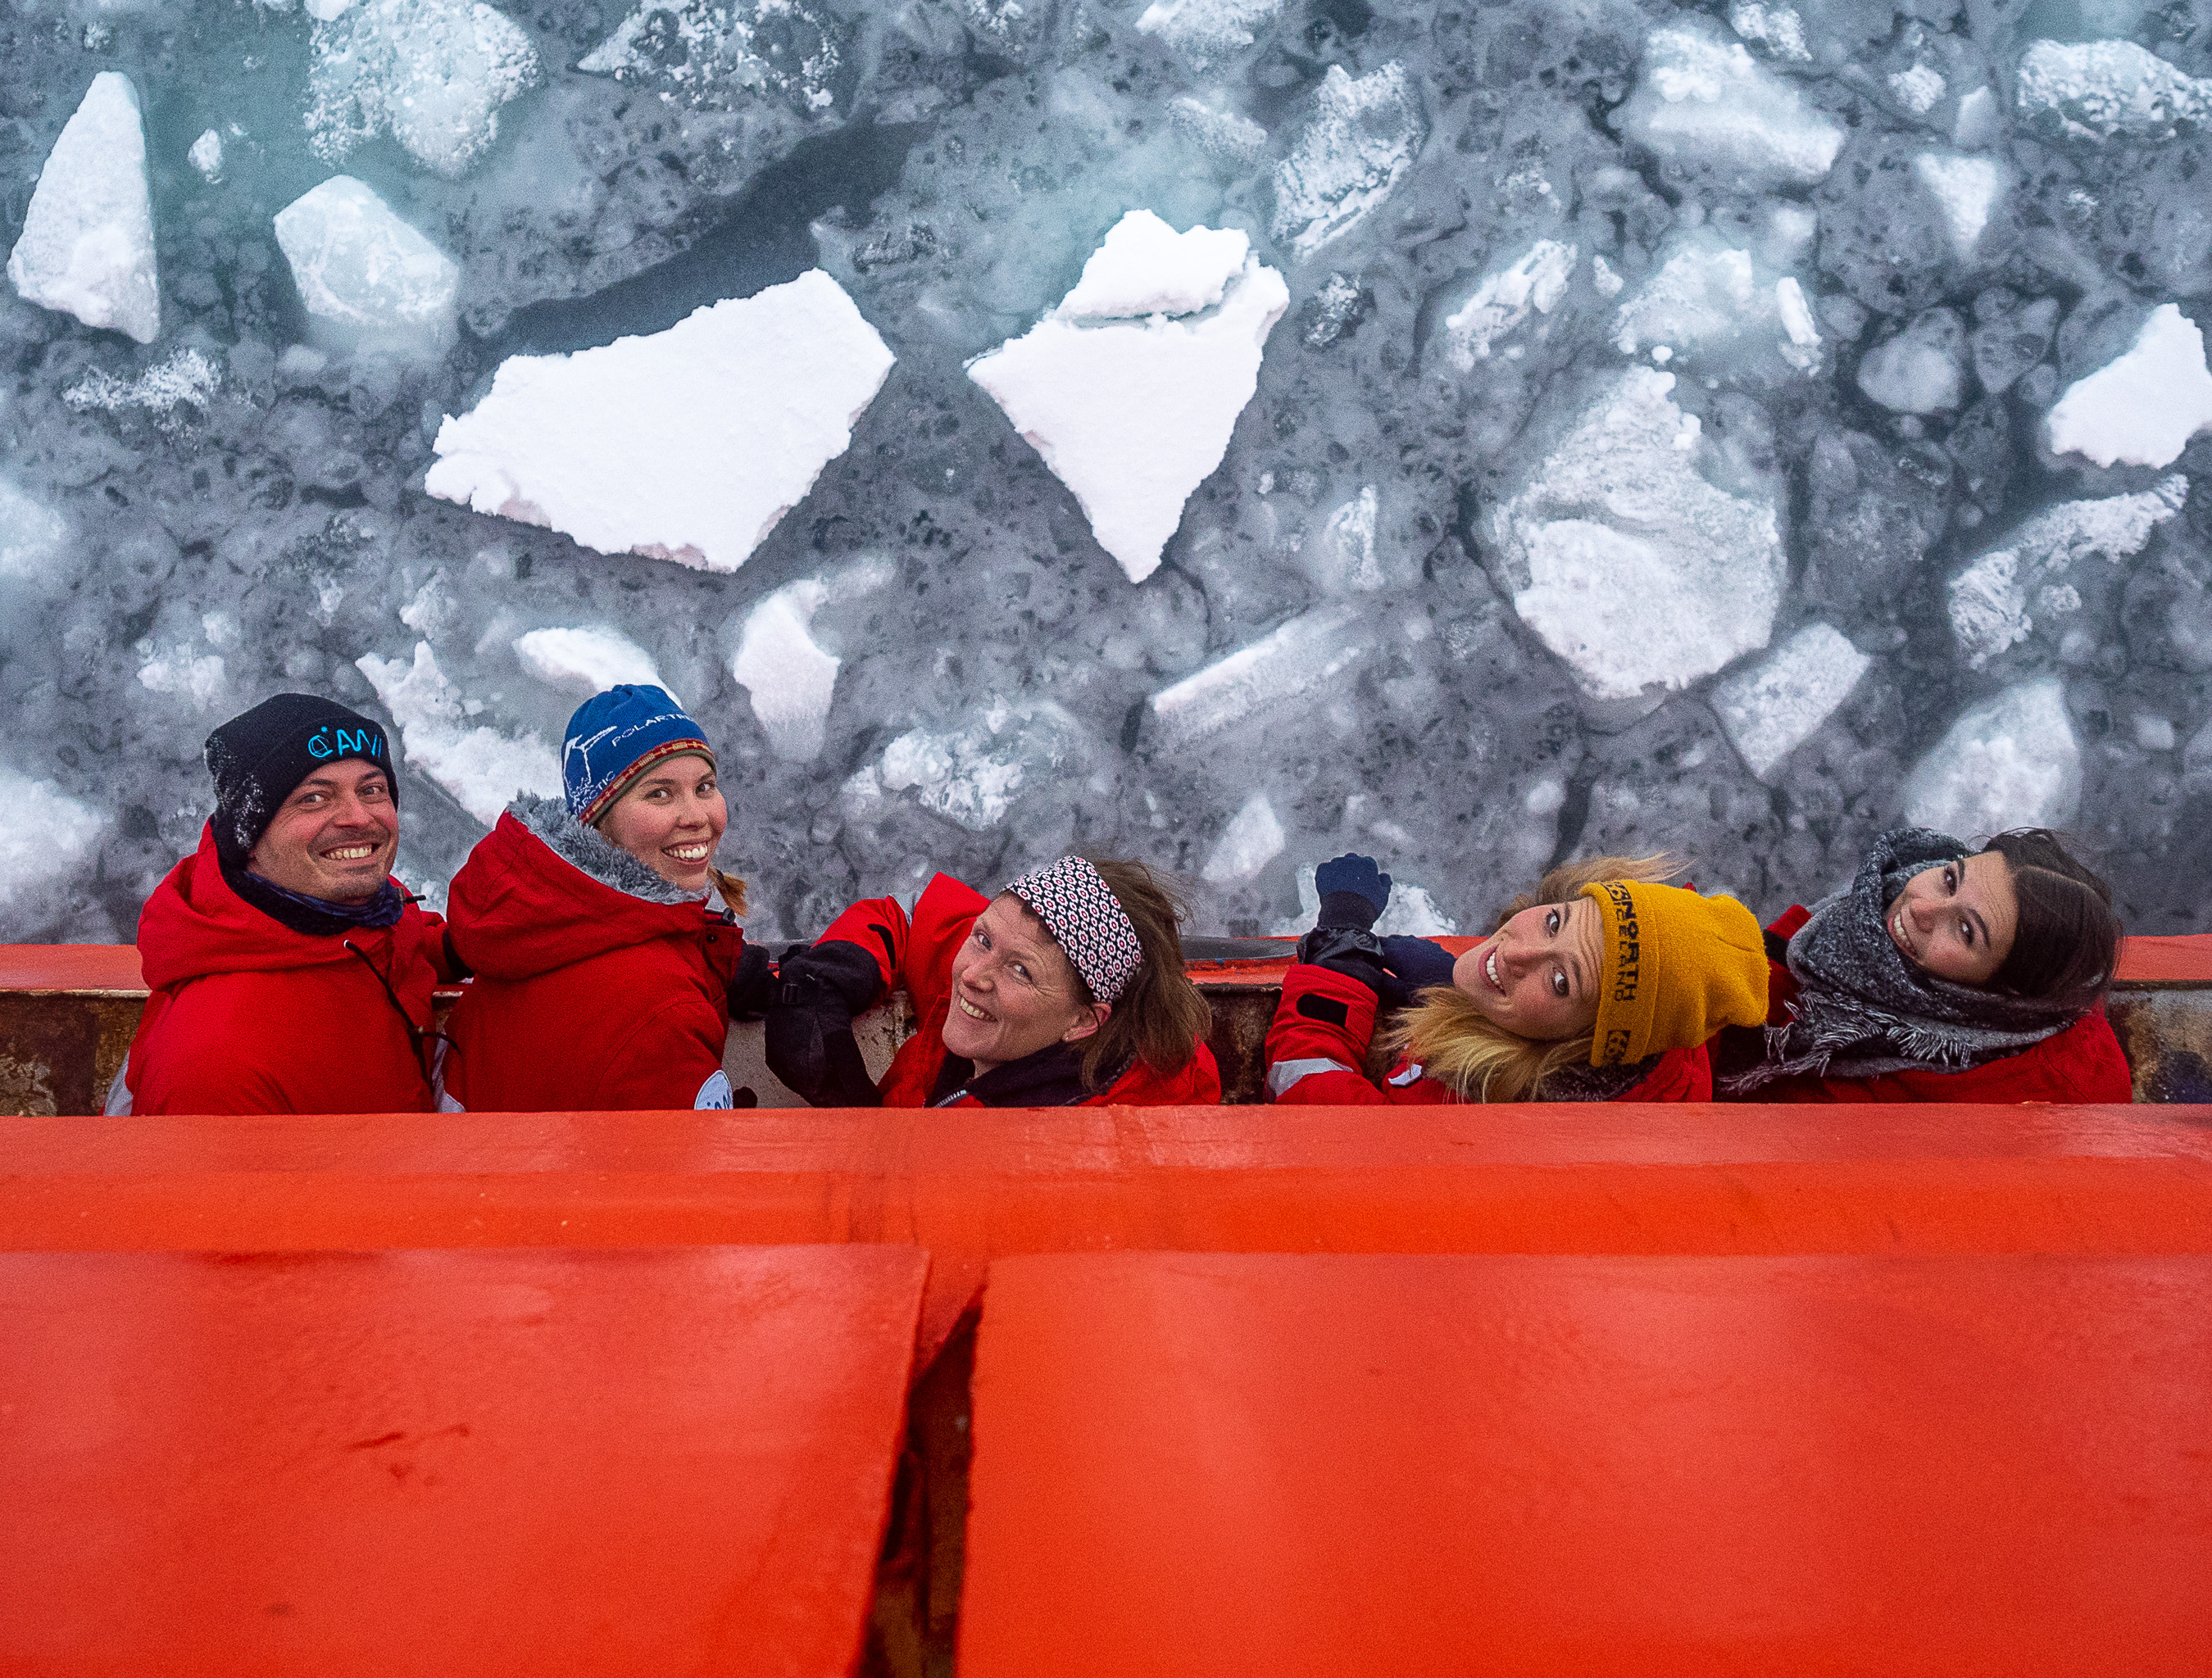
"Good question! I was really happy for the books I brought (lots of time spent in transit) and for the decks of cards that I brought (we played a lot of cards)."
-Anne Gold, CIRES/CU Boulder and MOSAiC School Educator. Anne was part of the team on the Akademik Fedorov that set up the distributed network of instruments during leg 1 of the expedition.
Photo (from left to right): Falk Ebert, Katie Gavenus, Anne Gold, Friederike Krüger, and Lisa- Marie Heusinger on board the Akademik Fedorov; Photo credit: Marc Oggier
Curious about the Arctic and MOSAiC expedition? Here are three ways you can send us your #askmosaic questions:
1. Submit them
2. Email them: mosaic@colorado.edu with subject line "#askmosaic"
3. Tag us on social media: #askmosaic
 MOSAiC Weekly Tracking
Plot the Polarstern
Each week we will provide you with the latitude and longitude coordinates of the Polarstern so that you can track its journey across the Arctic.
Download the map to plot coordinates
Download a larger map of the Arctic for a bigger picture view of the expedition area
Location of the Polarstern
| Date | Latitude | Longitude |
| September 16, 2019 | 69.68 N | 18.99 E |
| September 23, 2019 | 72.31 N | 26.93 E |
| September 30, 2019 | 85.12 N | 138.05 E |
| October 4, 2019** | 85.08 N | 134.43 E |
| October 7, 2019 | 85.10 N | 133.82 E |
| October 14, 2019 | 84.85 N | 135.03 E |
| October 21, 2019 | 84.97 N | 132.73 E |
| October 28, 2019 | 85.47 N | 127.07 E |
| November 4, 2019 | 85.88 N | 121.70 E |
| November 11, 2019 | 85.82 N | 116.00 E |
| November 18, 2019 | 86.05 N | 122.43 E |
| November 25, 2019 | 85.85 N | 121.35 E |
| December 2, 2019 | 85.97 N | 112.95 E |
| December 9, 2019 | 86.25 N | 121.40 E |
| December 16, 2019 | 86.62 N | 118.12 E |
| December 23, 2019 | 86.63 N | 113.20 E |
| December 30, 2019 | 86.58 N | 117.13 E |
| January 6, 2020 | 87.10 N | 115.10 E |
| January 13, 2020 | 87.35 N | 106.63 E |
| January 20, 2020 | 87.42 N | 97.77 E |
| January 27, 2020 | 87.43 N | 95.82 E |
| February 3, 2020 | 87.42 N | 93.65 E |
| February 10, 2020 | 87.78 N | 91.52 E |
| February 17, 2020 | 88.07 N | 78.52 E |
| February 24, 2020 | 88.58 N | 52.87 E |
| March 2, 2020 | 88.17 N | 31.02 E |
| March 9, 2020 | 87.93 N | 24.20 E |
| March 16, 2020 | 86.87 N | 12.70 E |
| March 23, 2020 | 86.20 N | 15.78 E |
| March 30, 2020 | 85.37 N | 13.27 E |
| April 6, 2020 | 84.52 N | 14.38 E |
| April 13, 2020 | 84.28 N | 14.97 E |
| April 20, 2020 | 84.52 N | 14.57 E |
| April 27, 2020 | 83.93 N | 15.65 E |
| May 4, 2020 | 83.92 N | 18.03 E |
| May 11, 2020 | 83.47 N | 13.08 E |
| May 18+, 2020 | 83.32 N | 8.68 E |
| May 25+, 2020 | 82.43 N | 8.28 E |
| June 1+, 2020 | 81.33 N | 9.93 E |
| June 8+, 2020 | 78.10 N | 12.73 E |
| June 15+, 2020 | 82.20 N | 8.18 E |
| June 22, 2020 | 81.95 N | 9.27 E |
| June 29, 2020 | 82.03 N | 9.88 E |
| July 6, 2020 | 81.67 N | 5.22 E |
| July 13, 2020 | 81.40 N | 0.28 E |
| July 20, 2020 | 80.78 N | 0.42 W |
| July 27, 2020 | 79.55 N | 2.37 W |
| August 3, 2020 | 78.60 N | 4.37 W |
| August 10, 2020 | 79.90 N | 5.52 W |
| August 17+, 2020 | 88.28 N | 34.63 W |
| August 24, 2020 | 87.77 N | 105.67 E |
| August 31, 2020 | 88.30 N | 114.23 E |
| September 7, 2020 | 88.68 N | 111.57 E |
| September 14, 2020 | 89.03 N | 103.10 E |
| September 21+, 2020 | 88.37 N | 106.17 E |
**Day when MOSAiC reached the ice floe that the Polarstern will become frozen in and drift with for the next year.
+ Indicates when the Polarstern traveled under its own engine power (no drifting)
Log MOSAiC Data
Keep track of Arctic conditions over the course of the expedition:
**Note to students: If you are trying to access these documents in Google Drive and are unable to, it is likely because your school has blocked access. Try using a personal account to access them, or contact your teacher.
Download Data Logbook for Sept. 2019 - Dec. 2019
Download Data Logbook for Dec. 2019 - Mar. 2020
Download Data Logbook for Mar. 2020 - June 2020
Download Data Logbook for July 2020 - Oct. 2020
| Date | Length of day (hrs) | Air temperature (deg C) at location of Polarstern | Arctic Sea Ice Extent (million km2) |
| September 16, 2019 | 13.25 | High: 10 Low: 4.4 | 3.9 |
| September 23, 2019 | 12.35 | High: 6 Low: -1 | 4.1 |
| September 30, 2019 | 9.1 | -4.7 | 4.4 |
| October 4, 2019** | 6.27 | -13.0 | 4.5 |
| October 7, 2019 | 3.05 | -8.2 | 4.6 |
| October 14, 2019 | 0 | -14.7 | 4.8 |
| October 21, 2019 | 0 | -12.8 | 5.4 |
| October 28, 2019 | 0 | -18.3 | 6.8 |
| November 4, 2019 | 0 | -18.9 | 8.0 |
| November 11, 2019 | 0 | -25.5 | 8.7 |
| November 18, 2019 | 0 | -10.7 | 9.3 |
| November 25, 2019 | 0 | -18.4 | 10.0 |
| December 2, 2019 | 0 | -26.6 | 10.4 |
| December 9, 2019 | 0 | -23.1 | 11.2 |
| December 16, 2019 | 0 | -19.2 | 11.8 |
| December 23, 2019 | 0 | -26.9 | 12.2 |
| December 30, 2019 | 0 | -26.4 | 12.6 |
| January 6, 2020 | 0 | -28.0 | 13.0 |
| January 13, 2020 | 0 | -30.7 | 13.1 |
| January 20, 2020 | 0 | -27.1 | 13.6 |
| January 27, 2020 | 0 | -22.5 | 13.8 |
| February 3, 2020 | 0 | -28.8 | 14.1 |
| February 10, 2020 | 0 | -26.2 | 14.5 |
| February 17, 2020 | 0 | -31.9 | 14.4 |
| February 24, 2020 | 0 | -24.0 | 14.6 |
| March 2, 2020 | 0 | -35.5 | 14.8 |
| March 9, 2020 | 0 | -37.9 | 14.7 |
| March 16, 2020 | 10.5 | -27.5 | 14.7 |
| March 23, 2020 | 16.5 | -28.7 | 14.4 |
| March 30, 2020 | 24 | -28.6 | 14.0 |
| April 6, 2020 | 24 | -18.2 | 13.7 |
| April 13, 2020 | 24 | -25.8 | 13.6 |
| April 20, 2020 | 24 | -10.2 | 13.3 |
| April 27, 2020 | 24 | -11.7 | 12.8 |
| May 4, 2020 | 24 | -16.2 | 12.8 |
| May 11, 2020 | 24 | -10.4 | 12.4 |
| May 18, 2020 | 24 | -5.1 | 11.7 |
| May 25, 2020 | 24 | 0.4 | 11.5 |
| June 1, 2020 | 24 | 0.0 | 11.1 |
| June 8+, 2020 | 24 | -0.1 | 10.6 |
| June 15+, 2020 | 24 | -0.4 | 10.1 |
| June 22, 2020 | 24 | -0.4 | 9.6 |
| June 29, 2020 | 24 | 0.5 | 9.2 |
| July 6, 2020 | 24 | 0.6 | 8.2 |
| July 13, 2020 | 24 | 0.2 | 7.2 |
| July 20, 2020 | 24 | -0.1 | 6.2 |
| July 27, 2020 | 24 | 1.9 | 5.8 |
| August 3, 2020 | 24 | 1.2 | 5.5 |
| August 10, 2020 | 24 | 0.9 | 5.1 |
| August 17, 2020 | 24 | 0.7 | 4.6 |
| August 24, 2020 | 24 | -0.9 | 3.9 |
| August 31, 2020 | 24 | -0.9 | 3.7 |
| September 7, 2020 | 24 | -5.9 | 3.4 |
| September 14, 2020 | 24 | -0.5 | 3.8 |
| September 21, 2020 | 19.7 | -10.8 | 4.0 |
*Note: We expect data to fall within the following ranges: Length of day, 0-24 hours; Temperature, -40 to 14 degrees C; Sea ice extent, 3-15 million km2
**Day when MOSAiC reached the ice floe that the Polarstern will become frozen in and drift with for the next year.
Is there something you'd like to see in MOSAiC Monday? Let us know!
Send us your feedback
New to MOSAiC Monday? Check out past editions!
Browse more expedition-related educational resources, videos, and blogs
Email us! mosaic@colorado.edu
 MOSAiC Monday and the NGSS
What do those funny symbols below some engagements mean?
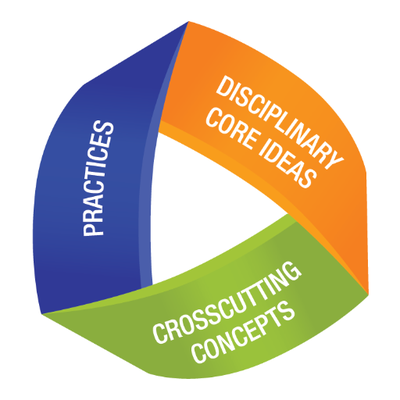
Good news for educators in the U.S. teaching with the Next Generation Science Standards (NGSS) or similar! We will now be tagging MOSAiC Monday engagements with the NGSS Disciplinary Core Idea subject(s), Science and Engineering Practice(s), and Crosscutting Concept(s) that they most closely connect to. Look for these symbols listed below each engagement:
Disciplinary Core Idea Subjects
Science and Engineering Practices (adopted from the San Diego County Office of Education Science Resource Center)
Crosscutting Concepts (adopted from the San Diego County Office of Education Science Resource Center)