 MOSAiC and Polar-Related Remote Learning Resources
Parents, teachers, and anyone looking for virtual, remote, and at-home learning resources: We'll be continuously updating a list of polar and MOSAiC-related remote learning resources, including videos and other multimedia, activities, online interactives and live events, and more that you can access for free. Check out the website below!
Browse our list of polar and MOSAiC-related virtual, remote, and at-home learning resources
 This week's Museum of MOSAiC Art Challenge
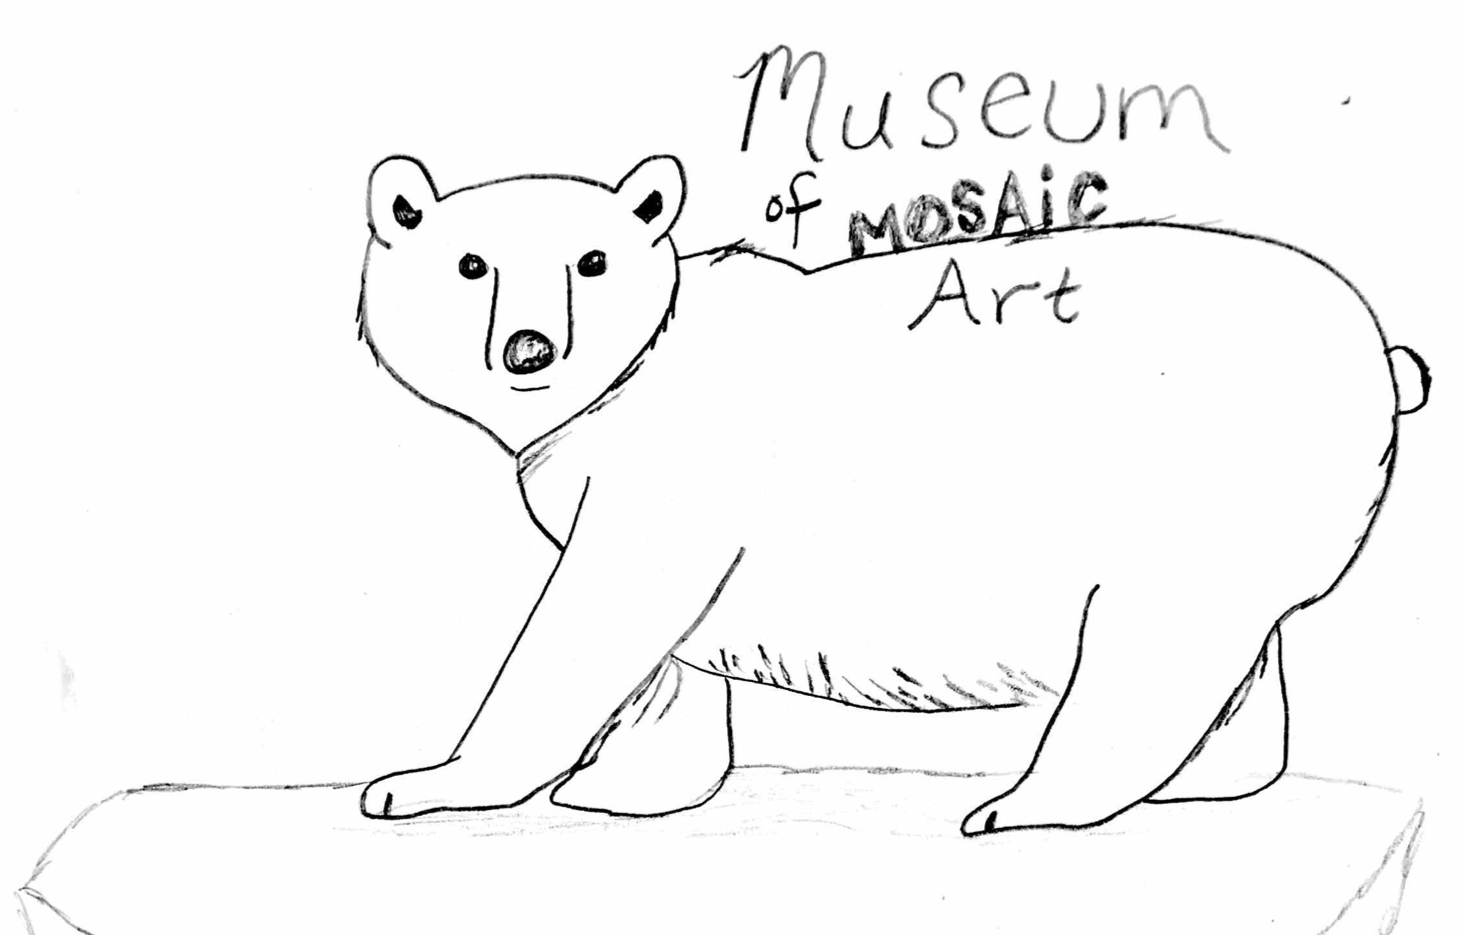
We challenge YOU to create a piece of art (drawing, sculpture, poem, etc.) that reflects your favorite part of the MOSAiC expedition so far.
Submit a photo of your artwork here to be featured in the Museum of MOSAiC Art!
Browse the Museum of MOSAiC Art virtual galleries
MOSAiC Science Focus Area
The Ocean: Part II
Did you miss The Ocean: Part I? Check it out here!
Earth's oceans are not static homogeneous bodies of water. They are continuously in motion, flowing not only 'horizontally' from one place to another, but also vertically, from the surface down to the depths and back up.
Gif (R) from NASA's Perpetual Ocean
The movement of the Arctic Ocean is a fundamental component of the MOSAiC expedition. From the very beginning, the goal of the expedition was to freeze the icebreaker Polarstern into the Arctic sea ice and let it drift along with surface currents across the Arctic for an entire year. But the Polarstern couldn't just be frozen into the sea ice anywhere - expedition leaders had to be very careful to freeze the ship in a place where it would not drift into the Russian exclusive economic zone (EEZ), as data collection is prohibited here. They also wanted to avoid getting sucked into a gyre (rotating current), where they would just drift around in a circle instead of drifting across the Arctic.
Measuring an Ocean in Motion
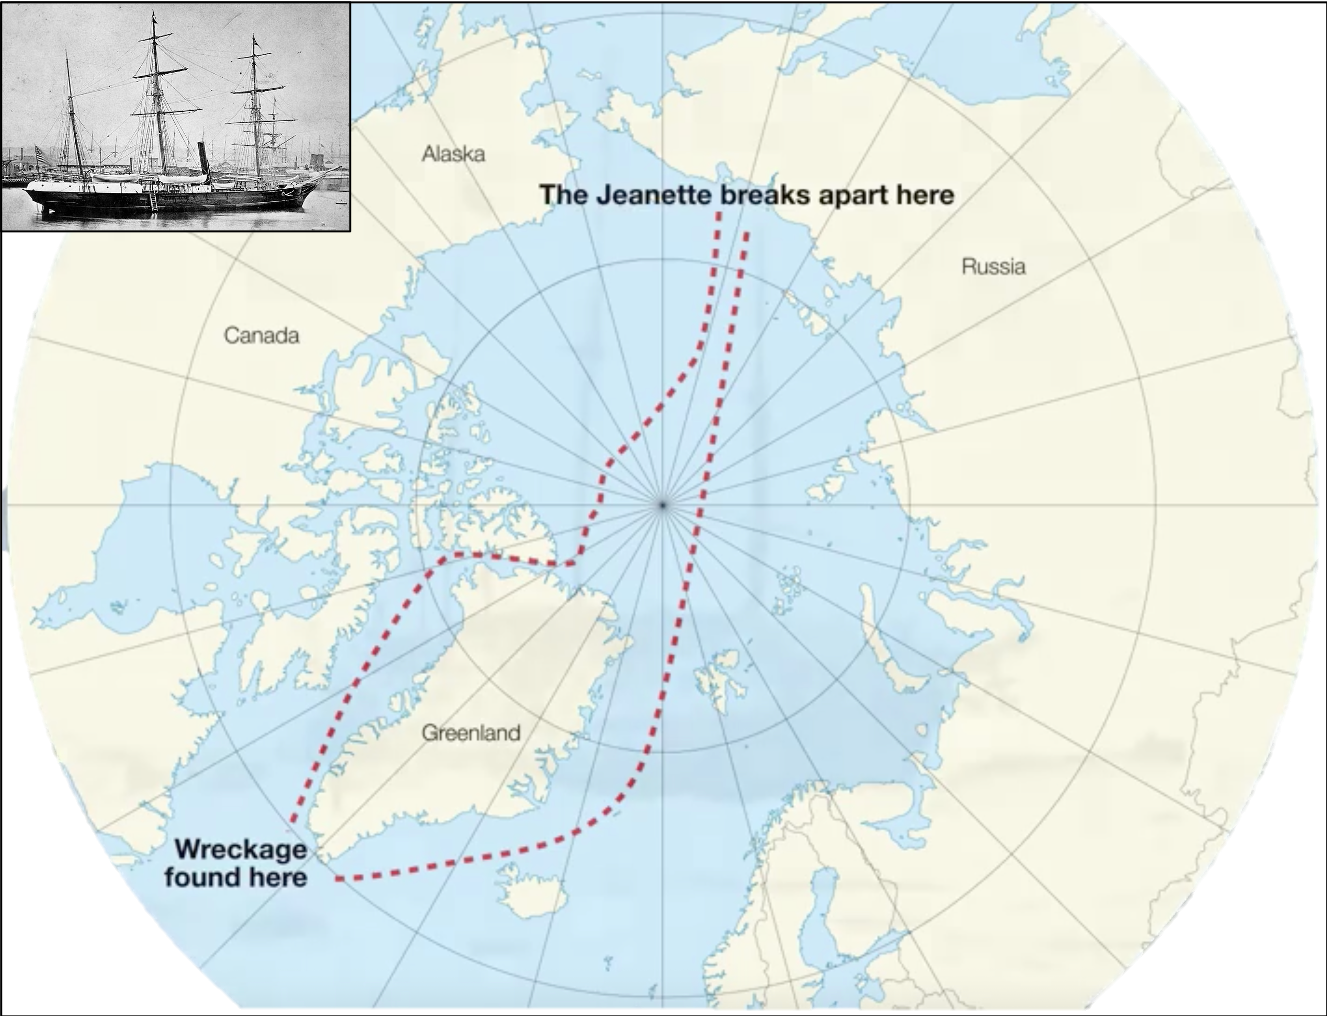
How do we even know about ocean currents and how they flow? One scientific instrument that has been used to track ocean surface currents is called a drifter, which drifts along with an ocean current and can be tracked using GPS. There have been times in the past when serendipitous and accidental drifters have given us insight into ocean surface currents. In 1881, the USS Jeannette was crushed by sea ice and sank north of Siberia during a failed expedition to the North Pole. Three years later, wreckage of the Jeannette was discovered by Inuit on the southwest coast of Greenland nearly 2900 nautical miles from where it sank!
This discovery provided compelling evidence to a Norwegian explorer named Fridtjof Nansen of the existence of a surface current across the Arctic Ocean. In 1893 Nansen successfully froze his ship, the Fram, into Arctic sea ice where it drifted across the Arctic Ocean for three years, confirming the existence of what we now call the Transpolar Drift current. Knowledge gained about the Arctic Ocean from the Fram expedition is one of the things that has made MOSAiC possible. Map (L) credit: Kathy Bogan; Photo of the USS Jeannette: U.S. Naval Historical Center
Explore the Arctic Aboard the Fram
What drives surface currents in the ocean? Learn more here!
 Arctic Current Events
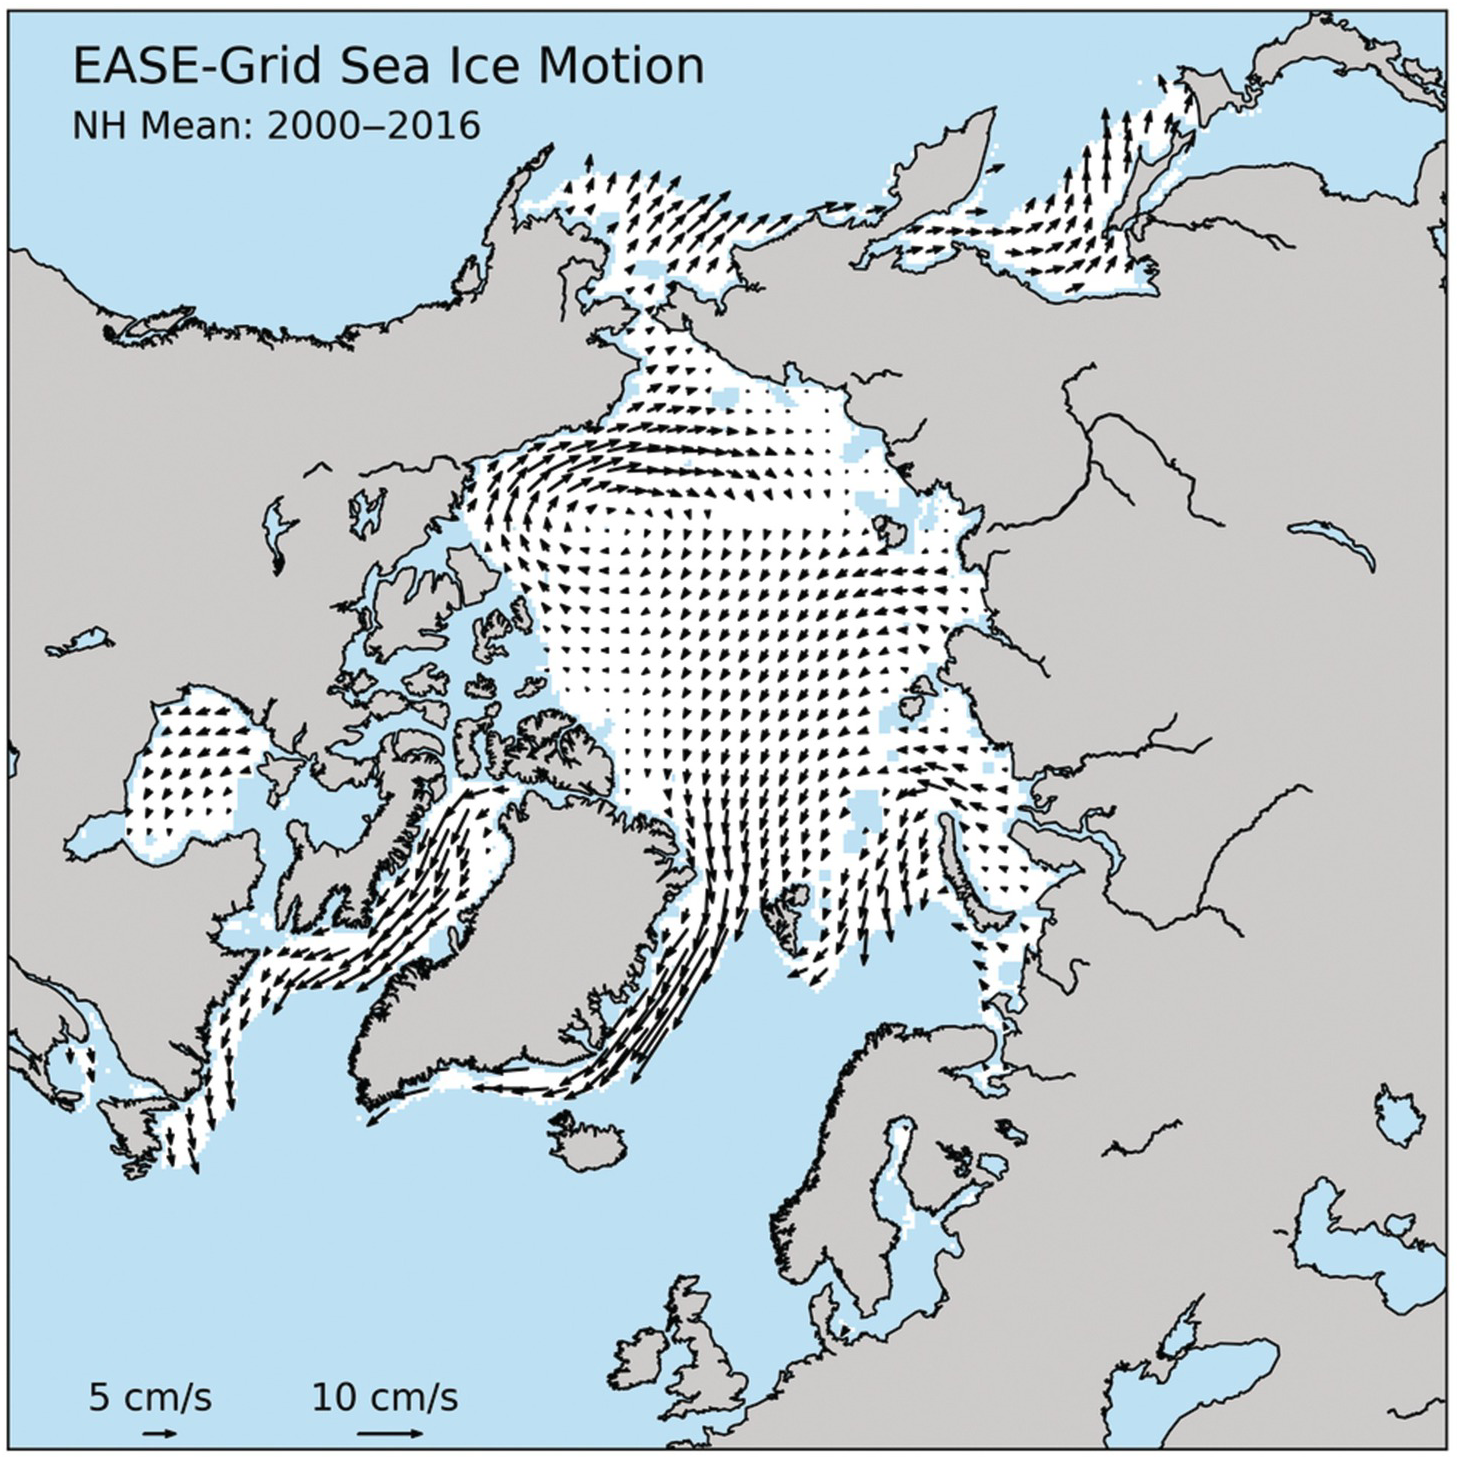
Take a look at the figure to the right (click on it for a larger PDF version), which shows the motion of Arctic sea ice represented as vectors. Vectors are just arrows which point in the direction that something is going (in this case, the ice motion) and whose length represent the magnitude of something (in this case, how fast the ice is moving). Treating this figure like a connect-the-dots puzzle, can you connect vectors together to find the following main Arctic surface currents?:
- Beaufort Gyre - a rotating current off the north coast of Canada and Alaska
- Transpolar Drift - the main current that moves across the Arctic Ocean from Siberia to Greenland
- Labrador Current - a strong current that flows south between Greenland and Canada
- East Greenland Current - current that flows south along the eastern side of Greenland
Figure credit: NASA/NSIDC/DAAC/University of Colorado Tschudi, Meier, Stewart
Additional Challenge!
Have you been tracking the location of the Polarstern with the MOSAiC Monday Weekly Tracking data (see below)? If not, you can see its track on the MOSAiC web app. The goal of MOSAiC was to park the ship in a place where it could drift across the Arctic with the Transpolar Drift. Were they successful? Can you predict where the ship will drift over the next several months?
View and download larger version of ice motion map
 #askmosaic: Send encouragements to MOSAiC team members!
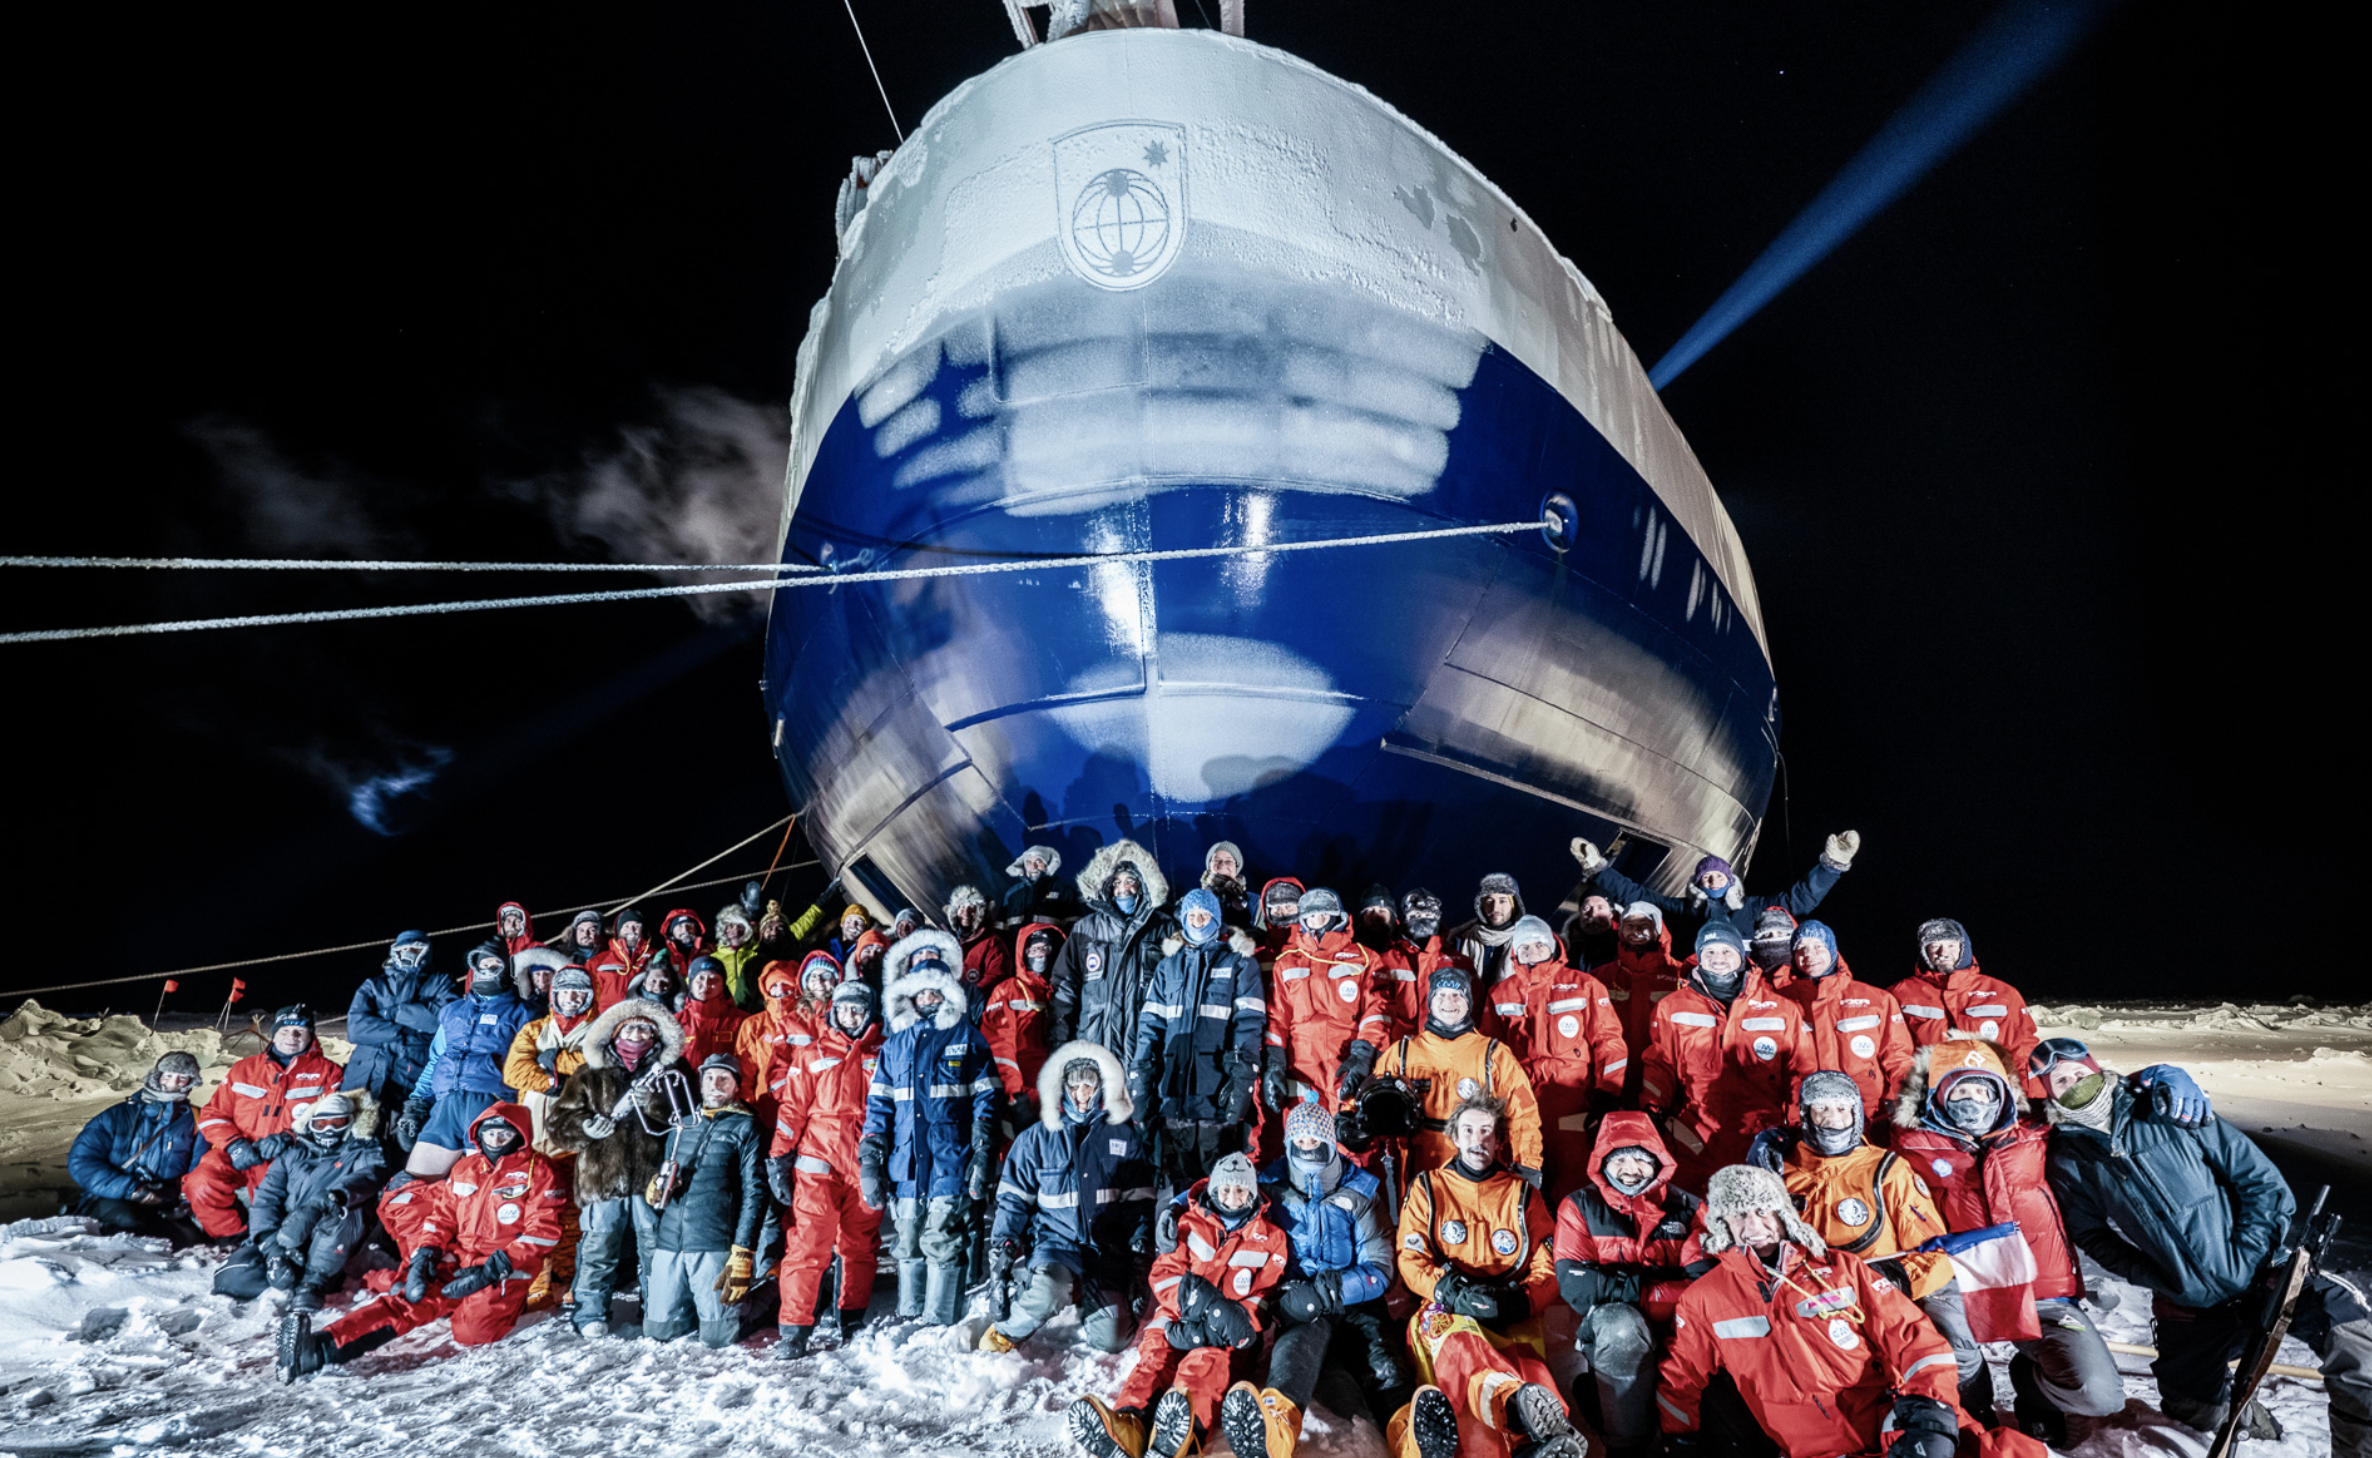
Usually each week we feature one or two #askmosaic questions you've submitted to us with answers from MOSAiC expedition team members. We still want you to submit your questions, and we'll continue to feature them in MOSAiC Monday. However, this week we want to ask you to send us something in addition to your #askmosaic questions. It's difficult enough to leave your friends and family and live in one of the most remote places on the planet for 3+ months. It is even more difficult during a time like this when so much has changed in the world as a result of the coronavirus spread. MOSAiC team members on the Polarstern could use some encouragements and uplifting words from you! Use the link below to send messages of encouragement, funny jokes, your favorite moments from MOSAiC, etc. to those on board the ship. And stay safe and healthy!
Photo credit: Lukas Piotrowski
Send words of encouragement to MOSAiC participants on board the Polarstern
Submit your #askmosaic questions
This week's featured remote learning resources
Just released! MOSAiC Distributed Network 360-degree Virtual Reality Experience
The Polarstern has always been the central base of operations for MOSAiC. But at the beginning of the expedition, researchers set up a 'distributed network' of scientific instruments and measurement stations at remote locations on the ice around the ship, in some cases up to 50 km (31 miles) away! Now you can experience first-hand what it is like to be a scientist on the ice or on the ship with this free 360-degree virtual Google Expedition. This expedition also works as a virtual reality experience using Google Cardboard and a smartphone.
Go to the MOSAiC Distributed Network 360-degree virtual experience
Ocean Protection Advocacy Kids - Free Ocean Webinars
Although not specifically about the Arctic, these free webinars are designed to engage kids of all ages in everything from ocean chemistry to plankton to sea creature adaptations. Live webinars will be broadcasted on Zoom and YouTube live, and past recorded webinars can be accessed via YouTube. OPAK also provides follow-up activities so that the learning can continue even after the webinar is over!
Learn more about OPAK's free ocean webinars
Ocean Wise - Ocean Literacy Courses for Elementary, Middle and High School Students
These online courses are free, self-directed, and interactive for students in grade 3 to 12, and anyone who is interested in learning more about the ocean. Students can take the course at their own pace, and earn exciting badges for every accomplishment they make throughout the course.
Check out Ocean Wise's Ocean Literacy Courses
NASA: Fly through Greenland Ice in this 360-Degree Experience
 MOSAiC Weekly Tracking
Plot the Polarstern
Each week we will provide you with the latitude and longitude coordinates of the Polarstern so that your students can track its journey across the Arctic in your classroom.
Download the map to plot coordinates
Download a larger map of the Arctic for a bigger picture view of the expedition area
Location of the Polarstern
| Date | Latitude | Longitude |
| September 16, 2019 | 69.68 N | 18.99 E |
| September 23, 2019 | 72.31 N | 26.93 E |
| September 30, 2019 | 85.12 N | 138.05 E |
| October 4, 2019** | 85.08 N | 134.43 E |
| October 7, 2019 | 85.10 N | 133.82 E |
| October 14, 2019 | 84.85 N | 135.03 E |
| October 21, 2019 | 84.97 N | 132.73 E |
| October 28, 2019 | 85.47 N | 127.07 E |
| November 4, 2019 | 85.88 N | 121.70 E |
| November 11, 2019 | 85.82 N | 116.00 E |
| November 18, 2019 | 86.05 N | 122.43 E |
| November 25, 2019 | 85.85 N | 121.35 E |
| December 2, 2019 | 85.97 N | 112.95 E |
| December 9, 2019 | 86.25 N | 121.40 E |
| December 16, 2019 | 86.62 N | 118.12 E |
| December 23, 2019 | 86.63 N | 113.20 E |
| December 30, 2019 | 86.58 N | 117.13 E |
| January 6, 2020 | 87.10 N | 115.10 E |
| January 13, 2020 | 87.35 N | 106.63 E |
| January 20, 2020 | 87.42 N | 97.77 E |
| January 27, 2020 | 87.43 N | 95.82 E |
| February 3, 2020 | 87.42 N | 93.65 E |
| February 10, 2020 | 87.78 N | 91.52 E |
| February 17, 2020 | 88.07 N | 78.52 E |
| February 24, 2020 | 88.58 N | 52.87 E |
| March 2, 2020 | 88.17 N | 31.02 E |
| March 9, 2020 | 87.93 N | 24.20 E |
| March 16, 2020 | 86.87 N | 12.70 E |
| March 23, 2020 | 86.20 N | 15.78 E |
| March 30, 2020 | 85.37 N | 13.27 E |
| April 6, 2020 | 84.52 N | 14.38 E |
**Day when MOSAiC reached the ice floe that the Polarstern will become frozen in and drift with for the next year.
Log MOSAiC Data
Keep track of Arctic conditions over the course of the expedition:
Download Data Logbook for Sept. 2019 - Dec. 2019
Download Data Logbook for Dec. 2019 - Mar. 2020
*NEW* Download Data Logbook for Mar. 2020 - June 2020
Having trouble accessing these data logbooks? Email us at mosaic@colorado.edu
| Date | Length of day (hrs) | Air temperature (deg C) at location of Polarstern | Arctic Sea Ice Extent (million km2) |
| September 16, 2019 | 13.25 | High: 10 Low: 4.4 | 3.9 |
| September 23, 2019 | 12.35 | High: 6 Low: -1 | 4.1 |
| September 30, 2019 | 9.1 | -4.7 | 4.4 |
| October 4, 2019** | 6.27 | -13.0 | 4.5 |
| October 7, 2019 | 3.05 | -8.2 | 4.6 |
| October 14, 2019 | 0 | -14.7 | 4.8 |
| October 21, 2019 | 0 | -12.8 | 5.4 |
| October 28, 2019 | 0 | -18.3 | 6.8 |
| November 4, 2019 | 0 | -18.9 | 8.0 |
| November 11, 2019 | 0 | -25.5 | 8.7 |
| November 18, 2019 | 0 | -10.7 | 9.3 |
| November 25, 2019 | 0 | -18.4 | 10.0 |
| December 2, 2019 | 0 | -26.6 | 10.4 |
| December 9, 2019 | 0 | -23.1 | 11.2 |
| December 16, 2019 | 0 | -19.2 | 11.8 |
| December 23, 2019 | 0 | -26.9 | 12.2 |
| December 30, 2019 | 0 | -26.4 | 12.6 |
| January 6, 2020 | 0 | -28.0 | 13.0 |
| January 13, 2020 | 0 | -30.7 | 13.1 |
| January 20, 2020 | 0 | -27.1 | 13.6 |
| January 27, 2020 | 0 | -22.5 | 13.8 |
| February 3, 2020 | 0 | -28.8 | 14.1 |
| February 10, 2020 | 0 | -26.2 | 14.5 |
| February 17, 2020 | 0 | -31.9 | 14.4 |
| February 24, 2020 | 0 | -24.0 | 14.6 |
| March 2, 2020 | 0 | -35.5 | 14.8 |
| March 9, 2020 | 0 | -37.9 | 14.7 |
| March 16, 2020 | 10.5 | -27.5 | 14.7 |
| March 23, 2020 | 16.5 | -28.7 | 14.4 |
| March 30, 2020 | 24 | -28.6 | 14.0 |
| April 6, 2020 | 24 | -18.2 | 13.7 |
*Note: We expect data to fall within the following ranges: Length of day, 0-24 hours; Temperature, -40 to 14 degrees C; Sea ice extent, 3-15 million km2
**Day when MOSAiC reached the ice floe that the Polarstern will become frozen in and drift with for the next year.
Is there something you'd like to see in MOSAiC Monday? Let us know!
Send us your feedback
New to MOSAiC Monday? Check out past editions!
Browse more expedition-related educational resources, videos, and blogs
Email us! mosaic@colorado.edu