Ebb and Floe
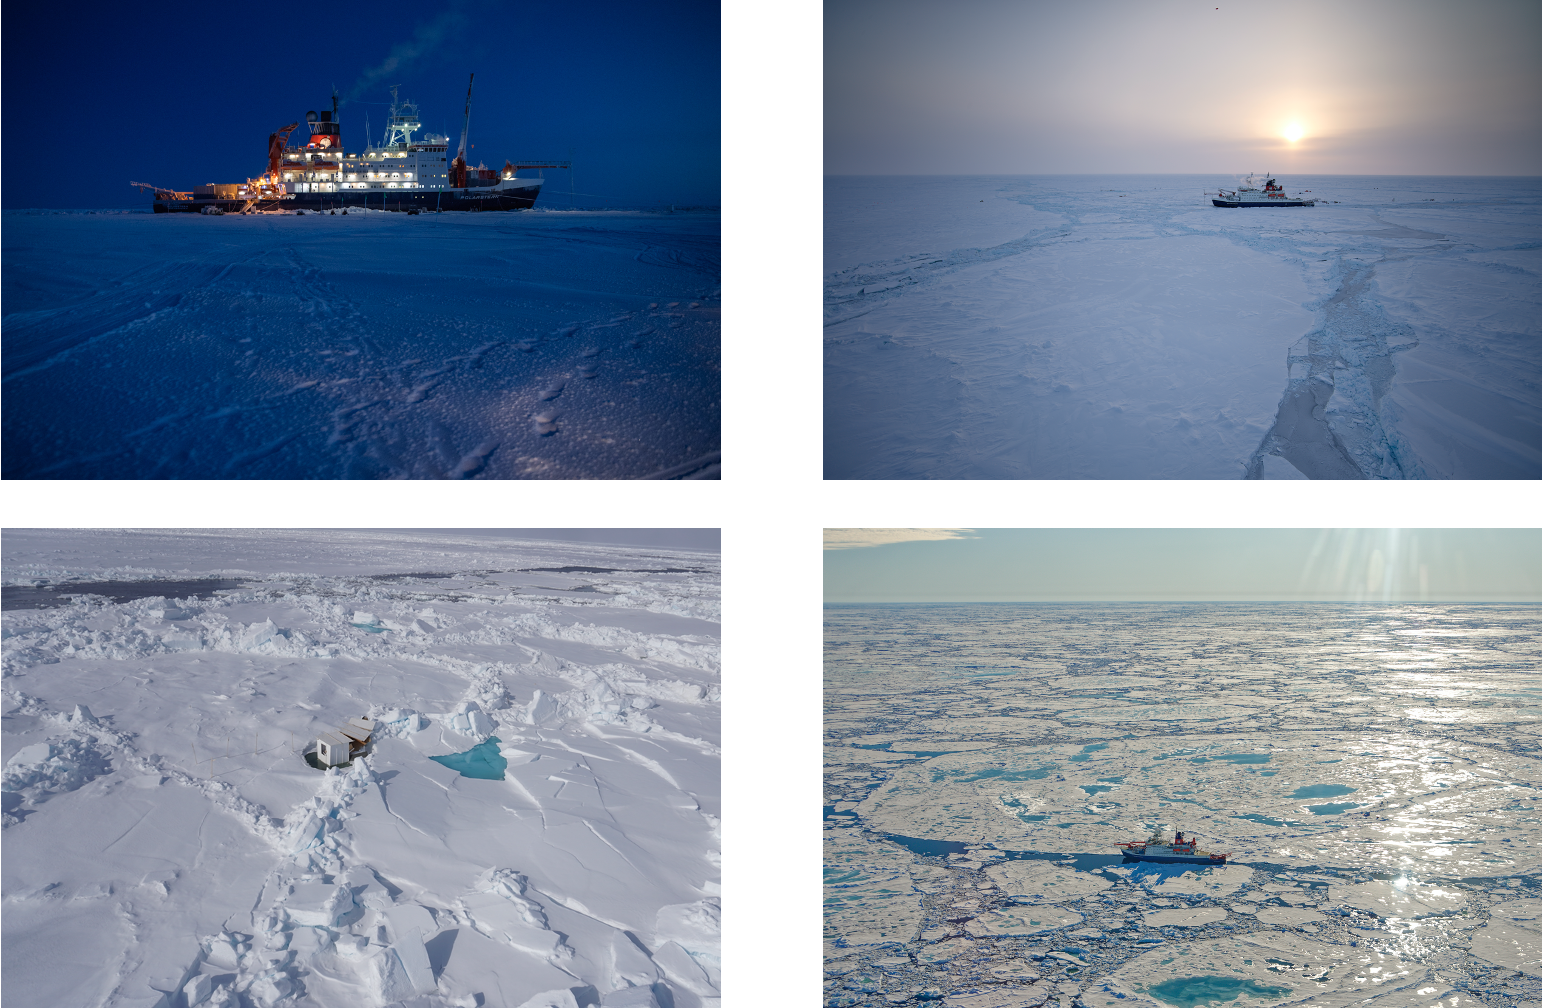
The MOSAiC expedition has been going on now for more than 300 days! In this amount of time, the Arctic sea ice has gone through some significant changes, growing in extent from just 3.9 million km2 last September when the expedition started to 14.8 million km2 in March 2020, and then shrinking back down again. They say change is the only constant, and that is certainly true for MOSAiC! This week, the report from the ship is that the Polarstern's ice floe is approaching the sea ice edge in the Arctic and coming to the end of its life cycle. The sea ice surface looks very different than it did several months ago when the sun was barely making it over the horizon.
The pictures below show a time series of how the MOSAiC floe has changed over time. Top left: MOSAiC floe on October 25, 2019 (photo by Esther Horvath/AWI); Top right: MOSAiC floe on March 22, 2020 (photo by Michael Gutsche/AWI); Bottom left: MET City hut on the MOSAiC floe on June 14, 2020 (photo by Markus Rex/AWI); Bottom right: MOSAiC floe on June 30, 2020 (photo by Markus Rex/AWI)
Browse more MOSAiC high-resolution photos in the MOSAiC Media Centre
Like MOSAiC to Your Ears
Get more MOSAiC in your life with blogs, podcasts, videos, and more! Here are some of our favorite recent MOSAiC multimedia releases:
 MOSAiC Mixdown: mini podcasts from the Arctic
MOSAiC School Ambassador Sam Cornish produces these short (but sweet!) podcasts sharing his experiences and thoughts as a MOSAiC leg 1 participant. In his latest episode, Sam talks about how scientific endeavors like MOSAiC benefit from a multidisciplinary approach. Check them out!
Listen to MOSAiC Mixdown on Apple Podcasts or Spotify
 The IcePod: The Podcast About Polar Science and the People
Hear directly from team members who were on board the Polarstern during MOSAiC! In the latest episode, MOSAiC media project manager Anja Sommerfeld of the Alfred Wegener Institute talks about why she set her alarm clock to exactly 7:13 am during leg 2, what it took to prepare 77 weather balloons, and why working with Lady Miss Piggy can be tough.
 #askmosaic: Ice Spy
This week's question was sent by Everett and Emmett from Double Eagle Elementary School in Albuquerque: Can you play the game 'I spy' in the Arctic?
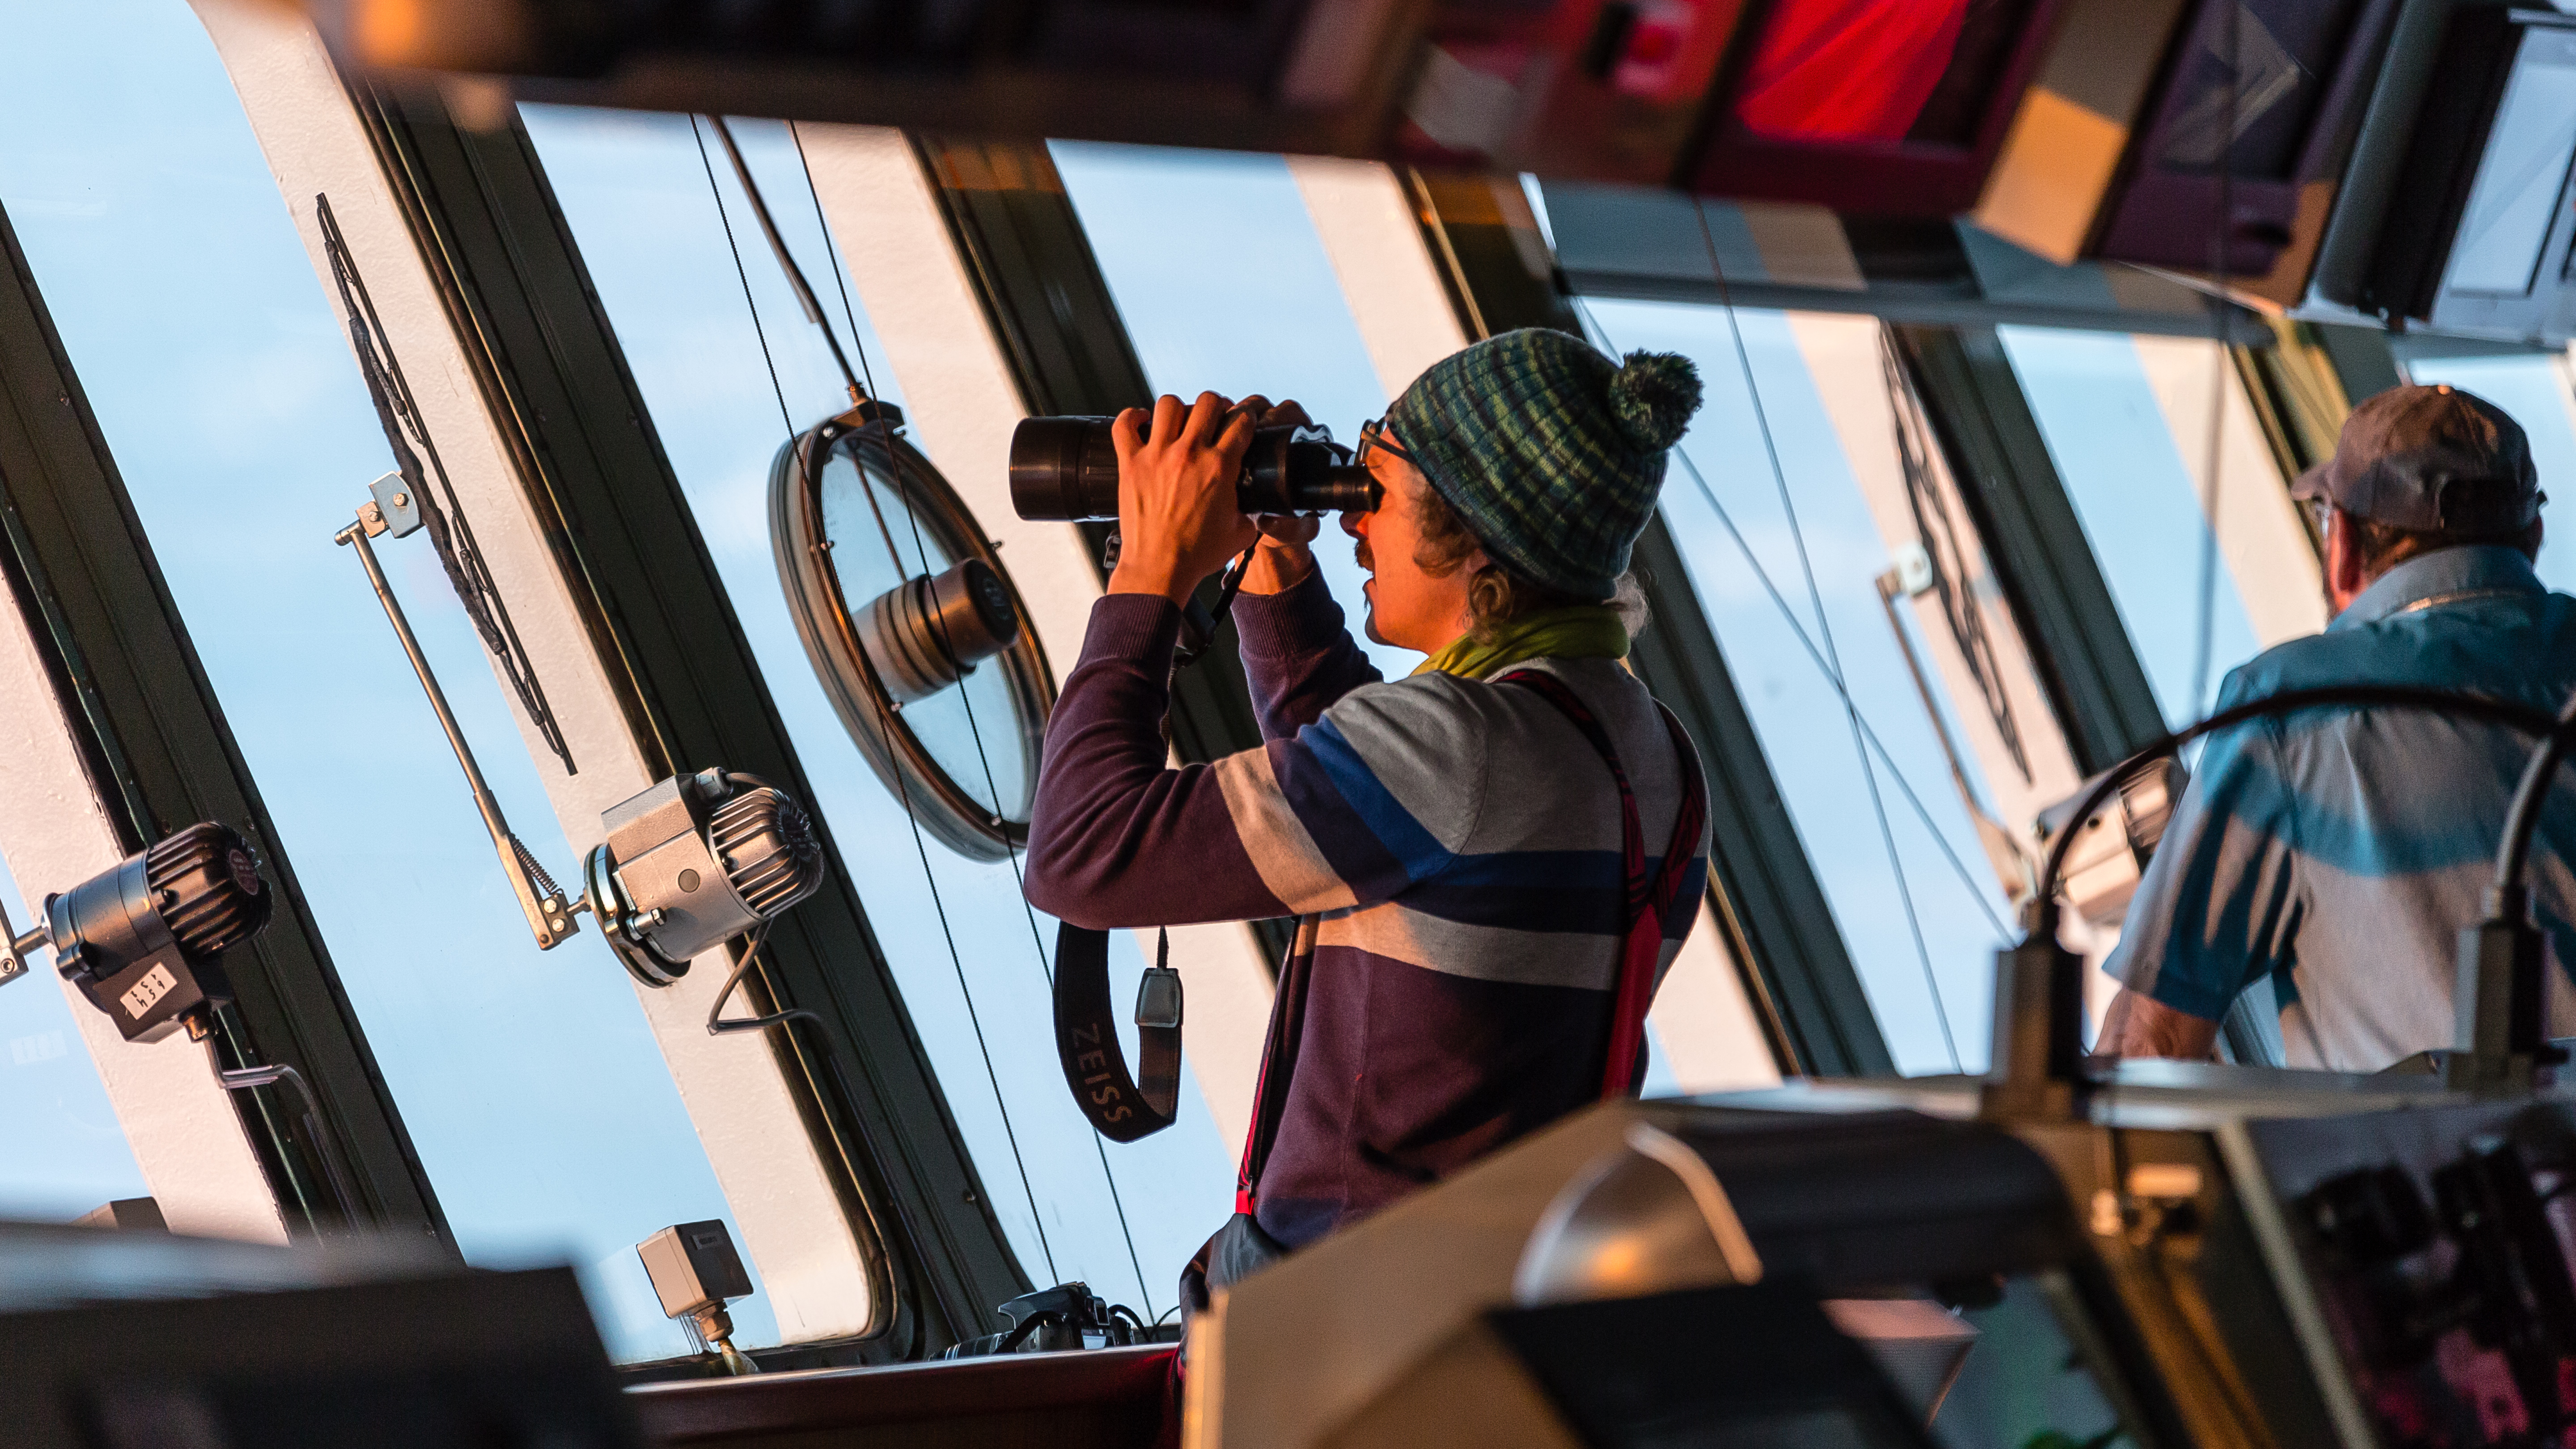
"While not a game, we have people on the ice and on the ship's bridge whose only job is to watch for bears. We all do this job, usually in shifts of 1-2 hours. As we have drifted more to the south we occasionally see birds; gulls and snow buntings, for example. The message of an animal sighting comes over the radio and everyone looks for it. With all of the movement of the ice for many weeks I played a game of "I spy" or maybe more like Where's Waldo with Met City in the morning, as it would often be in a different place when I woke up than where I left it when I went to sleep."
-Chris Cox, NOAA; Chris recently returned from leg 3 of the expedition
Photo: Thomas Sterbenz during bridge watch, 5th of October 2019; Photo by Stefan Hendricks/AWI
Curious about the Arctic and MOSAiC expedition? Here are three ways you can send us your #askmosaic questions:
1. Submit them
2. Email them: mosaic@colorado.edu with subject line "#askmosaic"
3. Tag us on social media: #askmosaic
 MOSAiC Virtual Summer Camp
Did you or your kids have summer camp plans that fell through because of COVID? Not to worry! Tune in to MOSAiC Monday each week for a fun, hands-on and engaging virtual summer camp activity related to MOSAiC or the Arctic. All MVSC activities should be done with parent supervision!
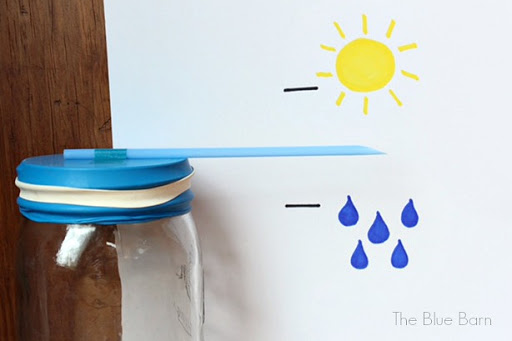
This Week's Activity: Build Your Own Barometer
Members of MOSAiC Team ATMOS are busy collecting data to learn more about the Arctic atmosphere and its connections with the Arctic sea ice and ocean. One of the things that MOSAiC scientists measure is atmospheric pressure. Although you might not be aware of it, the air in Earth's atmosphere exerts pressure on the earth's surface because air molecules have weight. And this pressure doesn't stay the same all of the time - it changes depending on the density of air molecules, or how close together they are in a given area. The density of air molecules can change as the temperature changes. Thus, MOSAiC scientists aren't the only ones interested in keeping track of air pressure - meteorologists, like those you might see on your local television station, pay attention to it too as air pressure is related to weather.
Did you know that you can create your own barometer, or instrument to measure air pressure? 'Baro' comes from the Greek word baros, which means weight or pressure.
What you will need:
-
small glass jar or tin can
-
large (12”) round balloon
-
rubber band
-
scissors
-
tape
-
small stirring stick or drinking straw
-
5” x 7” index card
-
Pen or pencil
What to do:
1. Cut off the top of the balloon using scissors.
2. Wrap the balloon tightly around the top of your jar or can and seal it with the rubber band. You want the balloon to be tight over the top of the jar/can and secure so that no air can get in or out of the jar/can.
3. Tape one end of the stirring stick or straw to the middle of the balloon on the top of your jar/can so that the other end of the stick/straw points away from the jar/can.
4. Place your barometer next to a wall and tape the index card to the wall. With a pen or pencil, mark on the index car next to where the stick/straw is pointing with the date. Over the next week (or longer!) continue marking the location of the stick/straw on the index card and notice any changes. If it moves up, this is because air pressure has increased and is exerting more force downward on the balloon. If it moves down, the opposite is happening. Keep a journal of the weather during the days you are taking measurements with your barometer. How does the weather where you are correlate with your barometer readings? What is the connection between air pressure and weather?
This activity is from the Southeast Regional Climate Center. Check it out here!
Check out our full list of virtual and at-home polar learning resources
 Educators' Corner
The school year is fast approaching, and we're here to help all of you awesome educators with your school year planning! Each week throughout the summer, we'll use Educators' Corner to highlight MOSAiC and Arctic-related lessons, multimedia resources, and other educational materials that you can use in your NGSS (or similar) classroom, in person or remotely. Are you looking for a particular kind of educational resource? Let us know! Email us at mosaic@colorado.edu.
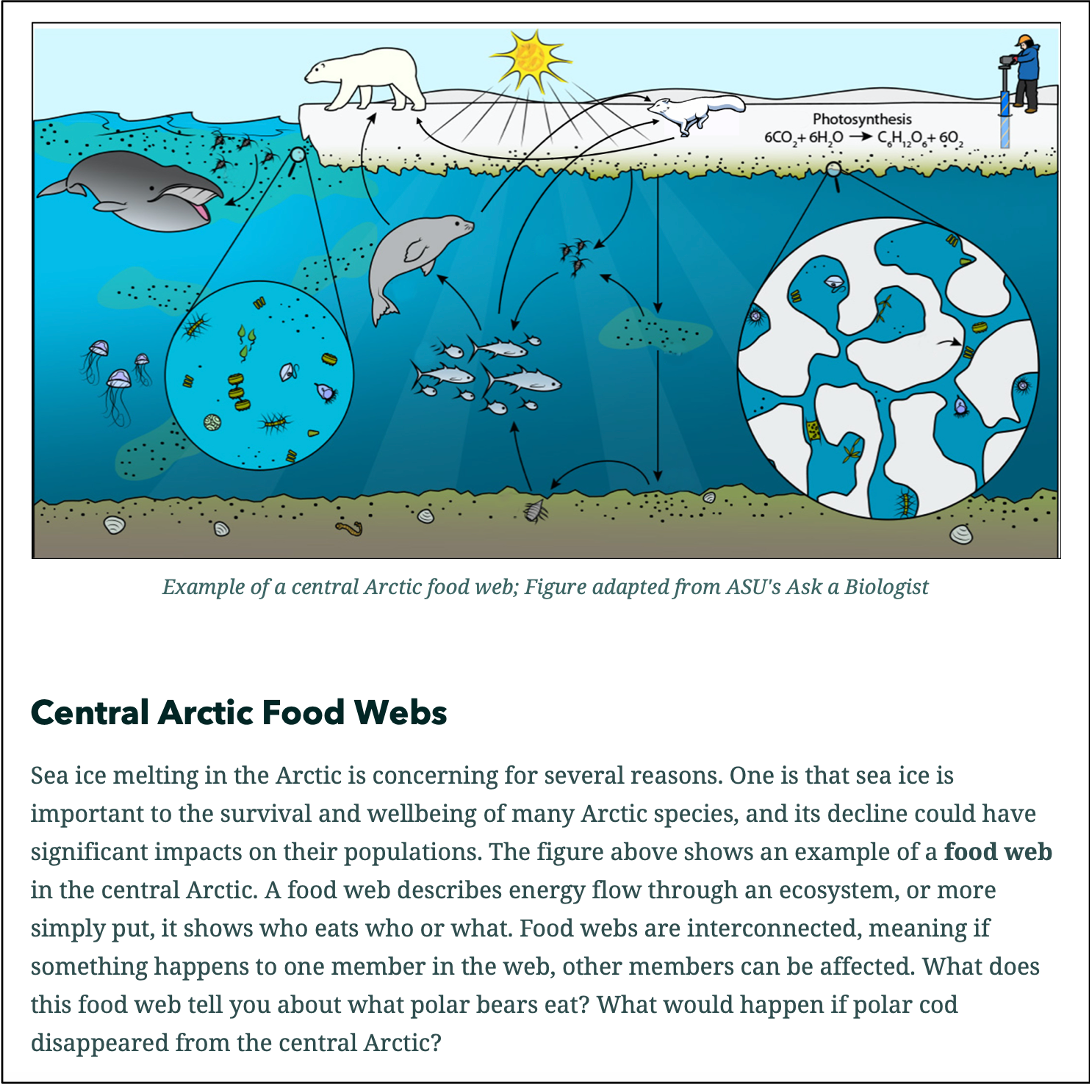
For Your Classroom: Life in the Central Arctic Immersive Story Map
The MOSAiC education and outreach team at CU Boulder will be creating a series of ArcGIS StoryMaps about and related to the MOSAiC expedition. We are excited to announce the release of our first StoryMap called Life in the Central Arctic, which tells the story of an Arctic food web that is based on wildlife sightings during MOSAiC and emphasizes the threats melting sea ice poses to Arctic ecosystems.
StoryMaps are visually-compelling resources that are perfect for virtual teaching and learning. Life in the Central Arctic is appropriate for middle school, high school, and adult audiences.
Go to the Life in the Central Arctic StoryMap
 MOSAiC Weekly Tracking
Plot the Polarstern
Each week we will provide you with the latitude and longitude coordinates of the Polarstern so that you can track its journey across the Arctic.
Download the map to plot coordinates
Download a larger map of the Arctic for a bigger picture view of the expedition area
Location of the Polarstern
| Date | Latitude | Longitude |
| September 16, 2019 | 69.68 N | 18.99 E |
| September 23, 2019 | 72.31 N | 26.93 E |
| September 30, 2019 | 85.12 N | 138.05 E |
| October 4, 2019** | 85.08 N | 134.43 E |
| October 7, 2019 | 85.10 N | 133.82 E |
| October 14, 2019 | 84.85 N | 135.03 E |
| October 21, 2019 | 84.97 N | 132.73 E |
| October 28, 2019 | 85.47 N | 127.07 E |
| November 4, 2019 | 85.88 N | 121.70 E |
| November 11, 2019 | 85.82 N | 116.00 E |
| November 18, 2019 | 86.05 N | 122.43 E |
| November 25, 2019 | 85.85 N | 121.35 E |
| December 2, 2019 | 85.97 N | 112.95 E |
| December 9, 2019 | 86.25 N | 121.40 E |
| December 16, 2019 | 86.62 N | 118.12 E |
| December 23, 2019 | 86.63 N | 113.20 E |
| December 30, 2019 | 86.58 N | 117.13 E |
| January 6, 2020 | 87.10 N | 115.10 E |
| January 13, 2020 | 87.35 N | 106.63 E |
| January 20, 2020 | 87.42 N | 97.77 E |
| January 27, 2020 | 87.43 N | 95.82 E |
| February 3, 2020 | 87.42 N | 93.65 E |
| February 10, 2020 | 87.78 N | 91.52 E |
| February 17, 2020 | 88.07 N | 78.52 E |
| February 24, 2020 | 88.58 N | 52.87 E |
| March 2, 2020 | 88.17 N | 31.02 E |
| March 9, 2020 | 87.93 N | 24.20 E |
| March 16, 2020 | 86.87 N | 12.70 E |
| March 23, 2020 | 86.20 N | 15.78 E |
| March 30, 2020 | 85.37 N | 13.27 E |
| April 6, 2020 | 84.52 N | 14.38 E |
| April 13, 2020 | 84.28 N | 14.97 E |
| April 20, 2020 | 84.52 N | 14.57 E |
| April 27, 2020 | 83.93 N | 15.65 E |
| May 4, 2020 | 83.92 N | 18.03 E |
| May 11, 2020 | 83.47 N | 13.08 E |
| May 18+, 2020 | 83.32 N | 8.68 E |
| May 25+, 2020 | 82.43 N | 8.28 E |
| June 1+, 2020 | 81.33 N | 9.93 E |
| June 8+, 2020 | 78.10 N | 12.73 E |
| June 15+, 2020 | 82.20 N | 8.18 E |
| June 22, 2020 | 81.95 N | 9.27 E |
| June 29, 2020 | 82.03 N | 9.88 E |
| July 6, 2020 | 81.67 N | 5.22 E |
| July 13, 2020 | 81.40 N | 0.28 E |
| July 20, 2020 | 80.78 N | 0.42 W |
| July 27, 2020 | 79.55 N | 2.37 W |
| August 3, 2020 | 78.60 N | 4.37 W |
**Day when MOSAiC reached the ice floe that the Polarstern will become frozen in and drift with for the next year.
+ Indicates when the Polarstern traveled under its own engine power (no drifting)
Log MOSAiC Data
Keep track of Arctic conditions over the course of the expedition:
Download Data Logbook for Sept. 2019 - Dec. 2019
Download Data Logbook for Dec. 2019 - Mar. 2020
Download Data Logbook for Mar. 2020 - June 2020
Download Data Logbook for July 2020 - Oct. 2020
| Date | Length of day (hrs) | Air temperature (deg C) at location of Polarstern | Arctic Sea Ice Extent (million km2) |
| September 16, 2019 | 13.25 | High: 10 Low: 4.4 | 3.9 |
| September 23, 2019 | 12.35 | High: 6 Low: -1 | 4.1 |
| September 30, 2019 | 9.1 | -4.7 | 4.4 |
| October 4, 2019** | 6.27 | -13.0 | 4.5 |
| October 7, 2019 | 3.05 | -8.2 | 4.6 |
| October 14, 2019 | 0 | -14.7 | 4.8 |
| October 21, 2019 | 0 | -12.8 | 5.4 |
| October 28, 2019 | 0 | -18.3 | 6.8 |
| November 4, 2019 | 0 | -18.9 | 8.0 |
| November 11, 2019 | 0 | -25.5 | 8.7 |
| November 18, 2019 | 0 | -10.7 | 9.3 |
| November 25, 2019 | 0 | -18.4 | 10.0 |
| December 2, 2019 | 0 | -26.6 | 10.4 |
| December 9, 2019 | 0 | -23.1 | 11.2 |
| December 16, 2019 | 0 | -19.2 | 11.8 |
| December 23, 2019 | 0 | -26.9 | 12.2 |
| December 30, 2019 | 0 | -26.4 | 12.6 |
| January 6, 2020 | 0 | -28.0 | 13.0 |
| January 13, 2020 | 0 | -30.7 | 13.1 |
| January 20, 2020 | 0 | -27.1 | 13.6 |
| January 27, 2020 | 0 | -22.5 | 13.8 |
| February 3, 2020 | 0 | -28.8 | 14.1 |
| February 10, 2020 | 0 | -26.2 | 14.5 |
| February 17, 2020 | 0 | -31.9 | 14.4 |
| February 24, 2020 | 0 | -24.0 | 14.6 |
| March 2, 2020 | 0 | -35.5 | 14.8 |
| March 9, 2020 | 0 | -37.9 | 14.7 |
| March 16, 2020 | 10.5 | -27.5 | 14.7 |
| March 23, 2020 | 16.5 | -28.7 | 14.4 |
| March 30, 2020 | 24 | -28.6 | 14.0 |
| April 6, 2020 | 24 | -18.2 | 13.7 |
| April 13, 2020 | 24 | -25.8 | 13.6 |
| April 20, 2020 | 24 | -10.2 | 13.3 |
| April 27, 2020 | 24 | -11.7 | 12.8 |
| May 4, 2020 | 24 | -16.2 | 12.8 |
| May 11, 2020 | 24 | -10.4 | 12.4 |
| May 18, 2020 | 24 | -5.1 | 11.7 |
| May 25, 2020 | 24 | 0.4 | 11.5 |
| June 1, 2020 | 24 | 0.0 | 11.1 |
| June 8+, 2020 | 24 | -0.1 | 10.6 |
| June 15+, 2020 | 24 | -0.4 | 10.1 |
| June 22, 2020 | 24 | -0.4 | 9.6 |
| June 29, 2020 | 24 | 0.5 | 9.2 |
| July 6, 2020 | 24 | 0.6 | 8.2 |
| July 13, 2020 | 24 | 0.2 | 7.2 |
| July 20, 2020 | 24 | -0.1 | 6.2 |
| July 27, 2020 | 24 | 1.9 | 5.8 |
| August 3, 2020 | 24 | 1.2 | 5.5 |
*Note: We expect data to fall within the following ranges: Length of day, 0-24 hours; Temperature, -40 to 14 degrees C; Sea ice extent, 3-15 million km2
**Day when MOSAiC reached the ice floe that the Polarstern will become frozen in and drift with for the next year.
Is there something you'd like to see in MOSAiC Monday? Let us know!
Send us your feedback
New to MOSAiC Monday? Check out past editions!
Browse more expedition-related educational resources, videos, and blogs
Email us! mosaic@colorado.edu