 For Educators: MOSAiC Webinar Series
Events:
Week 1 (9/2, 3:30-4:00 pm MT): Using virtual tools to engage with the MOSAiC expedition
Week 2 (9/9, 3:30-4:00 pm MT): Experience MOSAiC in virtual reality
Week 3 (9/16, 3:30-4:00 pm MT): Teaching with MOSAiC Media (videos, images, podcasts, and more!)
Week 4 (9/23, 3:30-4:00 pm MT): “Exploring the New and Old Arctic” curriculum (MS/HS unit)
Week 5 (9/30, 3:30-4:00 pm MT): “Arctic Feedbacks” curriculum (MS/HS unit)
Expedition Update
As of Thursday, August 27th, MOSAiC leg 5 scientists were ready to begin normal operations at the ice camps on the new floe. Met City has been reestablished to include many of the same systems that were set up during leg 4, although now it looks more like an archipelago, with instruments installed on snow and ice islands surrounded by melt ponds. Scientists report that they are observing the beginning of the refreeze season—the sun is getting lower on the horizon, and the ice surface is alternating between freezing and thawing. The transition between summer and winter and the disappearance of the sun above the horizon happens quickly in the Arctic, and this transition will bring MOSAiC full circle, back to where it started nearly one year ago.
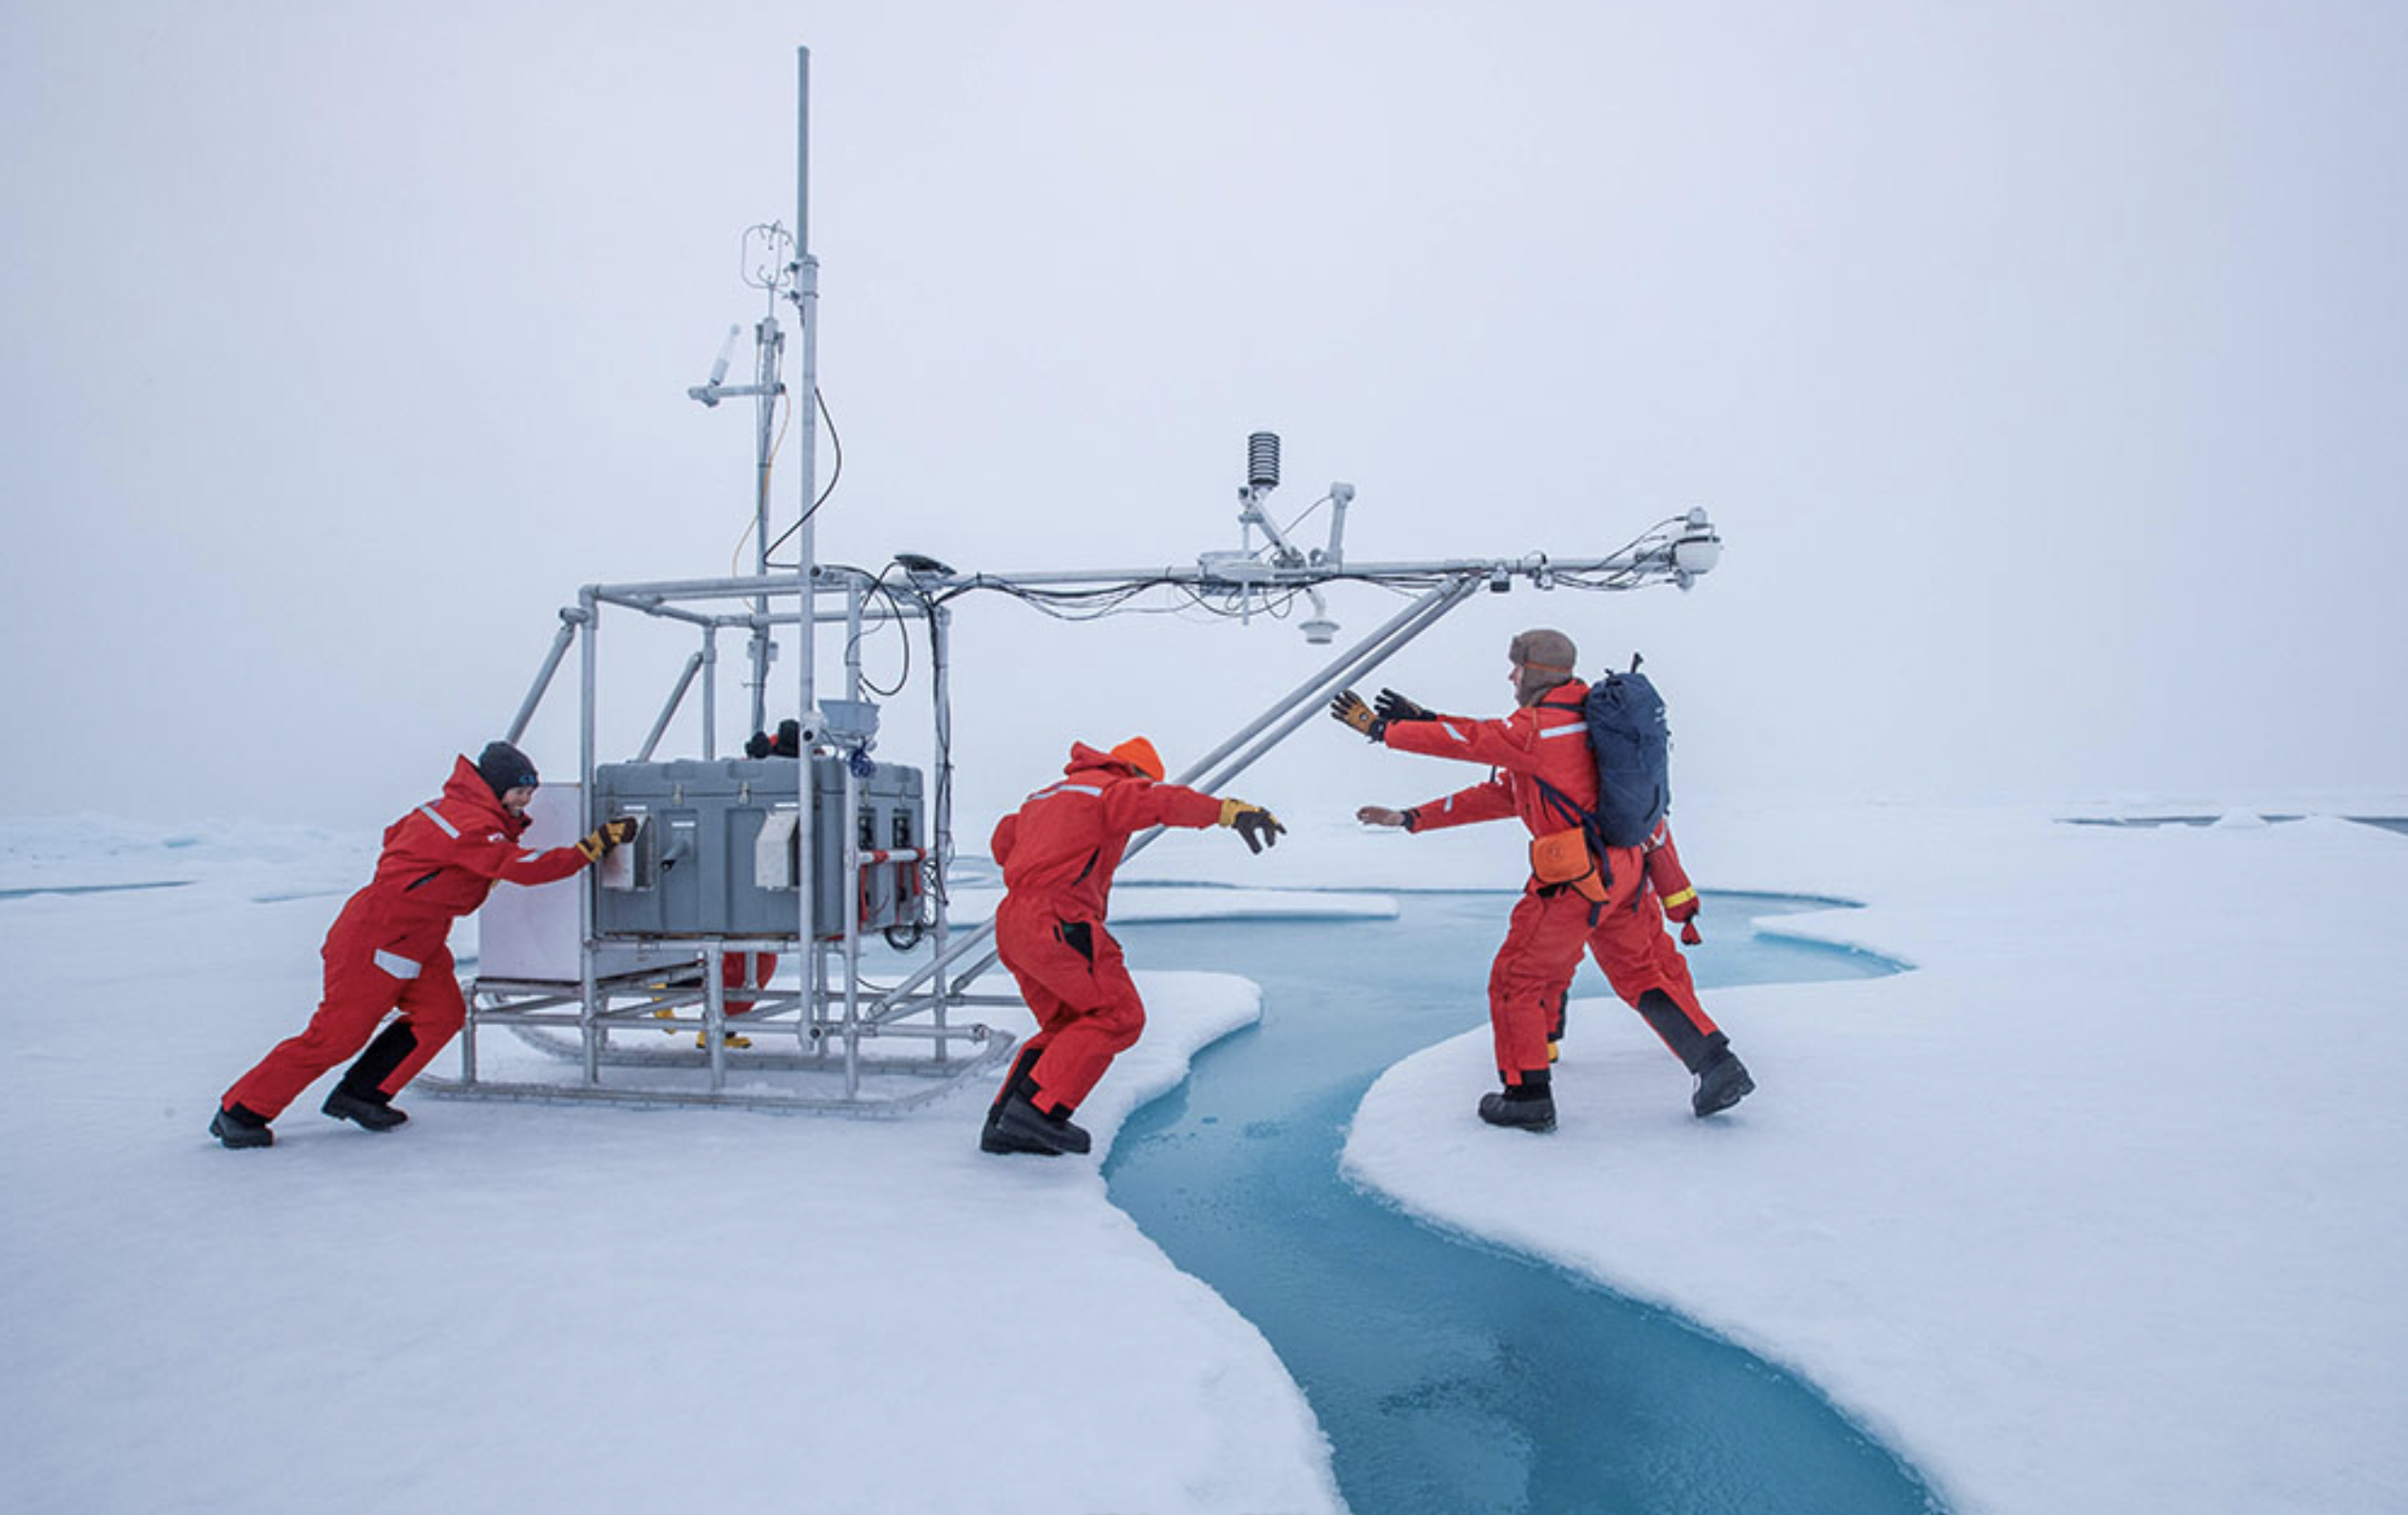
Photo: MOSAiC team members move the 'Met Sled' into position on the ice. The sled is equipped with a variety of instruments that measure things like atmospheric temperature, humidity, radiation, show depth, and GPS position. Photo credit: Lianna Nixon, CIRES/CU Boulder
 In the Classroom: MOSAiC Science Jigsaw
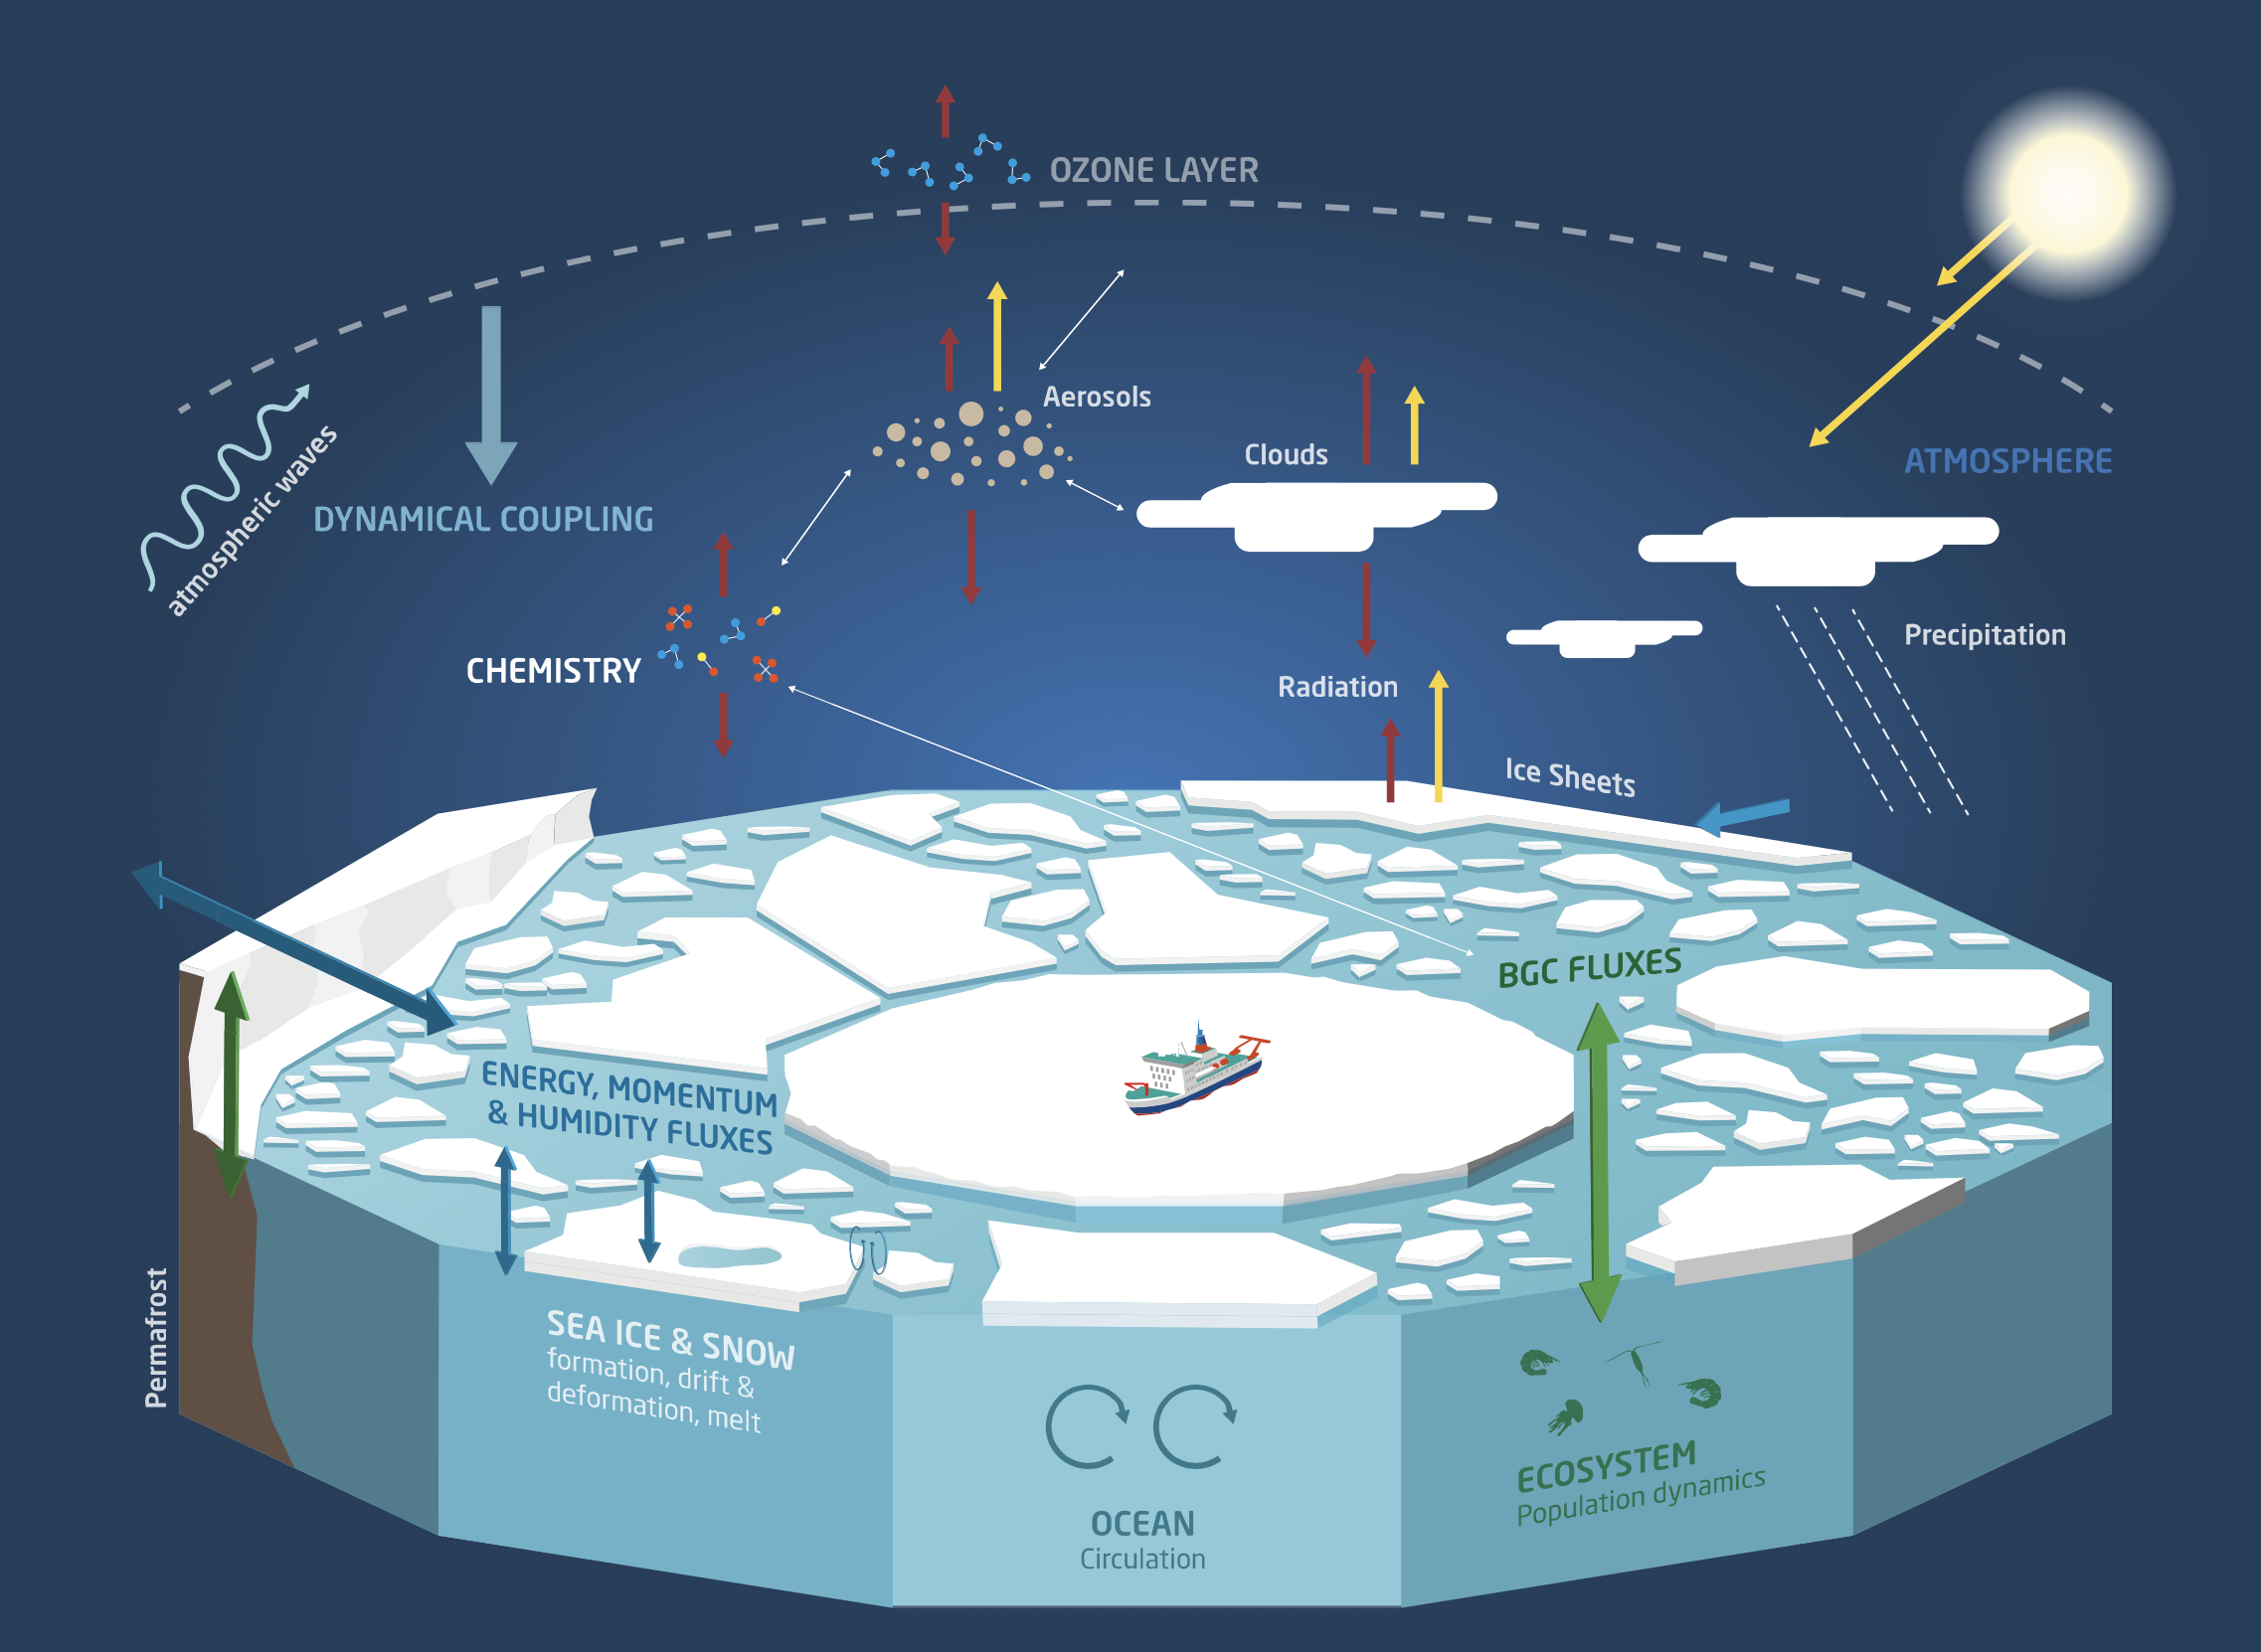
The Arctic atmosphere is just one of the MOSAiC science focus areas; MOSAiC scientists are also studying the sea ice, ocean, and Arctic ecosystems. The atmosphere, ocean, sea ice, and ecosystems are not separate, but rather are interconnected and part of a larger Arctic climate system.
1. Divide students into groups of 4. Each student will be responsible for reading about one of the four MOSAiC science focus areas mentioned above. Direct students to this website, which gives a brief summary of each. Note that there are other science focus areas listed, like Dynamic Coupling - you can include these if you have more advanced or older students.
2. Students should read about their science focus area, then summarize what they learn to their group. Ask students to pay attention to connections between their science focus area and others.
3. As a class, discuss how all of these science focus areas are connected. Encourage students to share connections they notice by using the prompt "I see a connection between [e.g., the Arctic Ocean] and [e.g., the sea ice]. The connection is [e.g., when the ocean gets warmer or colder, it can cause ice to melt or freeze]." If you like, you can also ask students to draw diagrams showing how the MOSAiC science focus areas are interconnected and part of a larger system.
Read about the MOSAiC Science Focus Areas
STEM professional development module: Teaching About Systems
![]()
![]()
Then and Now: MOSAiC vs. the Fram Expedition
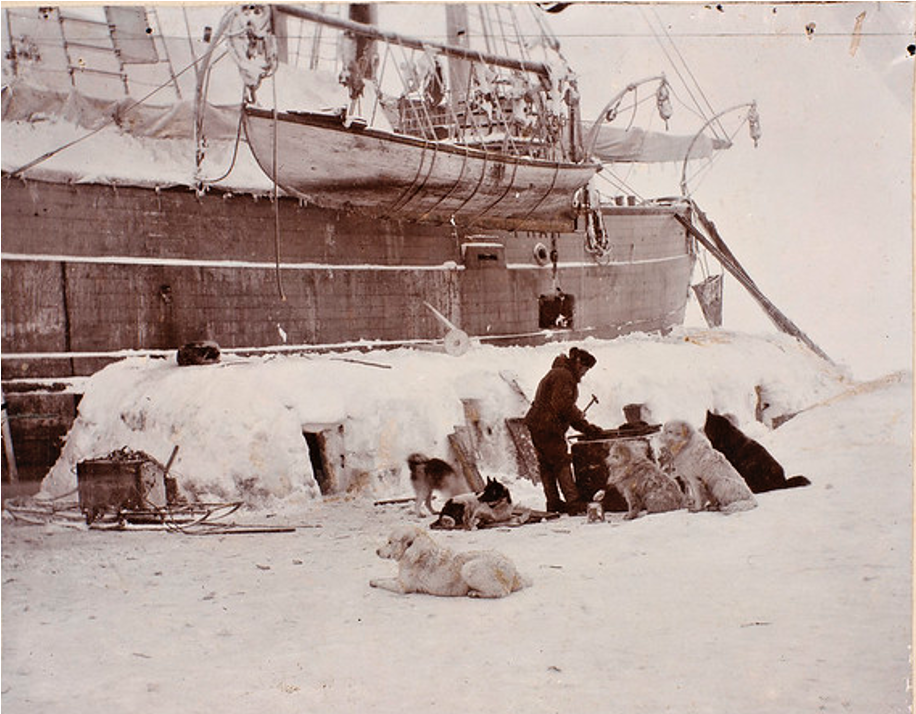
"Strange how little alteration there is: we drift a little to the north, then a little to the south, and keep almost to the same spot. But I believe, as I have believed all along, since before we even set out, that we should be away three years, or rather three winters and four summers, neither more nor less, and that in about two years' time from this present autumn we shall reach home. The approaching winter will drift us farther however slowly, and it begins already to announce itself, for there were four degrees of cold last night."
These words were not written by anyone on board the Polarstern, but rather by a Norwegian explorer, Fridtjof Nansen, almost exactly 126 years ago on August 21, 1894. Nansen and his crew became the first explorers to successfully freeze their ship, the Fram, in sea ice and drift across the Arctic. By this point in their journey, the crew of the Fram had been drifting for just over 10 months having become frozen in the ice pack on October 5th, 1893 just north of the Laptev Sea.
The Polarstern found its original ice floe on October 4th, 2019 about 435 miles north of where the Fram began its drift. In the same 10-month time period that the Fram drifted less than halfway across the Central Arctic, the Polarstern drifted almost all the way to the Fram Strait east of Greenland, made a quick detour to Svalbard for a crew exchange, then turned back north and arrived at the North Pole under its own engine power in a matter of days. It would take the Fram nearly 3 years to finally melt free from the Arctic ice.
Photo: The Fram frozen in the Arctic sea ice in August, 1894. Photo courtesy of the National Library of Norway
The MOSAiC expedition is following in the footsteps of the Fram, but the experiences of the two expeditions are vastly different. This isn't just because technology and ship design has advanced significantly in 126 years, but also because the Arctic itself has changed--temperatures have warmed, and Arctic sea ice is melting and becoming less extensive, making it easier to travel by ship across the once much more inhospitable northern ocean.
 #askmosaic: Arctic Air
This week's question was submitted by Eliana from Middleton Middle School: Is it hard to breathe in the Arctic?
"It's actually quite easy to breathe in the Arctic since the Arctic is at sea-level. Altitude plays a large role in how easy it is for us to breathe, for example, at high altitude there is a lack of oxygen, which can make it hard to breathe. In the Arctic, we are at sea-level, so it can actually be much easier to breath there."
-Sara Morris, NOAA, MOSAiC Logistics Coordinator Extraordinaire
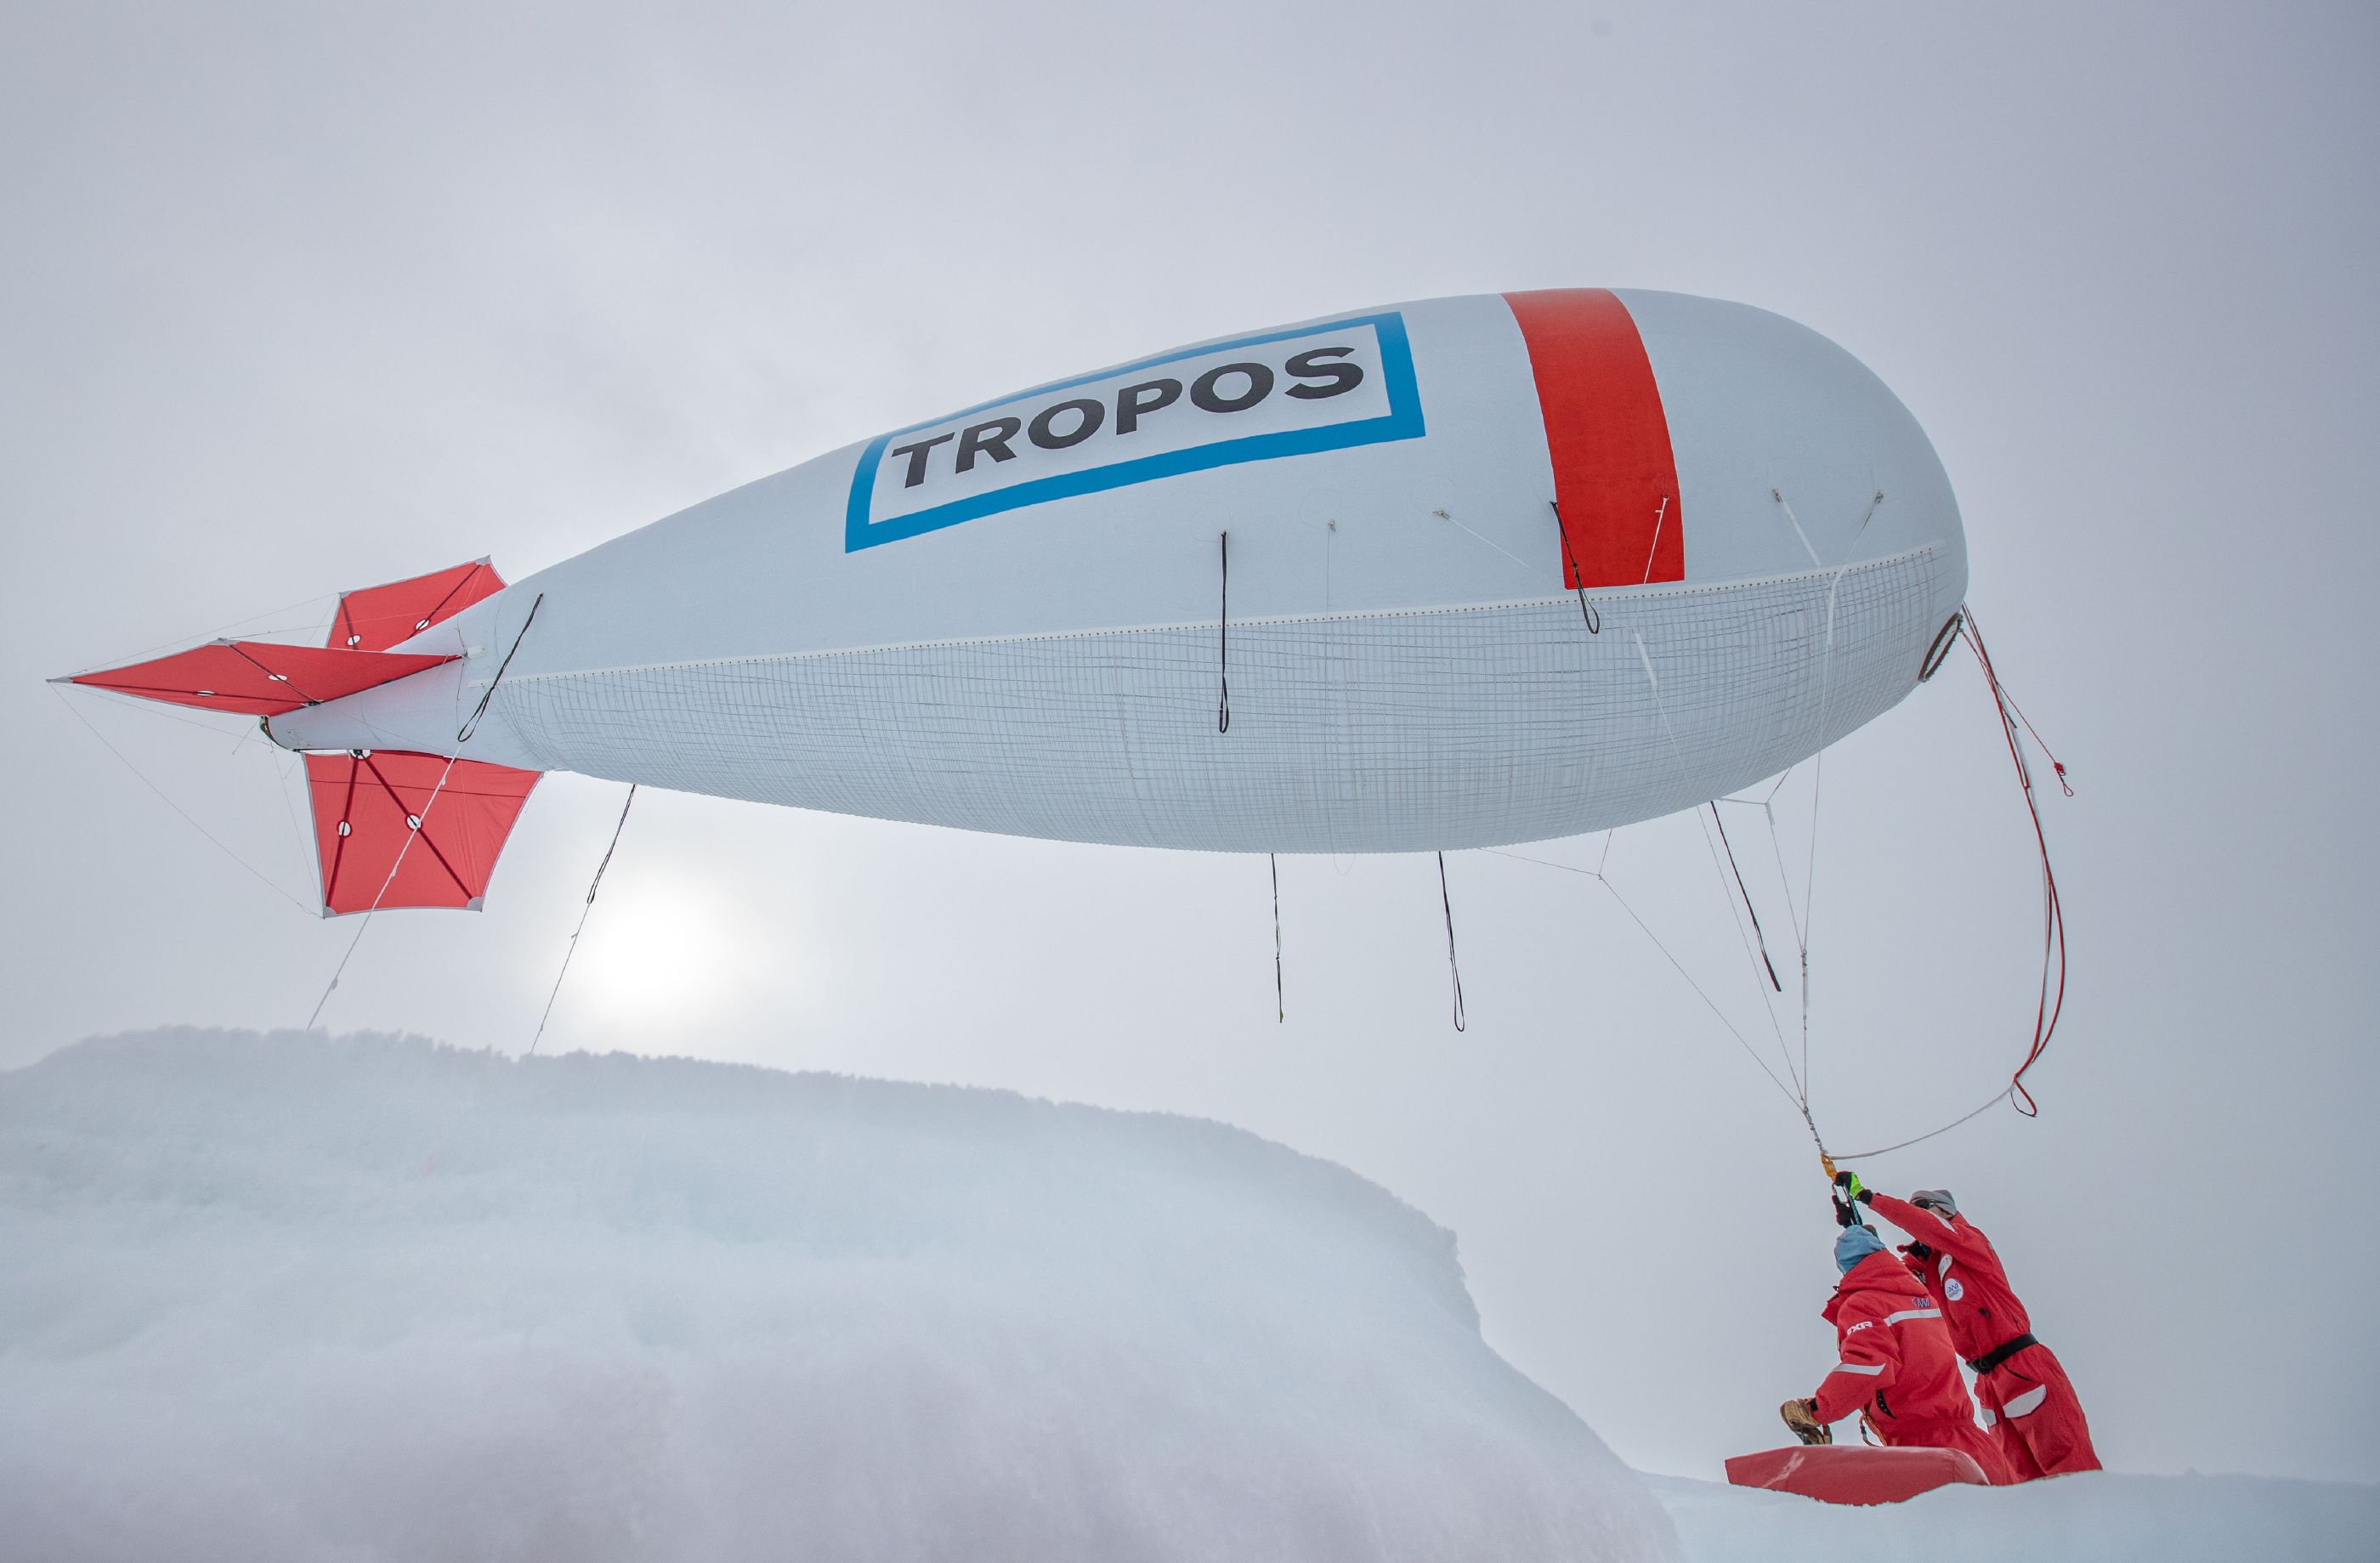
Photo: The MOSAiC Atmosphere team operates the largest balloon on the MOSAiC project. The tethered balloon known as Beluga, flies up to 1000 m and measures atmospheric properties above the floe. Photo credit: Lianna Nixon, CIRES/CU Boulder
Curious about the Arctic and MOSAiC expedition? Here are three ways you can send us your #askmosaic questions:
1. Submit them
2. Email them: mosaic@colorado.edu with subject line "#askmosaic"
3. Tag us on social media: #askmosaic
 MOSAiC Weekly Tracking
Plot the Polarstern
Each week we will provide you with the latitude and longitude coordinates of the Polarstern so that you can track its journey across the Arctic.
Download the map to plot coordinates
Download a larger map of the Arctic for a bigger picture view of the expedition area
Location of the Polarstern
| Date | Latitude | Longitude |
| September 16, 2019 | 69.68 N | 18.99 E |
| September 23, 2019 | 72.31 N | 26.93 E |
| September 30, 2019 | 85.12 N | 138.05 E |
| October 4, 2019** | 85.08 N | 134.43 E |
| October 7, 2019 | 85.10 N | 133.82 E |
| October 14, 2019 | 84.85 N | 135.03 E |
| October 21, 2019 | 84.97 N | 132.73 E |
| October 28, 2019 | 85.47 N | 127.07 E |
| November 4, 2019 | 85.88 N | 121.70 E |
| November 11, 2019 | 85.82 N | 116.00 E |
| November 18, 2019 | 86.05 N | 122.43 E |
| November 25, 2019 | 85.85 N | 121.35 E |
| December 2, 2019 | 85.97 N | 112.95 E |
| December 9, 2019 | 86.25 N | 121.40 E |
| December 16, 2019 | 86.62 N | 118.12 E |
| December 23, 2019 | 86.63 N | 113.20 E |
| December 30, 2019 | 86.58 N | 117.13 E |
| January 6, 2020 | 87.10 N | 115.10 E |
| January 13, 2020 | 87.35 N | 106.63 E |
| January 20, 2020 | 87.42 N | 97.77 E |
| January 27, 2020 | 87.43 N | 95.82 E |
| February 3, 2020 | 87.42 N | 93.65 E |
| February 10, 2020 | 87.78 N | 91.52 E |
| February 17, 2020 | 88.07 N | 78.52 E |
| February 24, 2020 | 88.58 N | 52.87 E |
| March 2, 2020 | 88.17 N | 31.02 E |
| March 9, 2020 | 87.93 N | 24.20 E |
| March 16, 2020 | 86.87 N | 12.70 E |
| March 23, 2020 | 86.20 N | 15.78 E |
| March 30, 2020 | 85.37 N | 13.27 E |
| April 6, 2020 | 84.52 N | 14.38 E |
| April 13, 2020 | 84.28 N | 14.97 E |
| April 20, 2020 | 84.52 N | 14.57 E |
| April 27, 2020 | 83.93 N | 15.65 E |
| May 4, 2020 | 83.92 N | 18.03 E |
| May 11, 2020 | 83.47 N | 13.08 E |
| May 18+, 2020 | 83.32 N | 8.68 E |
| May 25+, 2020 | 82.43 N | 8.28 E |
| June 1+, 2020 | 81.33 N | 9.93 E |
| June 8+, 2020 | 78.10 N | 12.73 E |
| June 15+, 2020 | 82.20 N | 8.18 E |
| June 22, 2020 | 81.95 N | 9.27 E |
| June 29, 2020 | 82.03 N | 9.88 E |
| July 6, 2020 | 81.67 N | 5.22 E |
| July 13, 2020 | 81.40 N | 0.28 E |
| July 20, 2020 | 80.78 N | 0.42 W |
| July 27, 2020 | 79.55 N | 2.37 W |
| August 3, 2020 | 78.60 N | 4.37 W |
| August 10, 2020 | 79.90 N | 5.52 W |
| August 17+, 2020 | 88.28 N | 34.63 W |
| August 24, 2020 | 87.77 N | 105.67 E |
| August 31, 2020 | 88.30 N | 114.23 E |
**Day when MOSAiC reached the ice floe that the Polarstern will become frozen in and drift with for the next year.
+ Indicates when the Polarstern traveled under its own engine power (no drifting)
Log MOSAiC Data
Keep track of Arctic conditions over the course of the expedition:
**Note to students: If you are trying to access these documents in Google Drive and are unable to, it is likely because your school has blocked access. Try using a personal account to access them, or contact your teacher.
Download Data Logbook for Sept. 2019 - Dec. 2019
Download Data Logbook for Dec. 2019 - Mar. 2020
Download Data Logbook for Mar. 2020 - June 2020
Download Data Logbook for July 2020 - Oct. 2020
| Date | Length of day (hrs) | Air temperature (deg C) at location of Polarstern | Arctic Sea Ice Extent (million km2) |
| September 16, 2019 | 13.25 | High: 10 Low: 4.4 | 3.9 |
| September 23, 2019 | 12.35 | High: 6 Low: -1 | 4.1 |
| September 30, 2019 | 9.1 | -4.7 | 4.4 |
| October 4, 2019** | 6.27 | -13.0 | 4.5 |
| October 7, 2019 | 3.05 | -8.2 | 4.6 |
| October 14, 2019 | 0 | -14.7 | 4.8 |
| October 21, 2019 | 0 | -12.8 | 5.4 |
| October 28, 2019 | 0 | -18.3 | 6.8 |
| November 4, 2019 | 0 | -18.9 | 8.0 |
| November 11, 2019 | 0 | -25.5 | 8.7 |
| November 18, 2019 | 0 | -10.7 | 9.3 |
| November 25, 2019 | 0 | -18.4 | 10.0 |
| December 2, 2019 | 0 | -26.6 | 10.4 |
| December 9, 2019 | 0 | -23.1 | 11.2 |
| December 16, 2019 | 0 | -19.2 | 11.8 |
| December 23, 2019 | 0 | -26.9 | 12.2 |
| December 30, 2019 | 0 | -26.4 | 12.6 |
| January 6, 2020 | 0 | -28.0 | 13.0 |
| January 13, 2020 | 0 | -30.7 | 13.1 |
| January 20, 2020 | 0 | -27.1 | 13.6 |
| January 27, 2020 | 0 | -22.5 | 13.8 |
| February 3, 2020 | 0 | -28.8 | 14.1 |
| February 10, 2020 | 0 | -26.2 | 14.5 |
| February 17, 2020 | 0 | -31.9 | 14.4 |
| February 24, 2020 | 0 | -24.0 | 14.6 |
| March 2, 2020 | 0 | -35.5 | 14.8 |
| March 9, 2020 | 0 | -37.9 | 14.7 |
| March 16, 2020 | 10.5 | -27.5 | 14.7 |
| March 23, 2020 | 16.5 | -28.7 | 14.4 |
| March 30, 2020 | 24 | -28.6 | 14.0 |
| April 6, 2020 | 24 | -18.2 | 13.7 |
| April 13, 2020 | 24 | -25.8 | 13.6 |
| April 20, 2020 | 24 | -10.2 | 13.3 |
| April 27, 2020 | 24 | -11.7 | 12.8 |
| May 4, 2020 | 24 | -16.2 | 12.8 |
| May 11, 2020 | 24 | -10.4 | 12.4 |
| May 18, 2020 | 24 | -5.1 | 11.7 |
| May 25, 2020 | 24 | 0.4 | 11.5 |
| June 1, 2020 | 24 | 0.0 | 11.1 |
| June 8+, 2020 | 24 | -0.1 | 10.6 |
| June 15+, 2020 | 24 | -0.4 | 10.1 |
| June 22, 2020 | 24 | -0.4 | 9.6 |
| June 29, 2020 | 24 | 0.5 | 9.2 |
| July 6, 2020 | 24 | 0.6 | 8.2 |
| July 13, 2020 | 24 | 0.2 | 7.2 |
| July 20, 2020 | 24 | -0.1 | 6.2 |
| July 27, 2020 | 24 | 1.9 | 5.8 |
| August 3, 2020 | 24 | 1.2 | 5.5 |
| August 10, 2020 | 24 | 0.9 | 5.1 |
| August 17, 2020 | 24 | 0.7 | 4.6 |
| August 24, 2020 | 24 | -0.9 | 3.9 |
| August 31, 2020 | 24 | -0.9 | 3.7 |
*Note: We expect data to fall within the following ranges: Length of day, 0-24 hours; Temperature, -40 to 14 degrees C; Sea ice extent, 3-15 million km2
**Day when MOSAiC reached the ice floe that the Polarstern will become frozen in and drift with for the next year.
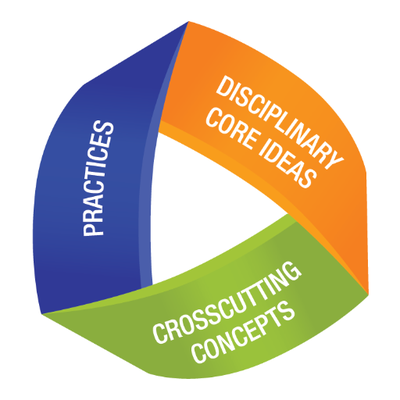 MOSAiC Monday and the NGSS
What do those funny symbols below some engagements mean?
Good news for educators in the U.S. teaching with the Next Generation Science Standards (NGSS) or similar! We will now be tagging MOSAiC Monday engagements with the NGSS Disciplinary Core Idea subject(s), Science and Engineering Practice(s), and Crosscutting Concept(s) that they most closely connect to. Look for these symbols listed below each engagement:
Disciplinary Core Idea Subjects
Science and Engineering Practices (adopted from the San Diego County Office of Education Science Resource Center)
Crosscutting Concepts (adopted from the San Diego County Office of Education Science Resource Center)
Is there something you'd like to see in MOSAiC Monday? Let us know!
Send us your feedback
New to MOSAiC Monday? Check out past editions!
Browse more expedition-related educational resources, videos, and blogs
Email us! mosaic@colorado.edu