Dranitsyn, meet Polarstern
Coming Soon: MOSAiC Leg II
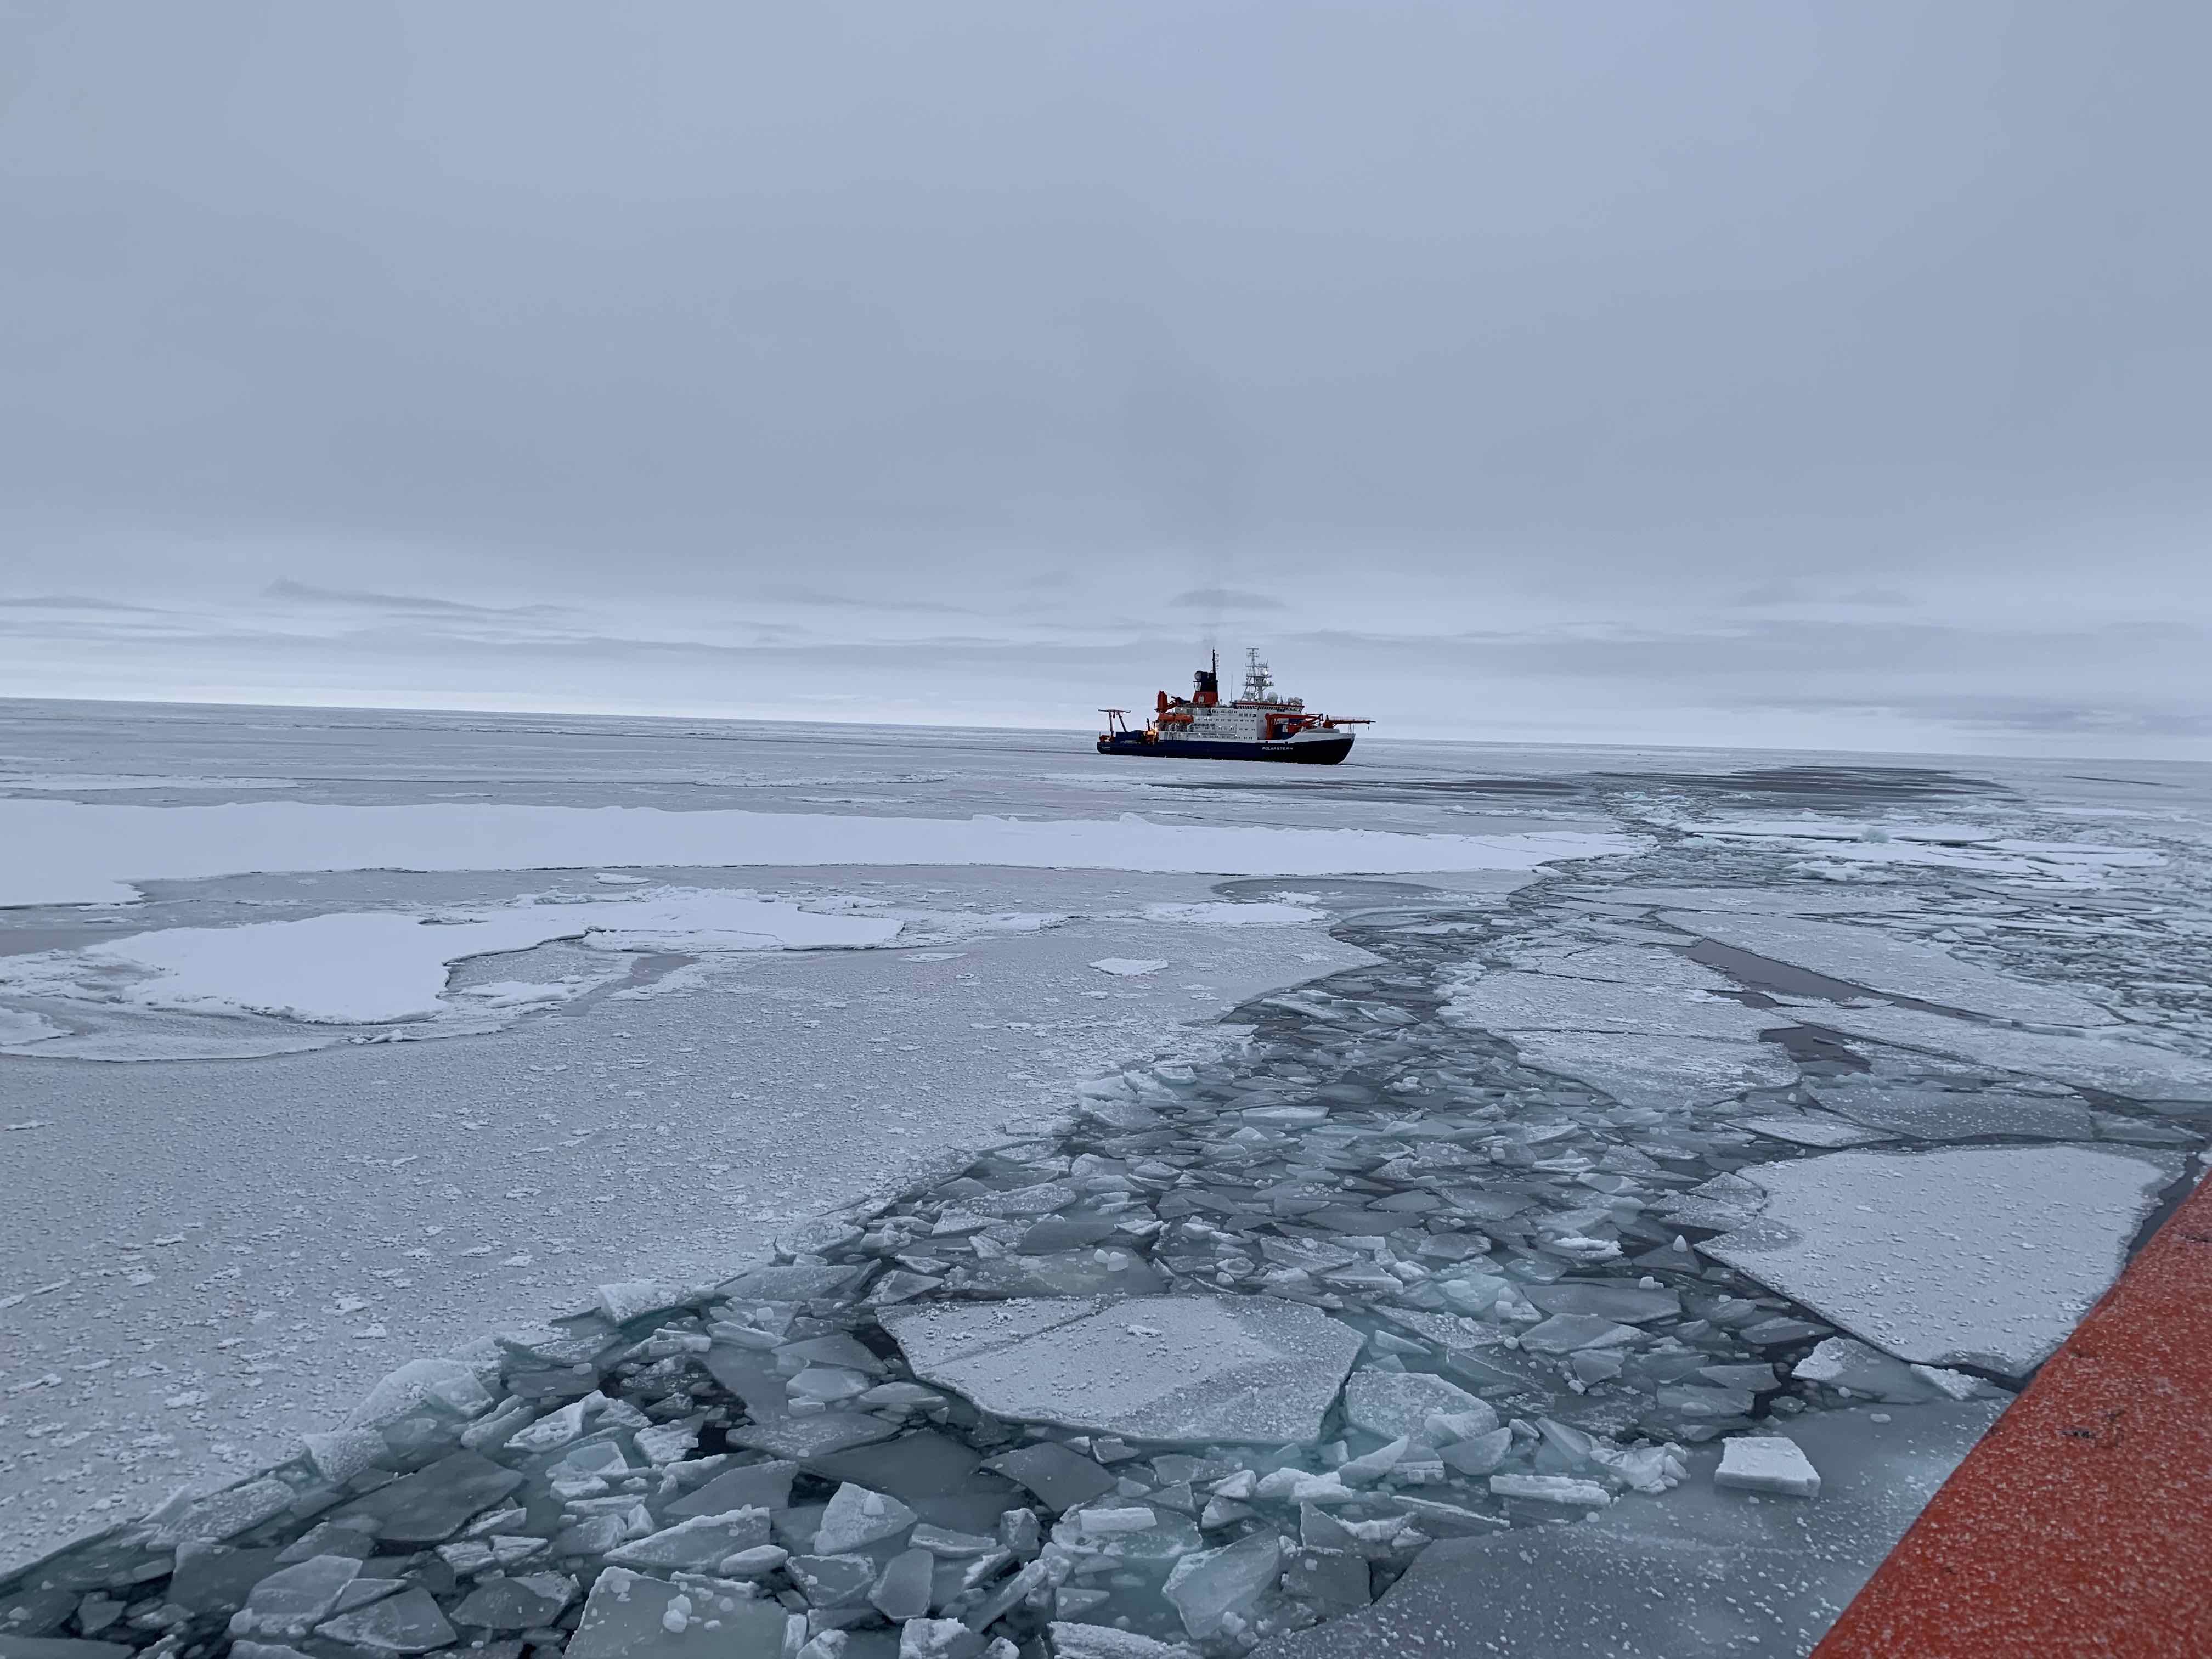
The second leg of the MOSAiC expedition is about to begin. The Russian support icebreaker Kapitan Dranitsyn is heading towards the Polarstern where it will exchange expedition personnel and restock the Polarstern with food, fuel, and other supplies. The Dranitsyn was a bit delayed departing Tromsö, Norway due to a severe storm that brought 40 m/s (almost 90 mph) winds and swells as large as 29 meters (95 ft) in the open ocean! Photo credit: M. Gallagher
 Track the Dranitsyn
Meet the MOSAiC Leg II participants
 #askmosaic: Changes in the Ice
This week's question was submitted by Mrs. Jurcsek's 5th grade class:
Have you seen changes in the ice since you've been there? What kind if you did?
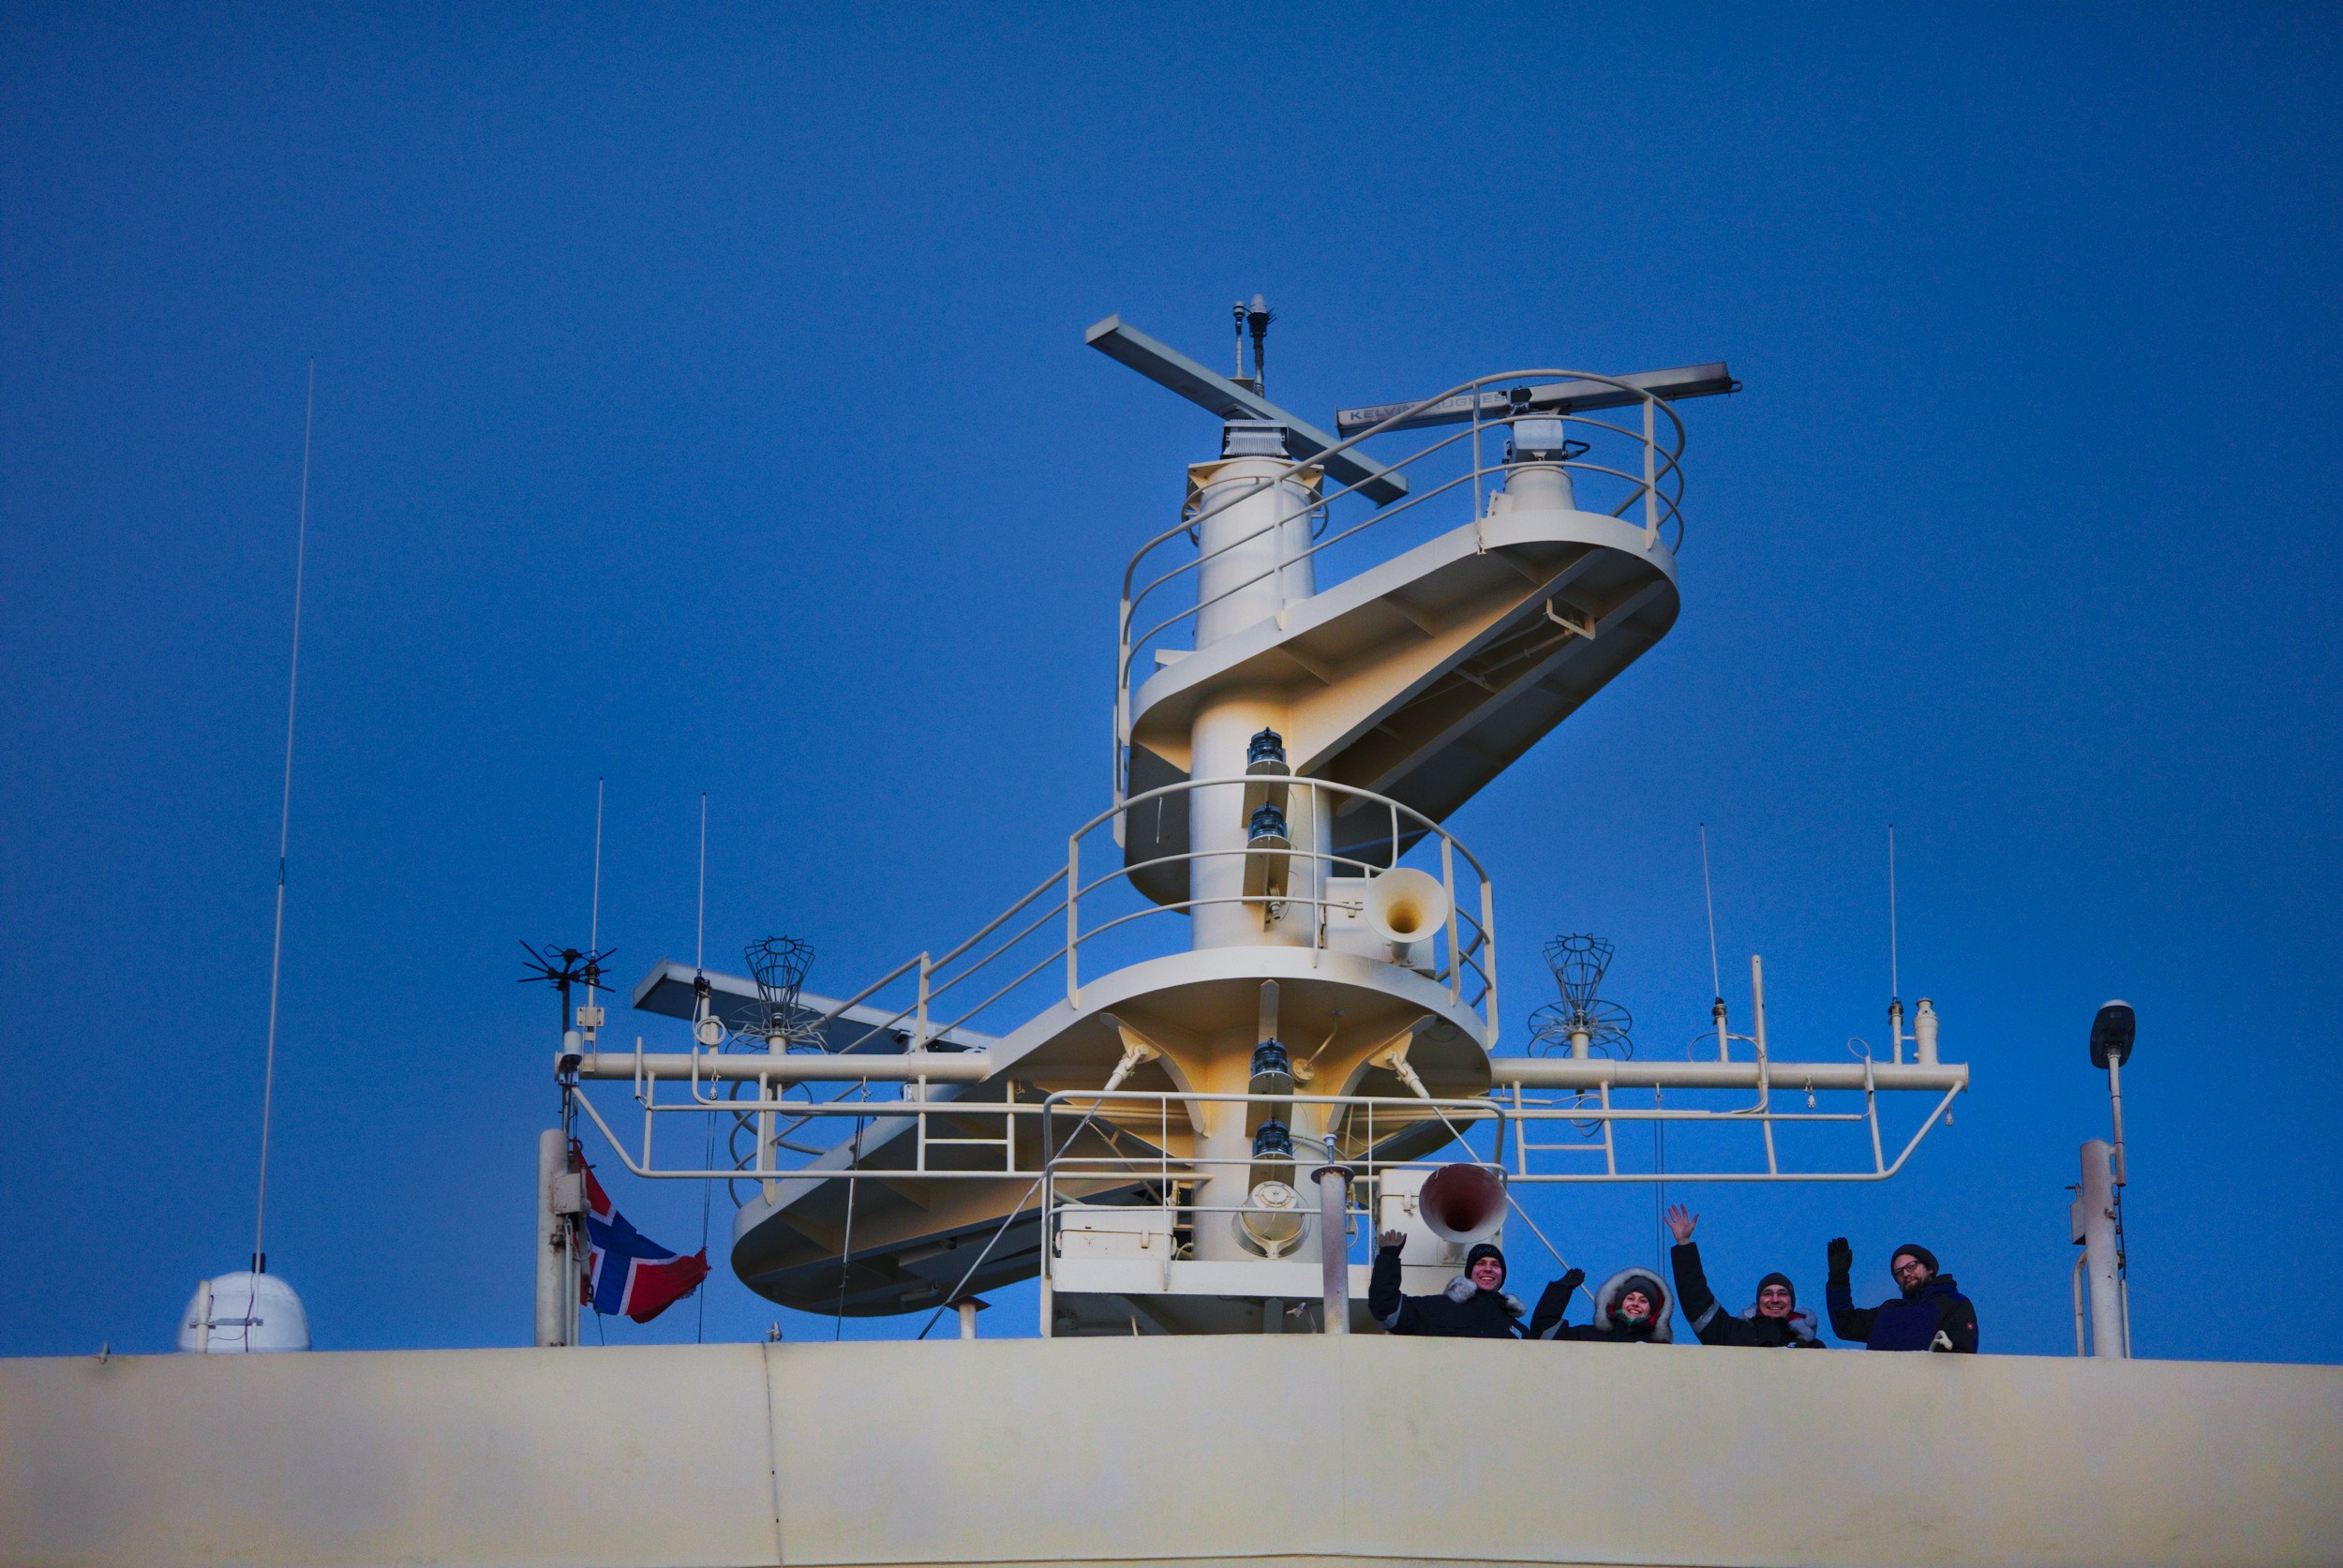
"The ice is constantly changing and, if not the ice, at least the snow on top of the ice is changing the landscape from day to day. But we observe different kinds of changes: When we arrived, some 7 weeks ago, large factions of our ice floe were only 30-40 cm (~12-16 in) thick. This ice has now grown to some 80 cm (~31.5 in)! This continuous growth is because of the ocean freezing.
The more obvious and abrupt changes are dynamic changes in the ice. Winds and ocean tides keep the ice moving all the time. As a consequence, the ice cracks at one place and leaves open water, and piles up in other places and builds so called 'pressure ridges.' The floe has broken into many sub-floes. All of the ridges catch a lot of snow that is blown around by the wind...the surface is a little different every day, but looking back in time changes appear dramatic." Photo: View of the Polarstern from the Fedorov; Photo credit: Anne Gold
-Dr. Marcel Nicolaus, Sea Ice Physicist at the Alfred Wegener Institute and a member of the MOSAIC Sea Ice Team. Dr. Nicolaus is currently on board the Polarstern.
Learn All About Sea Ice from the National Snow and Ice Data Center
Submit your questions!
 What's Afloat? Exploring MOSAiC Buoy Data
In October, researchers on the MOSAiC expedition deployed three SIMB buoys through the frigid Arctic sea ice. SIMB stands for Seasonal Ice Mass Balance, and the SIMB buoys will collect data like air pressure, air temperature, ice thickness, and more during the MOSAiC expedition. Like the Polarstern, the SIMB buoys will drift along with the sea ice.
Buoys in the ocean come in all different shapes, sizes, and kinds. Most float on top of or within the water and either drift with the currents or are anchored in one place. Different buoys are equipped with different kinds of instruments to measure different things.
How do you deploy a buoy in the Arctic?
One MOSAiC researcher filmed herself and her colleagues deploying a MOSAiC SIMB buoy in the sea ice so that you can see the entire process firsthand from start to finish! Video produced by Ph.D. student and MOSAiC School participant Ryleigh Moore.
MOSAiC Expedition: SIMB3 Buoy Installation Video by Ryleigh Moore from APECS Webinars on Vimeo.
 Buoy Structure and Function
Have your students watch the video above and look at a picture and diagram of a SIMB buoy. As a class, brainstorm and discuss how the structure and design of the buoy relates to its function, i.e., the data it is supposed to collect. What special considerations do you think have to be taken into account when designing a buoy for harsh Arctic conditions versus other places on the globe?
![]()
![]()
![]()
 Quick Bite: Analyzing MOSAiC Buoy Data
What, if anything, does the data that has come in from the buoy tell us? Check out the data that has already come in from the MOSAiC SIMB buoys. Click on Current Report to see where the buoy is and the most recent data it transmitted. Click on Time Series to see various time series plots of the different kinds of data the buoy is collecting. What do you notice? What kinds of data is the buoy collecting? Do you notice any patterns in the data? Why do you think MOSAiC scientists are interested in these kinds of data?
![]()
![]()
![]()
 MOSAiC Weekly Tracking
Plot the Polarstern
Each week we will provide you with the latitude and longitude coordinates of the Polarstern so that your students can track its journey across the Arctic in your classroom.
Download the map to plot coordinates
Download a larger map of the Arctic for a bigger picture view of the expedition area
Location of the Polarstern
| Date | Latitude | Longitude |
| September 16, 2019 | 69.68 N | 18.99 E |
| September 23, 2019 | 72.31 N | 26.93 E |
| September 30, 2019 | 85.12 N | 138.05 E |
| October 4, 2019** | 85.08 N | 134.43 E |
| October 7, 2019 | 85.10 N | 133.82 E |
| October 14, 2019 | 84.85 N | 135.03 E |
| October 21, 2019 | 84.97 N | 132.73 E |
| October 28, 2019 | 85.47 N | 127.07 E |
| November 4, 2019 | 85.88 N | 121.70 E |
| November 11, 2019 | 85.82 N | 116.00 E |
| November 18, 2019 | 86.05 N | 122.43 E |
| November 25, 2019 | 85.85 N | 121.35 E |
| December 2, 2019 | 85.97 N | 112.95 E |
| December 9, 2019 | 86.25 N | 121.40 E |
**Day when MOSAiC reached the ice floe that the Polarstern will become frozen in and drift with for the next year.
Log MOSAiC Data
Download a MOSAiC Data Logbook to keep track of Arctic conditions over the course of the expedition
Arctic Data* - NOTE: Length of day numbers have been updated based on more accurate models!
| Date | Length of day (hrs) | Air temperature (deg C) at location of Polarstern | Arctic Sea Ice Extent (million km2) |
| September 16, 2019 | 13.25 | High: 10 Low: 4.4 | 3.9 |
| September 23, 2019 | 12.35 | High: 6 Low: -1 | 4.1 |
| September 30, 2019 | 9.1 | -4.7 | 4.4 |
| October 4, 2019** | 6.27 | -13.0 | 4.5 |
| October 7, 2019 | 3.05 | -8.2 | 4.6 |
| October 14, 2019 | 0 | -14.7 | 4.8 |
| October 21, 2019 | 0 | -12.8 | 5.4 |
| October 28, 2019 | 0 | -18.3 | 6.8 |
| November 4, 2019 | 0 | -18.9 | 8.0 |
| November 11, 2019 | 0 | -25.5 | 8.7 |
| November 18, 2019 | 0 | -10.7 | 9.3 |
| November 25, 2019 | 0 | -18.4 | 10.0 |
| December 2, 2019 | 0 | -26.6 | 10.4 |
| December 9, 2019 | 0 | -23.1 | 11.2 |
*Note: We expect data to fall within the following ranges: Length of day, 0-24 hours; Temperature, -40 to 14 degrees C; Sea ice extent, 3-15 million km2
**Day when MOSAiC reached the ice floe that the Polarstern will become frozen in and drift with for the next year.
 MOSAiC Ambassadors' Corner
Lectures, videos, podcasts and workshops: during the upcoming year, follow the MOSAiC School outreach activities with the MOSAiC Ambassadors' Corner.
This month, discover two amazing videos from our Ambassadors:
- Rosalie McKay's clip "The MOSAiC School in 52 seconds" will give you a sneak peek of these fascinating 6 weeks in the Arctic as a MOSAiC School student.
- Find out about the highlights of the MOSAiC Leg 1a onboard the RV Akademik Fedorov, with a short and inspiring movie from Anika Happe.
Stay tuned for monthly updates!
 MOSAiC Monday and the NGSS
What do those funny symbols below some engagements mean?
Good news for educators in the U.S. teaching with the Next Generation Science Standards (NGSS) or similar! We will now be tagging MOSAiC Monday engagements with the NGSS Disciplinary Core Idea subject(s), Science and Engineering Practice(s), and Crosscutting Concept(s) that they most closely connect to. Look for these symbols listed below each engagement:
Disciplinary Core Idea Subjects
Science and Engineering Practices (adopted from the San Diego County Office of Education Science Resource Center)
Crosscutting Concepts (adopted from the San Diego County Office of Education Science Resource Center)
Is there something you'd like to see in MOSAiC Monday? Let us know!
Send us your feedback
New to MOSAiC Monday? Check out past editions!
Browse more expedition-related educational resources, videos, and blogs