Albedo, Albeda, Life Goes On
(but is impacted by the physical properties of our planet's surface)
Earth's Energy Budget: Part 2
(Check out last week's MOSAiC Monday for Part 1)
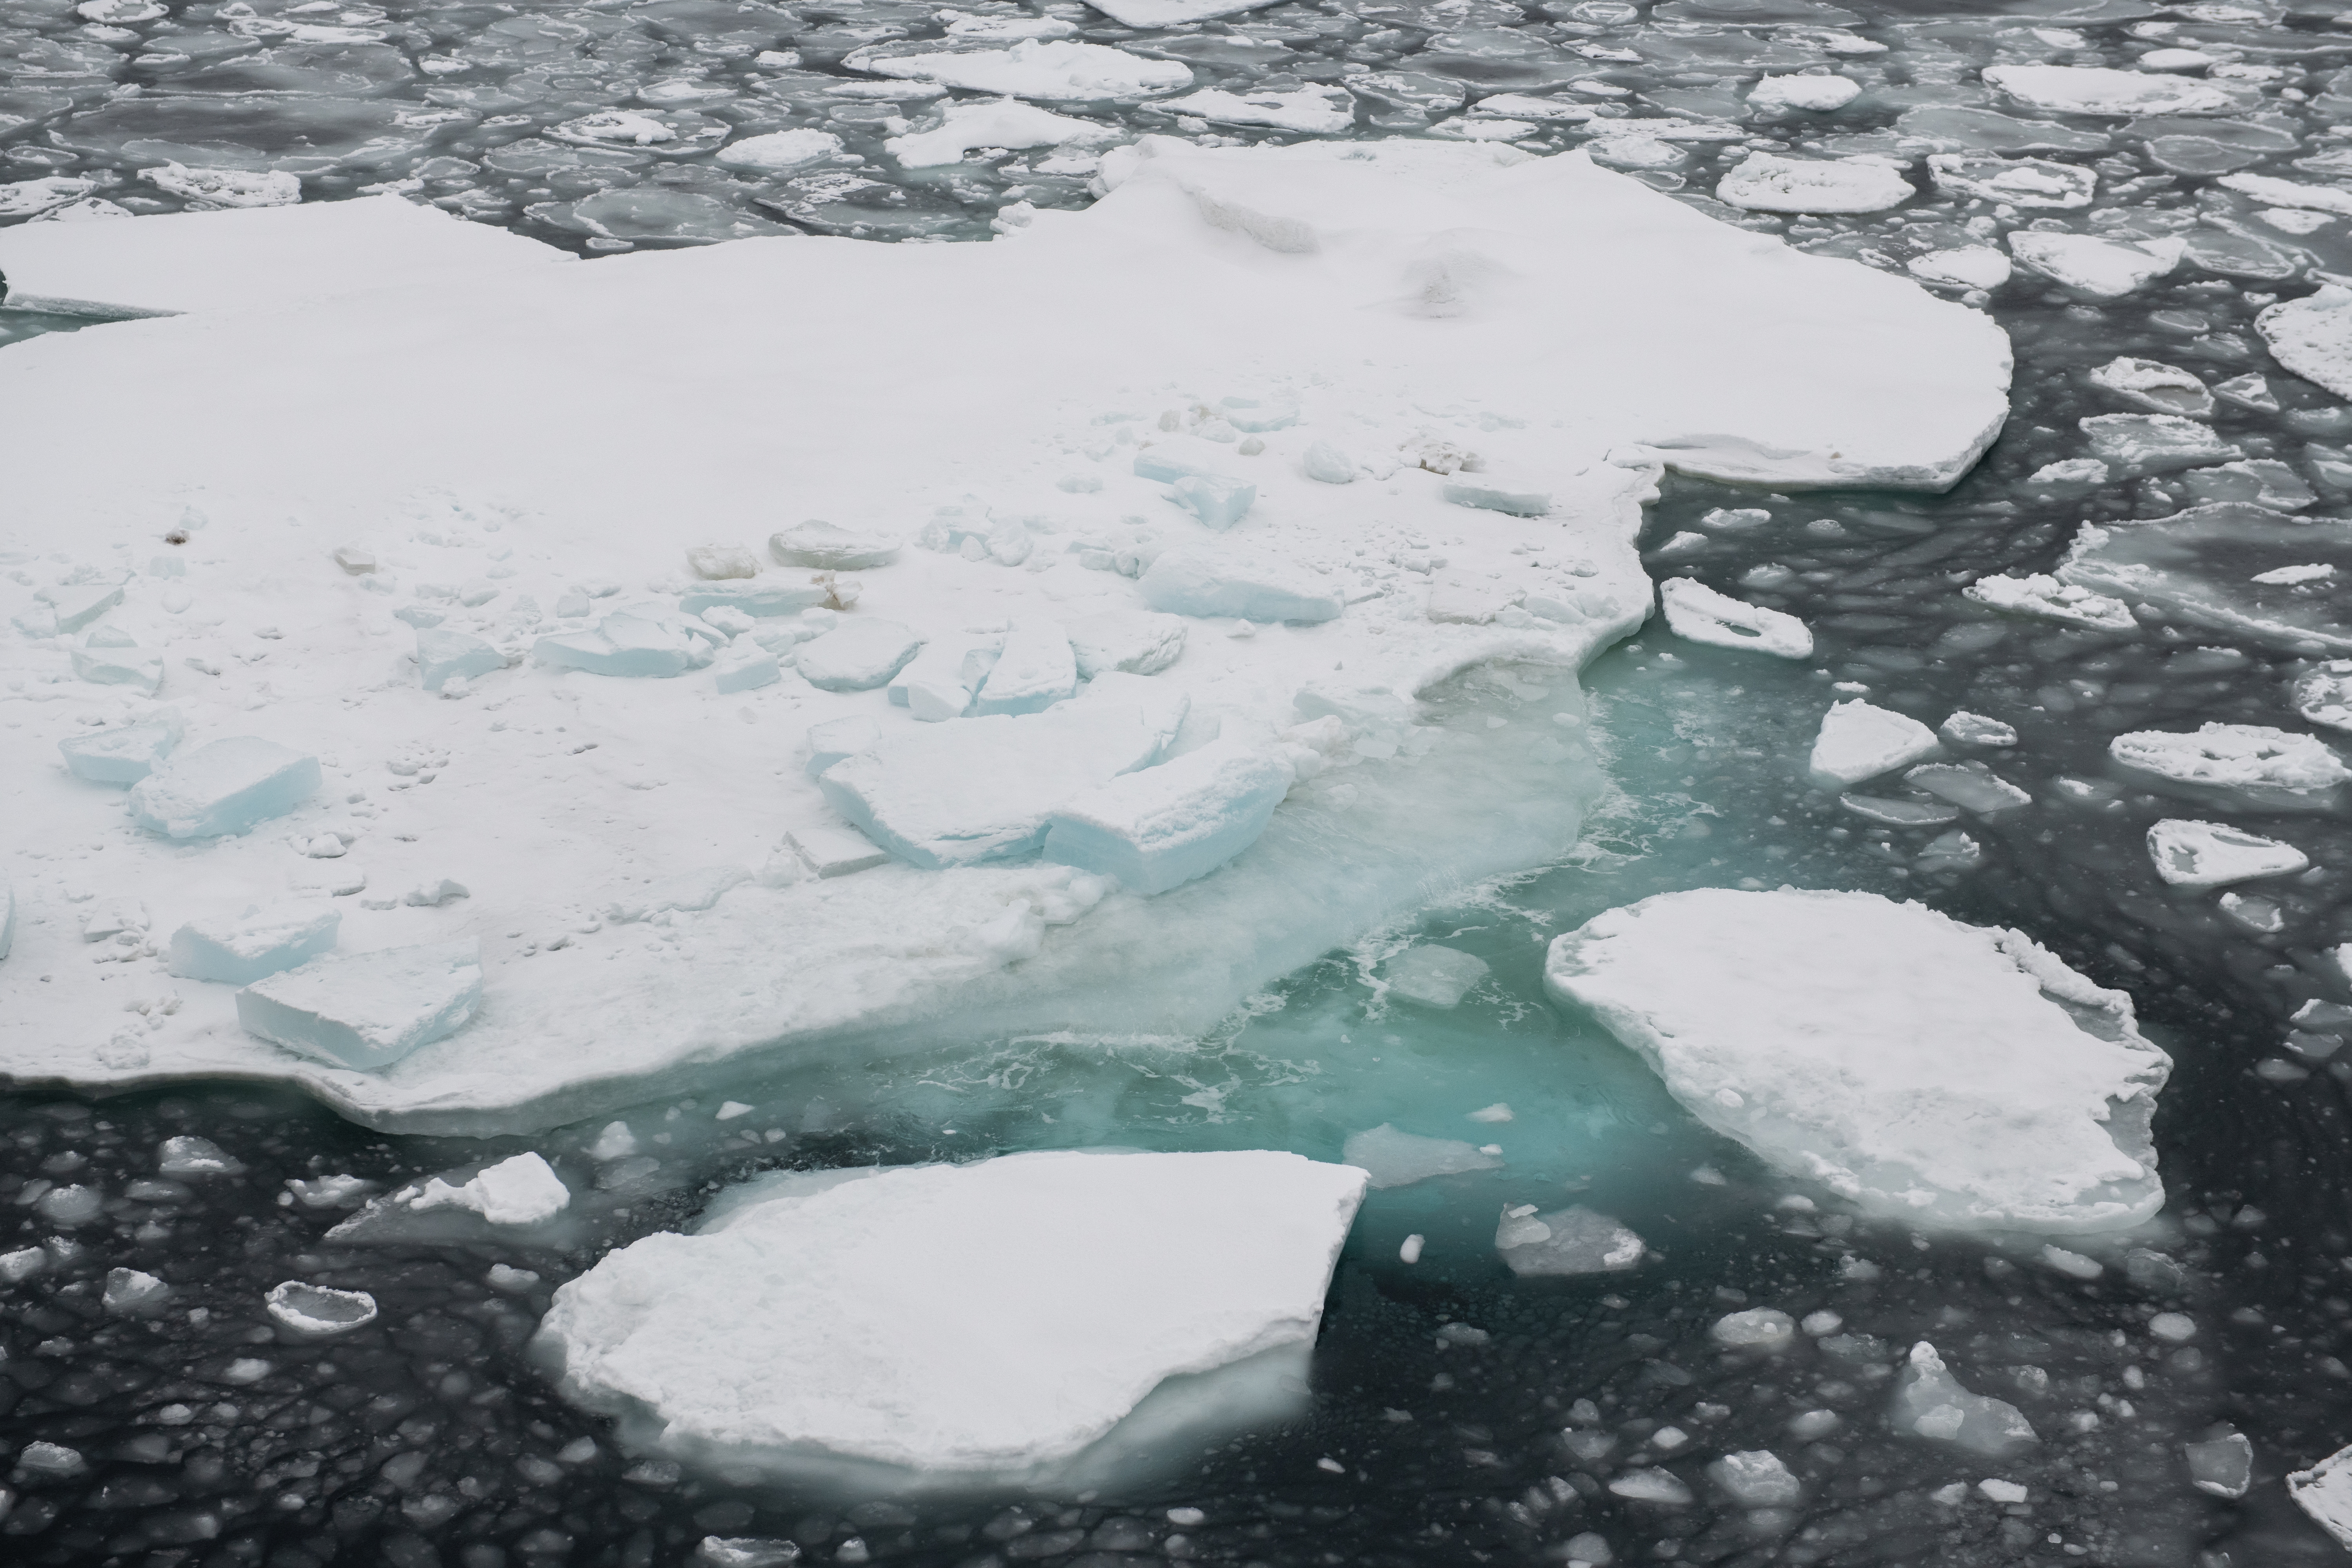
Photo: Sea ice during the Polarstern's transit into the Arctic on Leg I of MOSAiC; Photo credit: Esther Horvath
Reflecting on Albedo
Have you ever burned your bare feet on asphalt under a hot summer sun, but found the grass right next to it to be comfy and cool? To understand why this is, we have to talk about albedo. Albedo is how much sunlight a material reflects, expressed as a number between 0 and 1 (0 and 100%), where 0 is perfectly absorbent (non reflective) and 1 is perfectly reflective. Albedo plays a big role in Earth's energy budget, as absorbing or reflecting sunlight means absorbing or reflecting heat.
Earth is made up of a variety of surfaces with different properties—some are dark (like asphalt), and some are light, like snow. Lighter surfaces tend to reflect more sunlight than they absorb (high albedo). Darker surface tend to absorb a lot of sunlight instead of reflecting it (lower albedo). How do you think albedo is related to temperature or climate on Earth and in the Arctic specifically?
Anchoring phenomenon video: Surface Matters
 Quick Bite: Albedo Comparison
The Earth has an average albedo of about 0.3, which means that Earth reflects an average of about one-third of the sunlight it receives back into space. The table below shows approximate albedo values for a variety of surfaces and materials. What do you notice? Based on this table, how do you think the average albedo of the Arctic compares to the average albedo of the entire Earth? What about the region where you live?
Table: Albedos of different surfaces on Earth
| Substance or Surface | Albedo |
| Whole Earth average | 0.3 |
| Fresh snow | 0.8-0.9 |
| Sea ice | 0.5-0.7 |
| Desert sand | 0.4 |
| Green grass | 0.25 |
| Bare soil | 0.17 |
| Conifer forest | 0.08-0.15 |
| Open ocean | 0.06 |
| Fresh asphalt | 0.04 |
![]()
![]()
 #askmosaic: Lift With Your Skis
This week's question was submitted by Robert and Zion from Seneca Falls Middle School: What is the heaviest piece of equipment someone has had to carry?
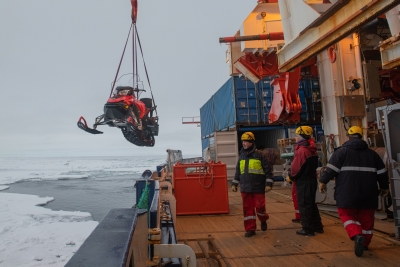
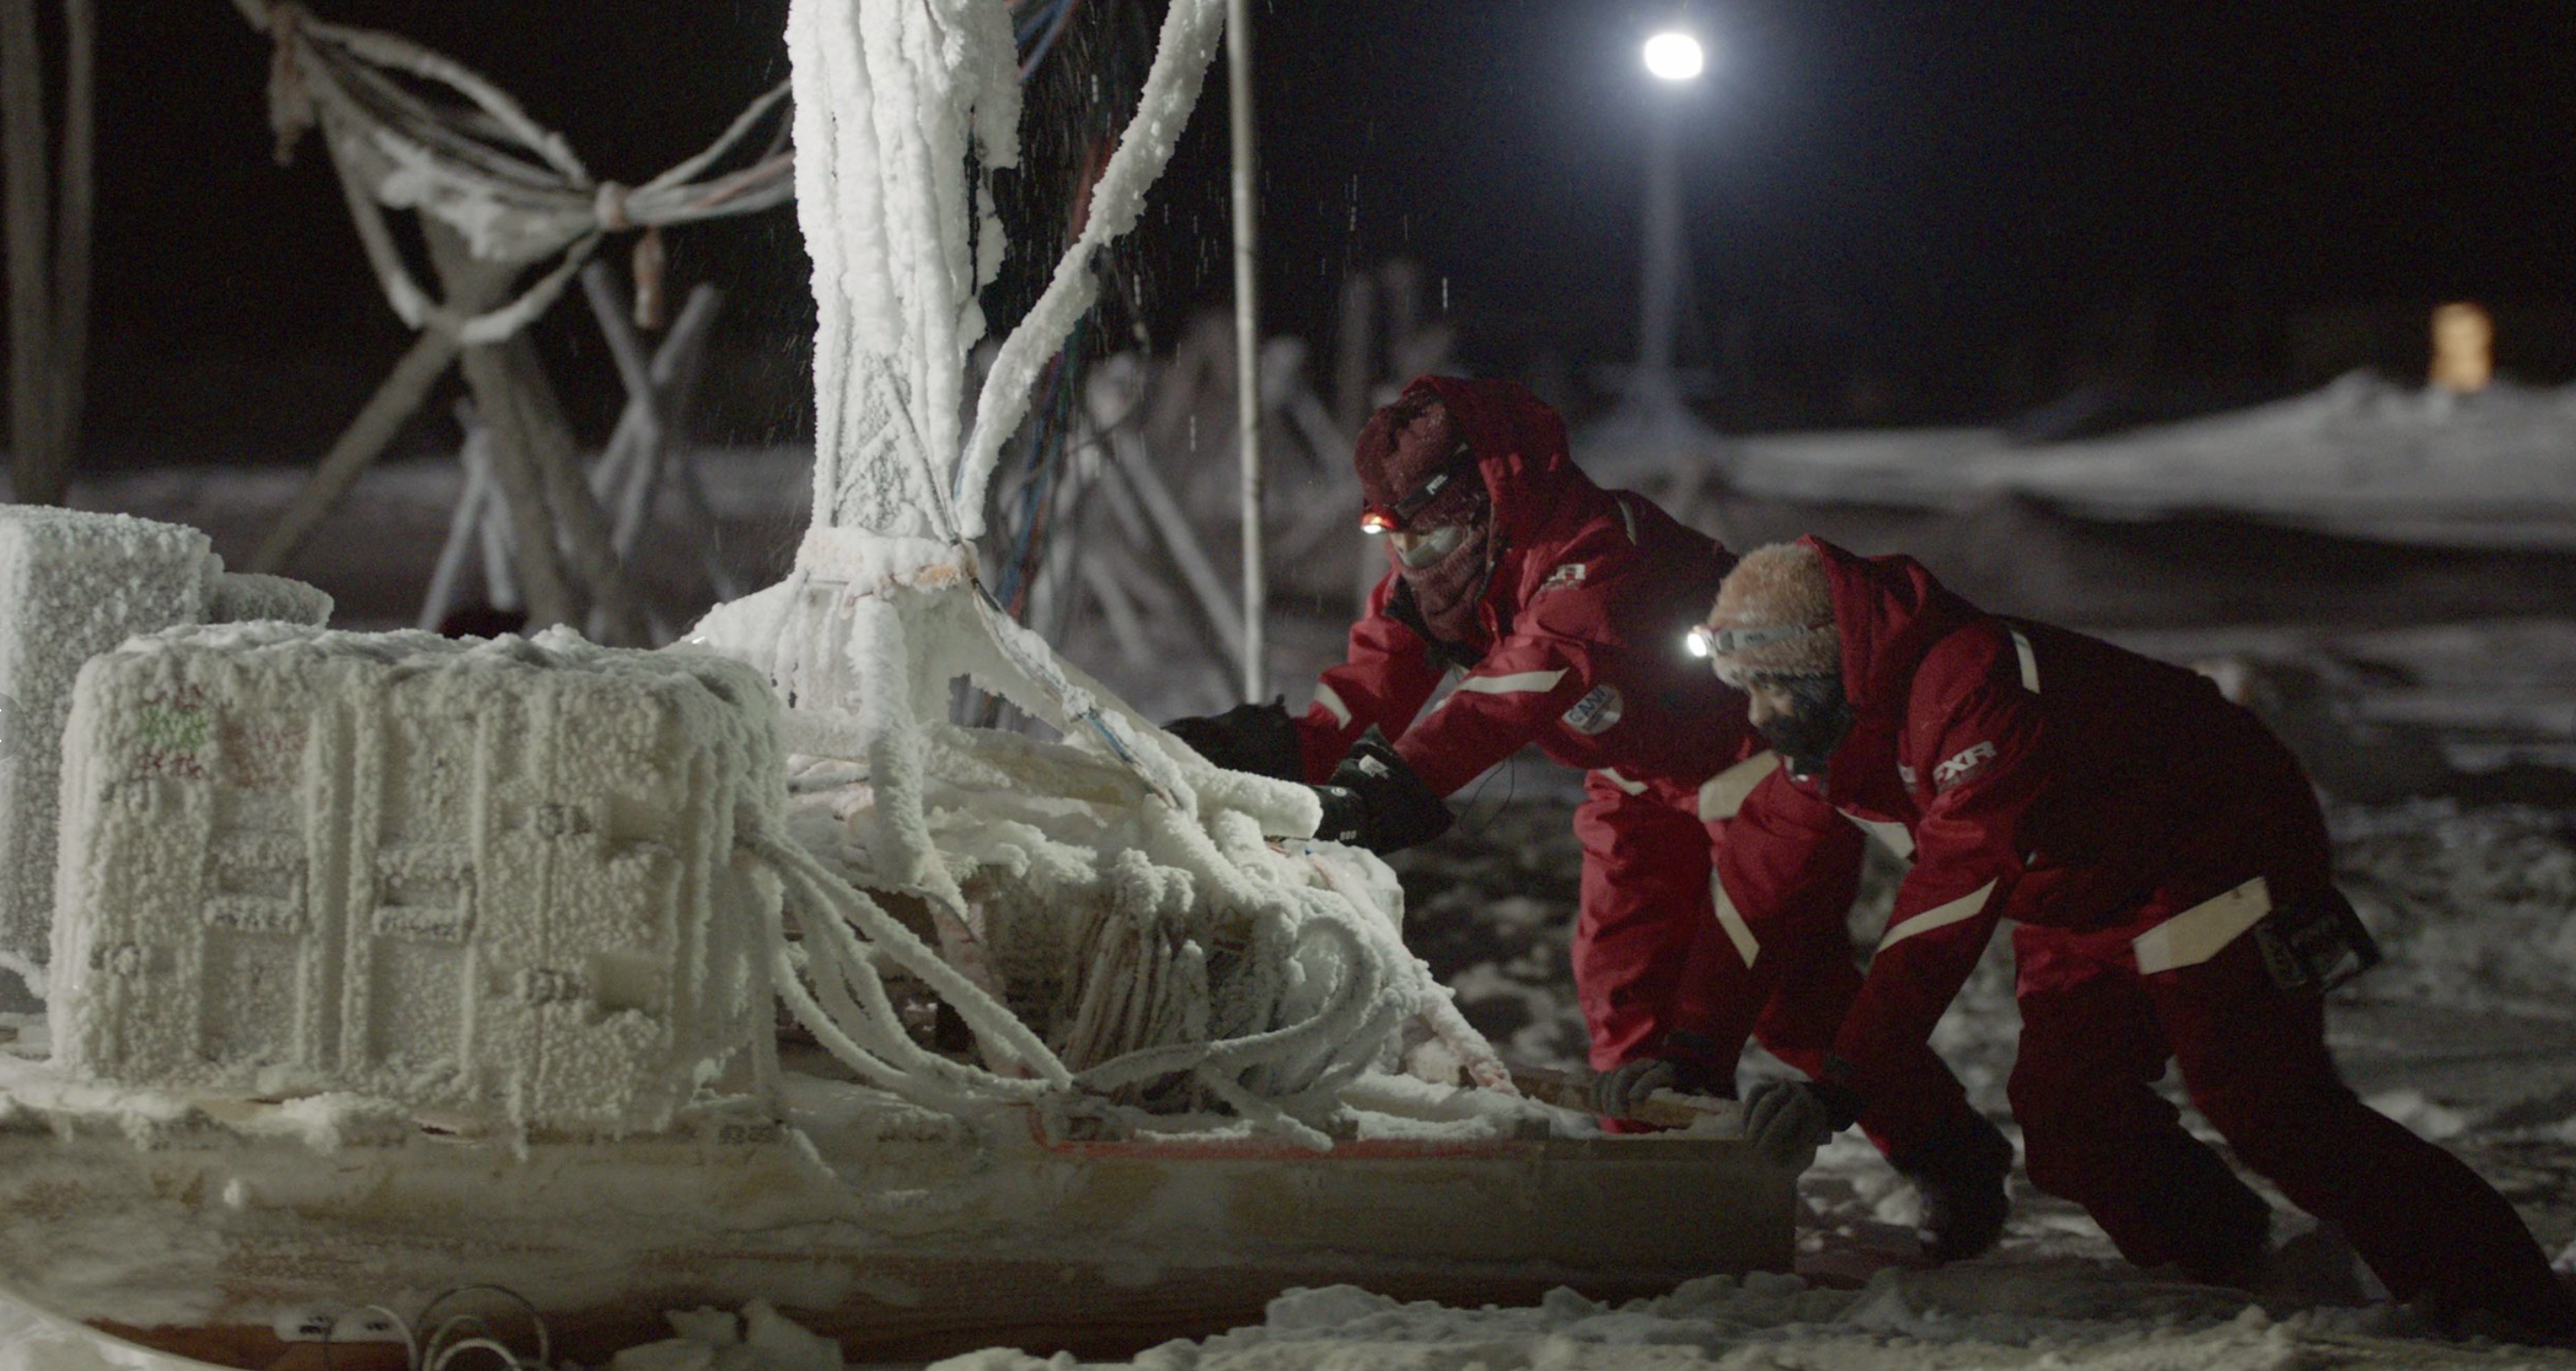
For the Remote Sensing team, all of our equipment is quite heavy (over 100 kgs or 220 lbs per instrument) and requires a crane to lift it from the ship onto the ice. Then we tow it on a sled with skidoos to the site for deployment. However, one of the instruments that we have to install, a wide-band passive microwave radiometer consists of a 110 kg (almost 243 lbs) pedestal we have to carry by hand to where we set up the instrument. This took 4 people to move into place. Then we had to place 70 kgs (154 lbs) on top of the 2-meter (~6.5 ft) pedestal, standing on boxes to reach the top of the pedestal, and trying not to let it drop on our heads. Then we crank the pedestal up to 6 m (20 ft) height. That is by far the heaviest instrument we have had to carry by hand!
-Julienne Stroeve, University of Manitoba, MOSAiC Team ICE and Remote Sensing
Photo (above): The Polarstern's crane lifts a skidoo onto the ice during MOSAiC Leg I; Photo credit: Esther Horvath/AWI
Photo (left): Julienne Stroeve and Vishnu Nandan, both members of Team ICE and Remote Sensing, push a remote sensing instrument across the sea ice in polar darkness and below freezing temperatures; Photo credit: Lars Barthel/AWI
Submit your #askmosaic questions!
Microwaves: They're not just for your leftovers
The electromagnetic spectrum describes different kinds of electromagnetic radiation, or energy. These different kinds of energy travel around as waves with different wavelengths—generally, the shorter the wavelength, the greater the energy. Humans can only see a small portion of the electromagnetic spectrum. Radiation with wavelengths between about 400 and 700 nanometers (wee little waves about the length of a single-celled microscopic organism) are in what we call the 'visible spectrum' and include all of the colors of the rainbow that we can see.
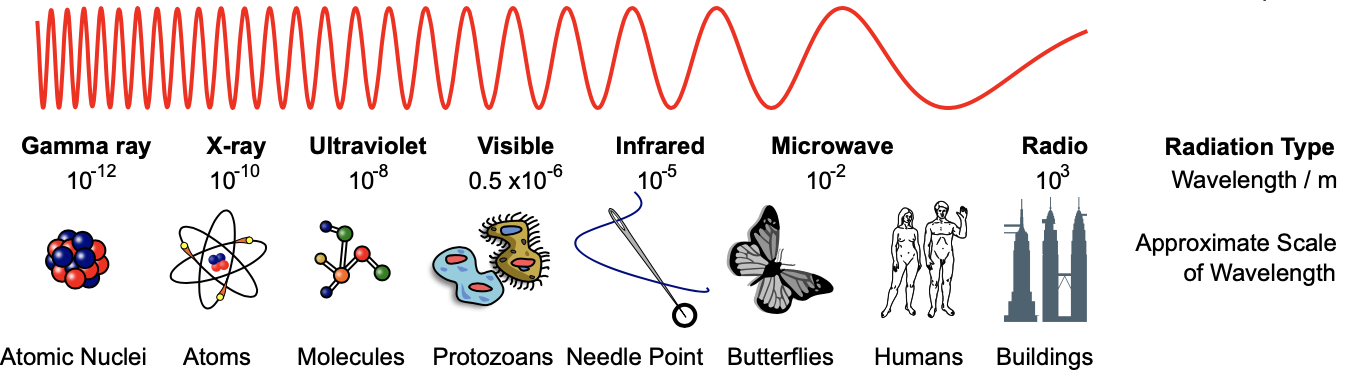
Figure: The Electromagnetic Spectrum; Adapted from Wikimedia Commons/NASA
Microwaves have longer wavelengths than visible light and are useful for more than just reheating your leftovers. Different kinds of materials on Earth—soil, trees, snow, ice, water, etc.—actually emit (give off) microwave radiation, and the amount of microwave radiation emitted depends on the physical properties of a material. Ice emits more microwave radiation than liquid water; thus, microwave radiometers, or instruments that measure the microwaves emitted from things in the environment, can be used to distinguish between different land surfaces or properties of the atmosphere.
Scientists on MOSAiC like Julienne Stroeve are using microwave radiometers to measure things like how much snow there is on top of the sea ice in the Arctic. It turns out this is an important thing to know and study because snow on sea ice has a big impact on the Arctic energy budget and climate system. Snow has a very high albedo - if you've ever been in a snowy environment on a very sunny day, you know that the snow can be hard to look at without squinting your eyes or wearing sunglasses! Freshly fallen snow reflects about 80% of the sunlight falling on it, while sea ice reflects between 50-70%, and ocean water reflects only about 6% (and absorbs the rest). Thus, ocean water absorbs a LOT more solar radiation (heat) than fresh snow or ice.
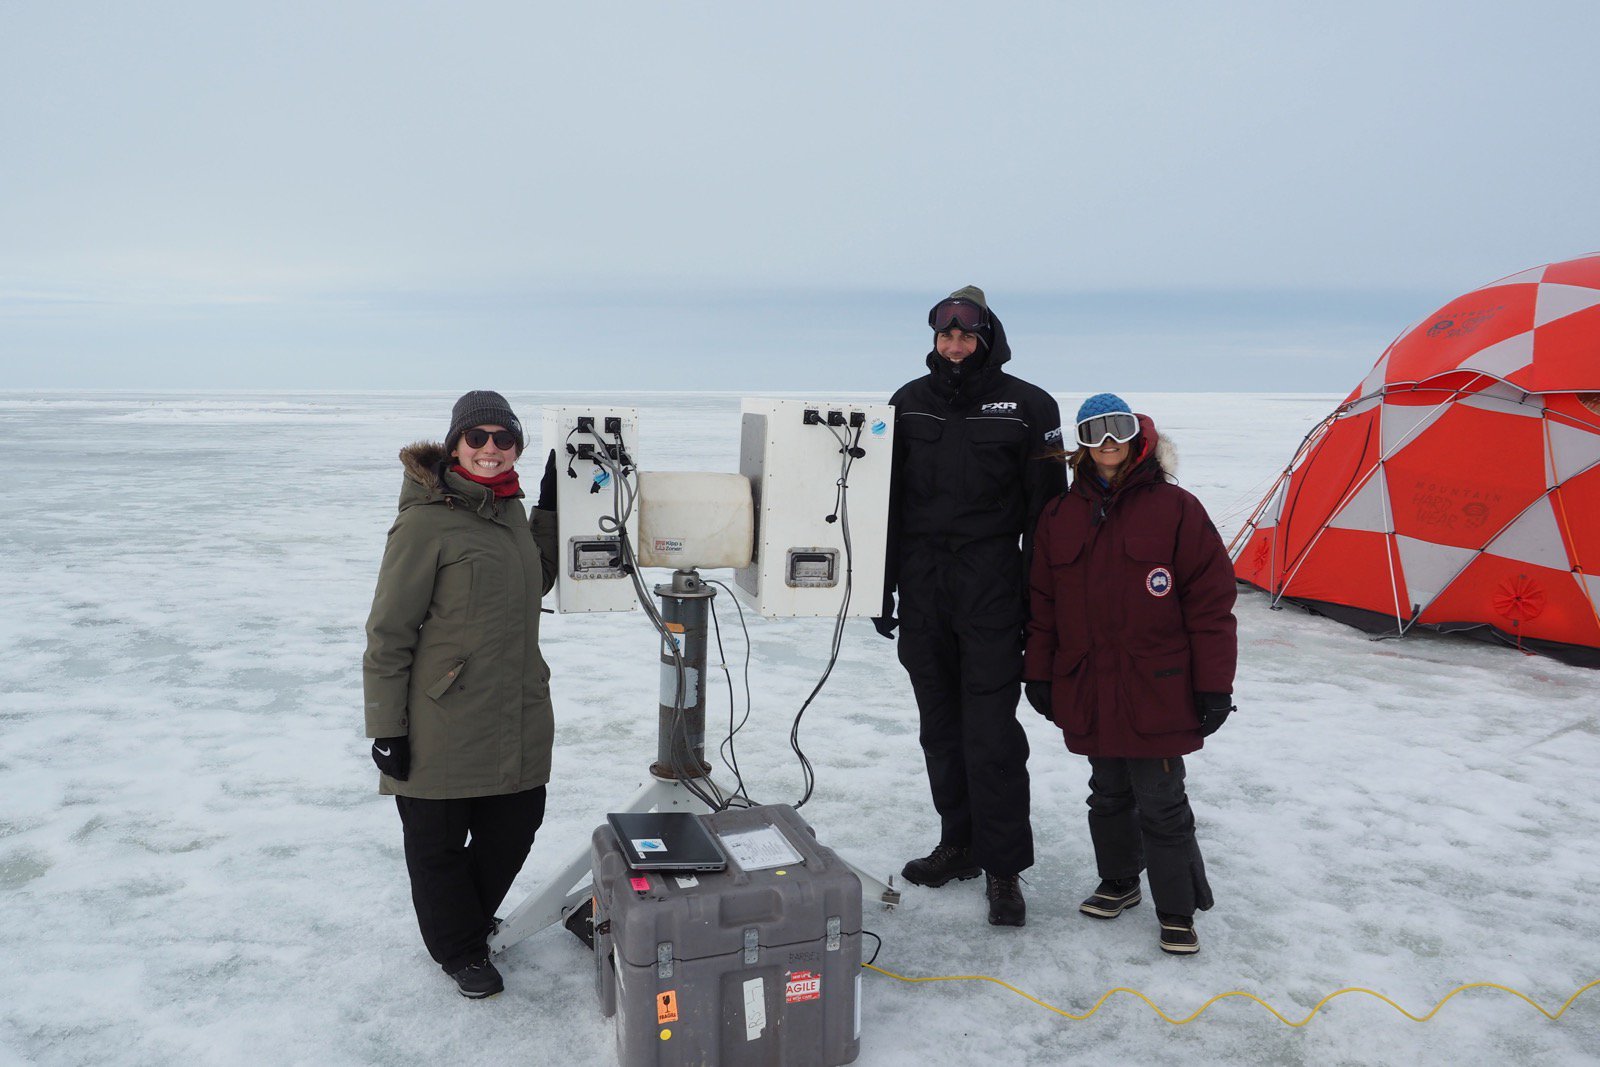
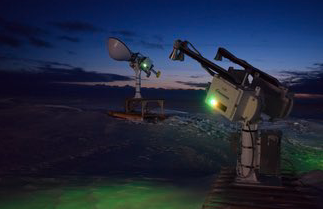
Photo (left): Radiometer setup for MOSAiC; Photo credit: Julienne Stroeve; Photo (right): A radar (foreground) and radiometer set up on the ice for the MOSAiC expedition
 In the Classroom: Radiation Correlation?
This short activity will help your students start to connect the concept of albedo to the Arctic and Earth's climate:
First, make a hypothesis for this question: Would a planet covered entirely in ice be hotter, colder, or the same temperature as a planet covered entirely in ocean water?
Next, take a look at this figure showing changes in Arctic sea ice cover between 2000-2014. Be sure to read the figure caption to understand what the colors mean. Click on the arrow on the right side of the figure labeled 'Next' - this will toggle you to a different figure showing changes in solar radiation absorbed by the Arctic during the same time period (2000-2014). Toggle back and forth between these two figures. What do you notice? Is there any correlation between sea ice cover and absorbed solar radiation?
How do these figures relate to the question: Would a planet covered entirely in ice be hotter, colder, or the same temperature as a planet covered entirely in ocean water? Can you use what you learned in this exercise to try to answer this question? How do you think albedo relates to climate?

![]()
![]()
![]()
Contribute to the Museum of MOSAiC Art (MoMOA)
Do you like to draw, paint, sculpt, take photos, build models, knit, sew, write poetry, or engage in any other kind of creative endeavor? We want you to send us photos or scans of your MOSAiC-themed artwork! You can use any artistic medium you like and submit as many creations as you wish to the following categories:
- How the Arctic affects you
- Arctic exploration
- People of the Arctic
- MOSAiC science
- Arctic flora and fauna
- Arctic land and seascapes
- Life on an Arctic icebreaker
- Abstract Arctic
- Other
We'll be showcasing your artwork in the new virtual Museum of MOSAiC Art (MoMOA). Submit photos or scans of your artwork using the submission form below (open to all ages)!
Submit your artwork
Check out the Museum of MOSAiC Art
Questions? Email us with the subject line "MOSAiC Art": mosaic@colorado.edu
 MOSAiC Weekly Tracking
Plot the Polarstern
Each week we will provide you with the latitude and longitude coordinates of the Polarstern so that your students can track its journey across the Arctic in your classroom.
Download the map to plot coordinates
Download a larger map of the Arctic for a bigger picture view of the expedition area
Location of the Polarstern
| Date | Latitude | Longitude |
| September 16, 2019 | 69.68 N | 18.99 E |
| September 23, 2019 | 72.31 N | 26.93 E |
| September 30, 2019 | 85.12 N | 138.05 E |
| October 4, 2019** | 85.08 N | 134.43 E |
| October 7, 2019 | 85.10 N | 133.82 E |
| October 14, 2019 | 84.85 N | 135.03 E |
| October 21, 2019 | 84.97 N | 132.73 E |
| October 28, 2019 | 85.47 N | 127.07 E |
| November 4, 2019 | 85.88 N | 121.70 E |
| November 11, 2019 | 85.82 N | 116.00 E |
| November 18, 2019 | 86.05 N | 122.43 E |
| November 25, 2019 | 85.85 N | 121.35 E |
| December 2, 2019 | 85.97 N | 112.95 E |
| December 9, 2019 | 86.25 N | 121.40 E |
| December 16, 2019 | 86.62 N | 118.12 E |
| December 23, 2019 | 86.63 N | 113.20 E |
| December 30, 2019 | 86.58 N | 117.13 E |
| January 6, 2020 | 87.10 N | 115.10 E |
| January 13, 2020 | 87.35 N | 106.63 E |
| January 20, 2020 | 87.42 N | 97.77 E |
| January 27, 2020 | 87.43 N | 95.82 E |
| February 3, 2020 | 87.42 N | 93.65 E |
**Day when MOSAiC reached the ice floe that the Polarstern will become frozen in and drift with for the next year.
Log MOSAiC Data
Keep track of Arctic conditions over the course of the expedition:
Download Data Logbook for Sept. 2019 - Dec. 2019
Download Data Logbook for Dec. 2019 - Mar. 2020
| Date | Length of day (hrs) | Air temperature (deg C) at location of Polarstern | Arctic Sea Ice Extent (million km2) |
| September 16, 2019 | 13.25 | High: 10 Low: 4.4 | 3.9 |
| September 23, 2019 | 12.35 | High: 6 Low: -1 | 4.1 |
| September 30, 2019 | 9.1 | -4.7 | 4.4 |
| October 4, 2019** | 6.27 | -13.0 | 4.5 |
| October 7, 2019 | 3.05 | -8.2 | 4.6 |
| October 14, 2019 | 0 | -14.7 | 4.8 |
| October 21, 2019 | 0 | -12.8 | 5.4 |
| October 28, 2019 | 0 | -18.3 | 6.8 |
| November 4, 2019 | 0 | -18.9 | 8.0 |
| November 11, 2019 | 0 | -25.5 | 8.7 |
| November 18, 2019 | 0 | -10.7 | 9.3 |
| November 25, 2019 | 0 | -18.4 | 10.0 |
| December 2, 2019 | 0 | -26.6 | 10.4 |
| December 9, 2019 | 0 | -23.1 | 11.2 |
| December 16, 2019 | 0 | -19.2 | 11.8 |
| December 23, 2019 | 0 | -26.9 | 12.2 |
| December 30, 2019 | 0 | -26.4 | 12.6 |
| January 6, 2020 | 0 | -28.0 | 13.0 |
| January 13, 2020 | 0 | -30.7 | 13.1 |
| January 20, 2020 | 0 | -27.1 | 13.6 |
| January 27, 2020 | 0 | -22.5 | 13.8 |
| February 3, 2020 | 0 | -28.8 | 14.1 |
*Note: We expect data to fall within the following ranges: Length of day, 0-24 hours; Temperature, -40 to 14 degrees C; Sea ice extent, 3-15 million km2
**Day when MOSAiC reached the ice floe that the Polarstern will become frozen in and drift with for the next year.
Opportunities for Students and Educators
MOSAiC + Reach the World
Exciting news! The MOSAiC education & outreach team is partnering with Reach the World to connect more classrooms to the MOSAiC expedition. Over the coming months, Reach the World will share MOSAiC team members' incredible stories about the expedition, its research, and the everyday challenges of life in the Arctic.
This week, MOSAiC team members Ryleigh Moore and Dave Costa shed light on what life is like aboard an icebreaker in the Arctic. Join Ryleigh and Dave live on February 5th at 2:00 pm Eastern Time to hear more about their MOSAiC experiences and ask them questions!
Read Ryleigh Moore's field notes about getting around in the Arctic
Sign up to join Ryleigh and Dave for a live video call on February 5th
Arctic Plant Phenology Learning through Engaged Science (APPLES) Workshop for Teachers
Teachers can apply to spend 3 days (June 29-July 1) at Fort Lewis College in Durango, Colorado engaging and collaborating with leading polar research scientists and science educators to learn about the seasonal dynamics of plants and animals in the Arctic. Workshop participants will engage in inquiry-based activities that support the three dimensions of the Next Generation Science Standards (NGSS). Participating teachers will receive a $300 stipend -- the workshop is limited to 10 participants, so register early!
Register for the APPLES Workshop for Teachers
Learn more about the APPLES project
 MOSAiC Monday and the NGSS
What do those funny symbols below some engagements mean?
Good news for educators in the U.S. teaching with the Next Generation Science Standards (NGSS) or similar! We will now be tagging MOSAiC Monday engagements with the NGSS Disciplinary Core Idea subject(s), Science and Engineering Practice(s), and Crosscutting Concept(s) that they most closely connect to. Look for these symbols listed below each engagement:
Disciplinary Core Idea Subjects
Science and Engineering Practices (adopted from the San Diego County Office of Education Science Resource Center)
Crosscutting Concepts (adopted from the San Diego County Office of Education Science Resource Center)
Is there something you'd like to see in MOSAiC Monday? Let us know!
Send us your feedback
New to MOSAiC Monday? Check out past editions!
Browse more expedition-related educational resources, videos, and blogs
Email us! mosaic@colorado.edu