
A Solar Powered Planet
Over the next several months, we'll be exploring the important science focus areas of MOSAiC. What are scientists studying during this year-long drift expedition and why? How are they collecting data, and what are they going to do with it? This week, we'll heat things up with:
Earth's Energy Budget: Part 1
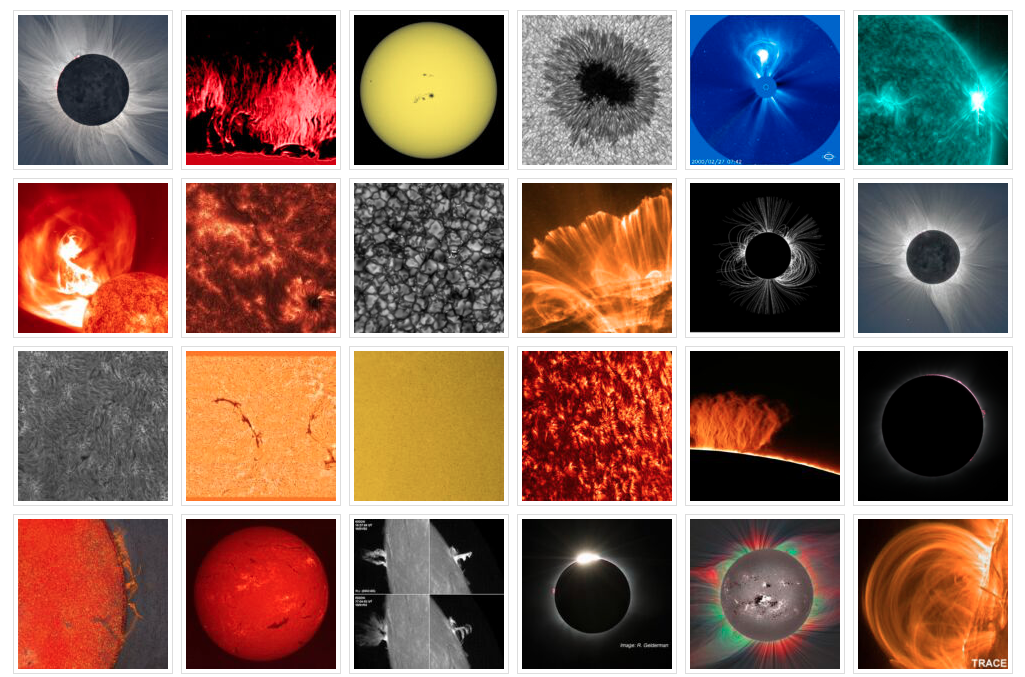
Image credit: National Solar Observatory/AURA/NSF
Great Ball of Fire
The most crucial source of energy that makes the planet we live on habitable is our Sun, a ball of hot plasma at the center of our solar system nearly 93 million miles away from Earth. Several neat things happen to solar energy when it reaches Earth, making our planet a beautifully complex and dynamic place to call home.
Check out the National Solar Observatory's Resources for Educators
Energy Enigmas
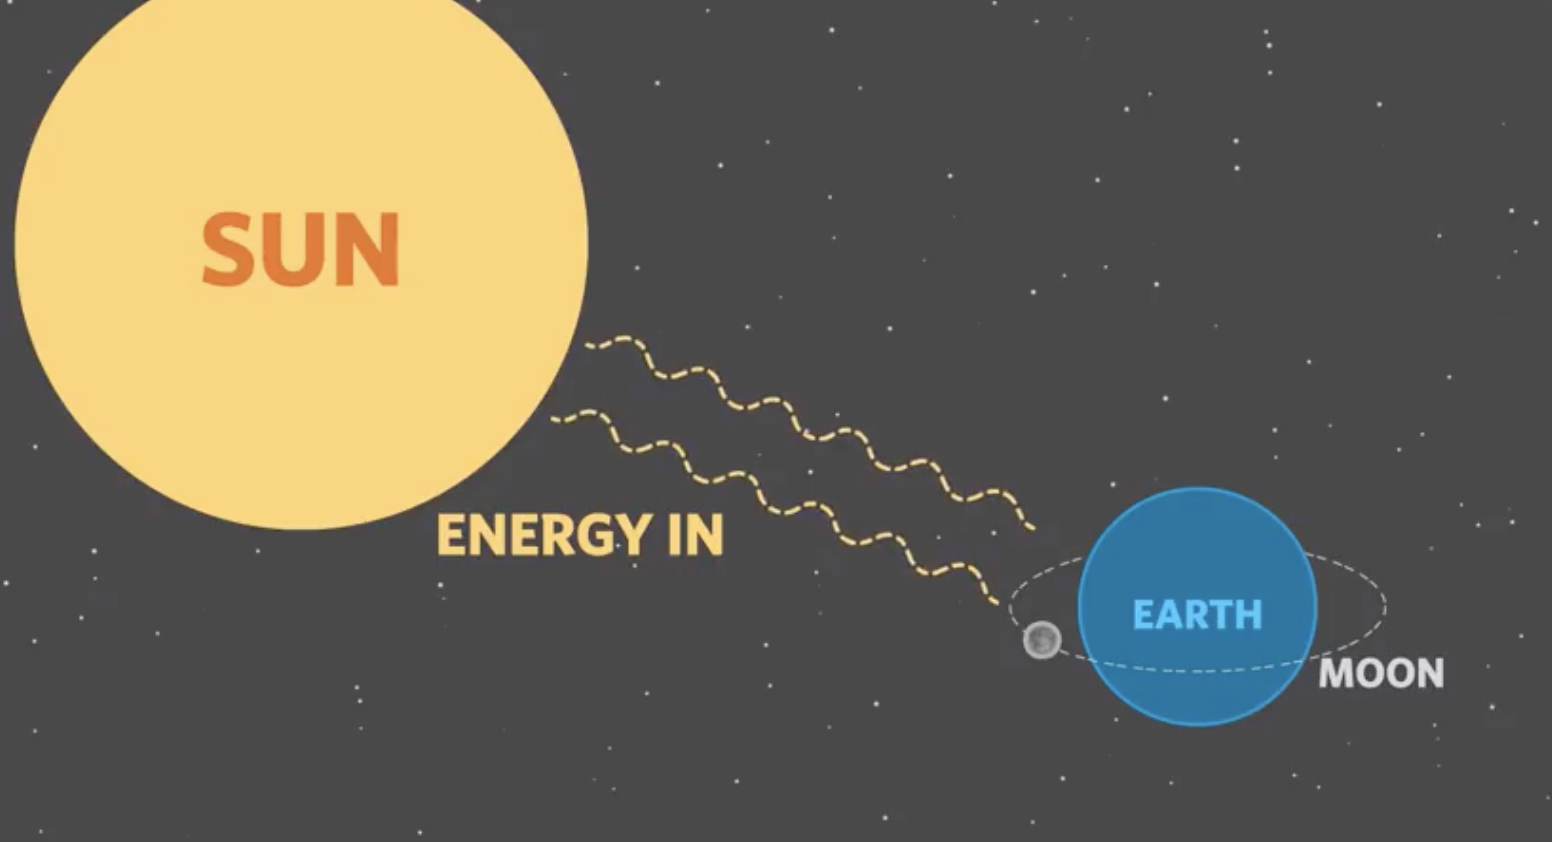
Earth and its Moon are essentially the same distance from the Sun (the distance between Earth and the Moon is pretty negligible compared to how far they both are from the Sun). Therefore, it's not inaccurate to say that, on average, Earth and the Moon receive the same amount of solar radiation from the Sun. However, surface temperatures on the Moon can range from around 127°C (260°F) during the lunar day to around -173°C (-280°F) during the lunar night! According to Guinness World Records, the greatest recorded temperature range on Earth (which occurred in Siberia) was between -68°C (-90°F) and 37°C (98°F). Why are the Moon and Earth so different temperature-wise if they are essentially the same distance from the Sun?? Image credit: California Academy of Sciences
Here is another thermodynamic enigma for you: Earth's average temperature given the amount of sunlight reaching it should be around -18°C (0°F) but Earth's actual average temperature is around 15°C (59°F). What is going on?
 Quick Bite: You're Getting Warmer
Why are the Moon and Earth so different temperature-wise if they are essentially the same distance from the Sun? Teachers, ask your students to brainstorm in small groups ways in which Earth and the Moon are the same and different (other than their temperature ranges). Then, as a class, create a chart of similarities and differences on the board and discuss which factors might be responsible for Earth's cozy climate. Watch the video below to see what the answer is!
Video: Earth's Delicate Energy Balance
Calculating Planetary Energy Balance & Temperature from the UCAR Center for Science Education

![]()
 In the Classroom: Budget Your Money, Budget Your Energy
What does someone mean when they say they're "on a budget"? Usually it means that they want to maintain a certain amount of money in their wallet or bank account, which in turn means that they have to balance how much money they spend vs. how much money they save. Just like you and I might have a financial budget, Earth has an energy budget. The earth's energy budget describes the balance between the energy that is reaching the earth from the Sun and the energy is that flowing back out into space from the earth. In the simplest sense, if this energy budget stays balanced, Earth's temperature stays constant. If the energy budget is thrown off balance, Earth's temperature will increase or decrease to restore balance.
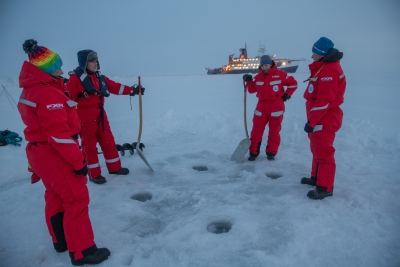
The Arctic plays an important role in Earth's energy budget (more on this in next week's MOSAiC Monday), and MOSAiC scientists are hard at work trying to better understand its role and how things are changing.
Photo: Scientists on the ice during Leg I; Photo credit: Esther Horvath
Take a look at this diagram of Earth's energy budget from NASA which shows energy flowing into the earth's system (arrows pointing towards the earth) and energy flowing out of the earth's system (arrows pointing away from the earth's surface). The different colors indicate different kinds of energy, but we're going to ignore those for now. Create a T-chart and label the columns "In" and "Out". In the "In" column, list ways in which the energy coming into the earth's system could increase or decrease. For example: The earth's surface could absorb more energy. In the 'Out' column, list ways in which energy leaving the earth's system could increase or decrease. For example: The atmosphere could emit more energy. What specific events or processes could change the amount of energy coming into or leaving the earth system?
Diagram of Earth's energy budget
![]()
![]()

![]()
 #askmosaic: Exploring in a Frigid Environment
This week we're bringing you TWO #askmosaic questions!
The first question was submitted by Brooklyn from Middleton Middle School: Why are you interested in exploring the Arctic?
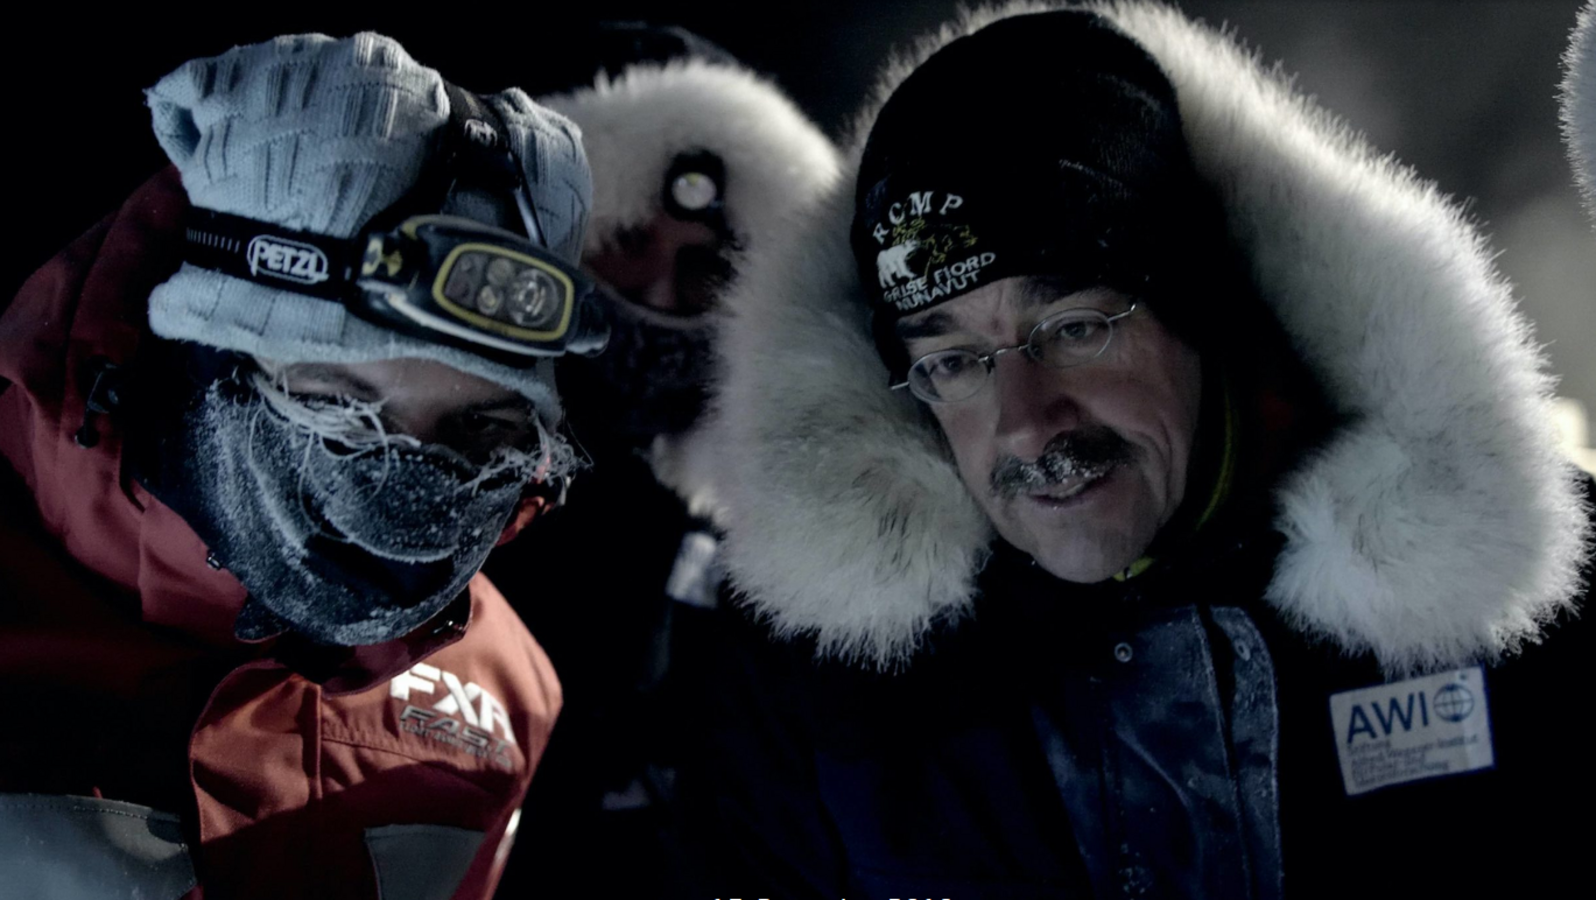
The Arctic is a key region for the world's climate and is experiencing rapid sea ice retreat, one of the most impressive indicators of climate change. However, there is still little information available to understand and predict these changes, particularly in winter. MOSAiC will acquire the missing data, throughout a complete annual cycle with its freezing and melting phases, with unprecedented detail and interdisciplinary breadth. This includes studies of the physical, chemical, and biological interactions between the ocean, ice, and atmosphere.
-Christian Haas (on the right in the photo), Sea Ice Geophysicist at the Alfred Wegener Institute and Chief Scientist of MOSAiC Leg II
Photo credit: Lars Barthel, AWI
Several people also wanted to know how warm the Arctic gets, and Lily and Eden from Seneca Falls Middle School asked What is the hottest temperature you have experienced so far?
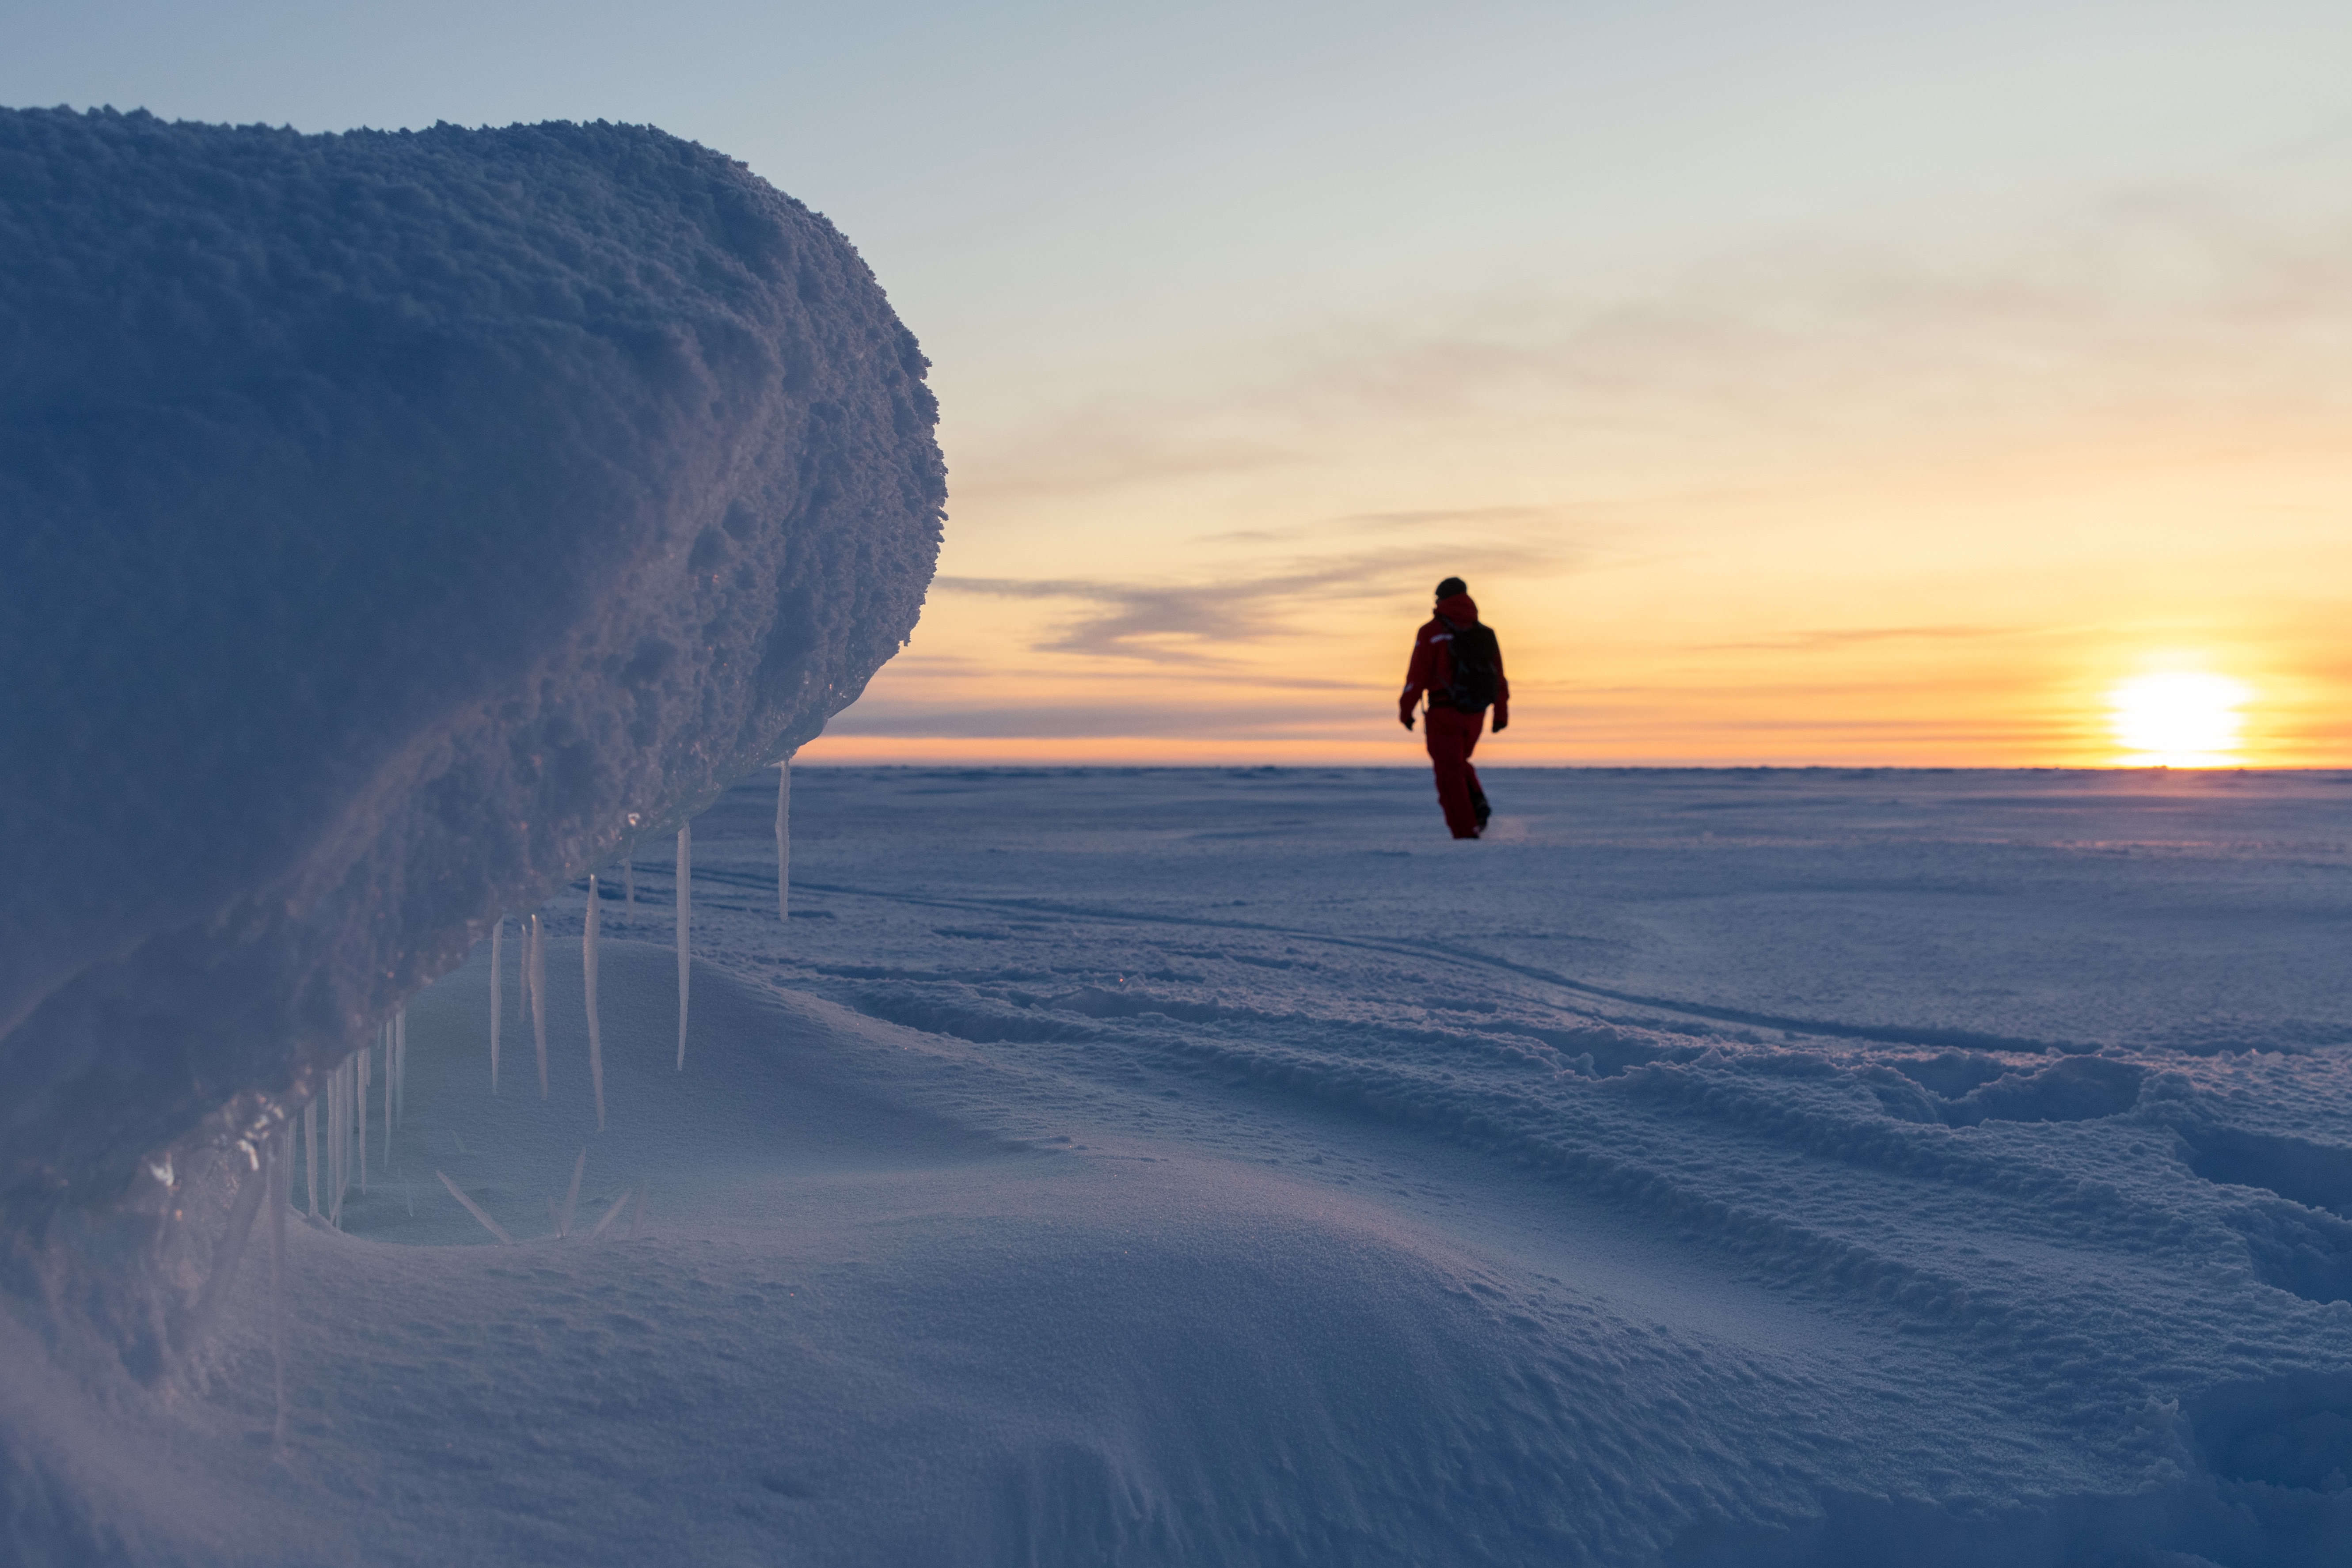
While in winter temperatures over the Arctic Ocean tend to average around -30 degrees centigrade (-22°F), it is possible to have warming events in the middle of winter where the temperature goes above 0°C (32°F). This tends to happen when cyclones that form in the North Atlantic track further north over the sea ice areas, bringing relatively warm and moist air to the Arctic. In recent winters, these winter warming events have become more frequent and persist for longer than they used to. For example, in December/January of 2015-2016 and in 2016-2017, air temperatures at the north pole reached 0°C as large cyclones brought warm air to the central Arctic. In winter 2017, a large polynya (opening in the sea ice cover) formed north of Greenland and air temperatures soared to 10°C (50°F) at a north coastal Greenland station. ...so far temperatures have remained colder than -20°C (-4°F) since taking over for Leg 1 on the 15th of December.
-Julienne Stroeve, University of Manitoba, member of MOSAiC Team ICE and Remote Sensing
Note that the warmest temperature recorded so far in the MOSAiC Data Log (which is just a weekly snapshot) after the expedition launched on September 20th is 6°C (~43°F) on September 23rd when the Polarstern was en route north into the Arctic.
Photo: Leg I expedition leader Markus Rex explores an ice floe during Leg I of the expedition; Photo credit: Marcel Nicolaus
Submit your #askmosaic questions!
*NEW* Museum of MOSAiC Art (MoMOA)
Do you like to draw, paint, sculpt, take photos, build models, knit, sew, write poetry, or engage in any other kind of creative endeavor? We want you to send us photos or scans of your MOSAiC-themed artwork! You can use any artistic medium you like and submit as many creations as you wish to the following categories:
- How the Arctic affects you
- Arctic exploration
- People of the Arctic
- MOSAiC science
- Arctic flora and fauna
- Arctic land and seascapes
- Life on an Arctic icebreaker
- Abstract Arctic
- Other
We'll be showcasing your artwork in the new virtual Museum of MOSAiC Art (MoMOA). Submit photos or scans of your artwork using the submission form below (open to all ages)!
Submit your artwork
Check out the Museum of MOSAiC Art
Questions? Email us with the subject line "MOSAiC Art": mosaic@colorado.edu
 MOSAiC Weekly Tracking
Plot the Polarstern
Download the map to plot coordinates
Download a larger map of the Arctic for a bigger picture view of the expedition area
Location of the Polarstern
| Date | Latitude | Longitude |
| September 16, 2019 | 69.68 N | 18.99 E |
| September 23, 2019 | 72.31 N | 26.93 E |
| September 30, 2019 | 85.12 N | 138.05 E |
| October 4, 2019** | 85.08 N | 134.43 E |
| October 7, 2019 | 85.10 N | 133.82 E |
| October 14, 2019 | 84.85 N | 135.03 E |
| October 21, 2019 | 84.97 N | 132.73 E |
| October 28, 2019 | 85.47 N | 127.07 E |
| November 4, 2019 | 85.88 N | 121.70 E |
| November 11, 2019 | 85.82 N | 116.00 E |
| November 18, 2019 | 86.05 N | 122.43 E |
| November 25, 2019 | 85.85 N | 121.35 E |
| December 2, 2019 | 85.97 N | 112.95 E |
| December 9, 2019 | 86.25 N | 121.40 E |
| December 16, 2019 | 86.62 N | 118.12 E |
| December 23, 2019 | 86.63 N | 113.20 E |
| December 30, 2019 | 86.58 N | 117.13 E |
| January 6, 2020 | 87.10 N | 115.10 E |
| January 13, 2020 | 87.35 N | 106.63 E |
| January 20, 2020 | 87.42 N | 97.77 E |
| January 27, 2020 | 87.43 N | 95.82 E |
**Day when MOSAiC reached the ice floe that the Polarstern will become frozen in and drift with for the next year.
Log MOSAiC Data
Download a MOSAiC Data Logbook to keep track of Arctic conditions over the course of the expedition
**The Data Logbook has been updated for 2020!
| Date | Length of day (hrs) | Air temperature (deg C) at location of Polarstern | Arctic Sea Ice Extent (million km2) |
| September 16, 2019 | 13.25 | High: 10 Low: 4.4 | 3.9 |
| September 23, 2019 | 12.35 | High: 6 Low: -1 | 4.1 |
| September 30, 2019 | 9.1 | -4.7 | 4.4 |
| October 4, 2019** | 6.27 | -13.0 | 4.5 |
| October 7, 2019 | 3.05 | -8.2 | 4.6 |
| October 14, 2019 | 0 | -14.7 | 4.8 |
| October 21, 2019 | 0 | -12.8 | 5.4 |
| October 28, 2019 | 0 | -18.3 | 6.8 |
| November 4, 2019 | 0 | -18.9 | 8.0 |
| November 11, 2019 | 0 | -25.5 | 8.7 |
| November 18, 2019 | 0 | -10.7 | 9.3 |
| November 25, 2019 | 0 | -18.4 | 10.0 |
| December 2, 2019 | 0 | -26.6 | 10.4 |
| December 9, 2019 | 0 | -23.1 | 11.2 |
| December 16, 2019 | 0 | -19.2 | 11.8 |
| December 23, 2019 | 0 | -26.9 | 12.2 |
| December 30, 2019 | 0 | -26.4 | 12.6 |
| January 6, 2020 | 0 | -28.0 | 13.0 |
| January 13, 2020 | 0 | -30.7 | 13.1 |
| January 20, 2020 | 0 | -27.1 | 13.6 |
| January 27, 2020 | 0 | -22.5 | 13.8 |
*Note: We expect data to fall within the following ranges: Length of day, 0-24 hours; Temperature, -40 to 14 degrees C; Sea ice extent, 3-15 million km2
**Day when MOSAiC reached the ice floe that the Polarstern will become frozen in and drift with for the next year.
 MOSAiC + Reach the World
Exciting news! The MOSAiC education & outreach team is partnering with Reach the World to connect more classrooms to the MOSAiC expedition. Over the coming months, Reach the World will share MOSAiC team members' incredible stories about the expedition, its research, and the everyday challenges of life in the Arctic. This STEM-rich virtual exchange will combine written articles published here and interactive video calls with MOSAiC team members as they cycle off of Polarstern and return to their homes around the world. Want to know if Arctic ice is really melting, and if so, how we know? Curious about life aboard Polarstern and daily life on the ice? Join the expedition today, and you can learn from the experts themselves! Thanks to the generous support of the Elba Foundation, teachers can sign up for free here.
Follow MOSAiC with Reach the World
Sign up for Reach the World's Explorer Program
 MOSAiC Monday and the NGSS
What do those funny symbols below some engagements mean?
Good news for educators in the U.S. teaching with the Next Generation Science Standards (NGSS) or similar! We will now be tagging MOSAiC Monday engagements with the NGSS Disciplinary Core Idea subject(s), Science and Engineering Practice(s), and Crosscutting Concept(s) that they most closely connect to. Look for these symbols listed below each engagement:
Disciplinary Core Idea Subjects
Science and Engineering Practices (adopted from the San Diego County Office of Education Science Resource Center)
Crosscutting Concepts (adopted from the San Diego County Office of Education Science Resource Center)
Is there something you'd like to see in MOSAiC Monday? Let us know!
Send us your feedback
New to MOSAiC Monday? Check out past editions!
Browse more expedition-related educational resources, videos, and blogs
Email us! mosaic@colorado.edu