Working Around the Clock
This week, we're turning to MOSAiC expedition co-coordinator Matthew Shupe (CIRES/NOAA, Team Atmosphere) for our weekly expedition update. Dr. Shupe is currently on board the Polarstern. Here is a journal entry he wrote from July 11th:
24 hour
By Matthew Shupe
It’s so great to see so many eager scientists out here. The routine, long-work-days-with-little-sleep has apparently not been enough for everyone and there has been a push for conducting a 24-hour measurement cycle. Originally the motivation for this extended measurement period was the daily change in the surface we’ve been seeing. Last week there would be periods of the day when melt was rampant, but then periods when the surface would freeze. Thin layers of ice would form on the top of melt ponds. That phenomenon has shifted now and we are not really seeing major shifts during the day anymore; the system appears to be mostly in a permanent melt state. However, there is still diurnal variability. For example, there is about 4-5 times as much solar input to the surface at the solar noon relative to the solar midnight (though even at solar midnight there is substantial sunlight, which somehow finds a way to creep in through my blinds at night!).
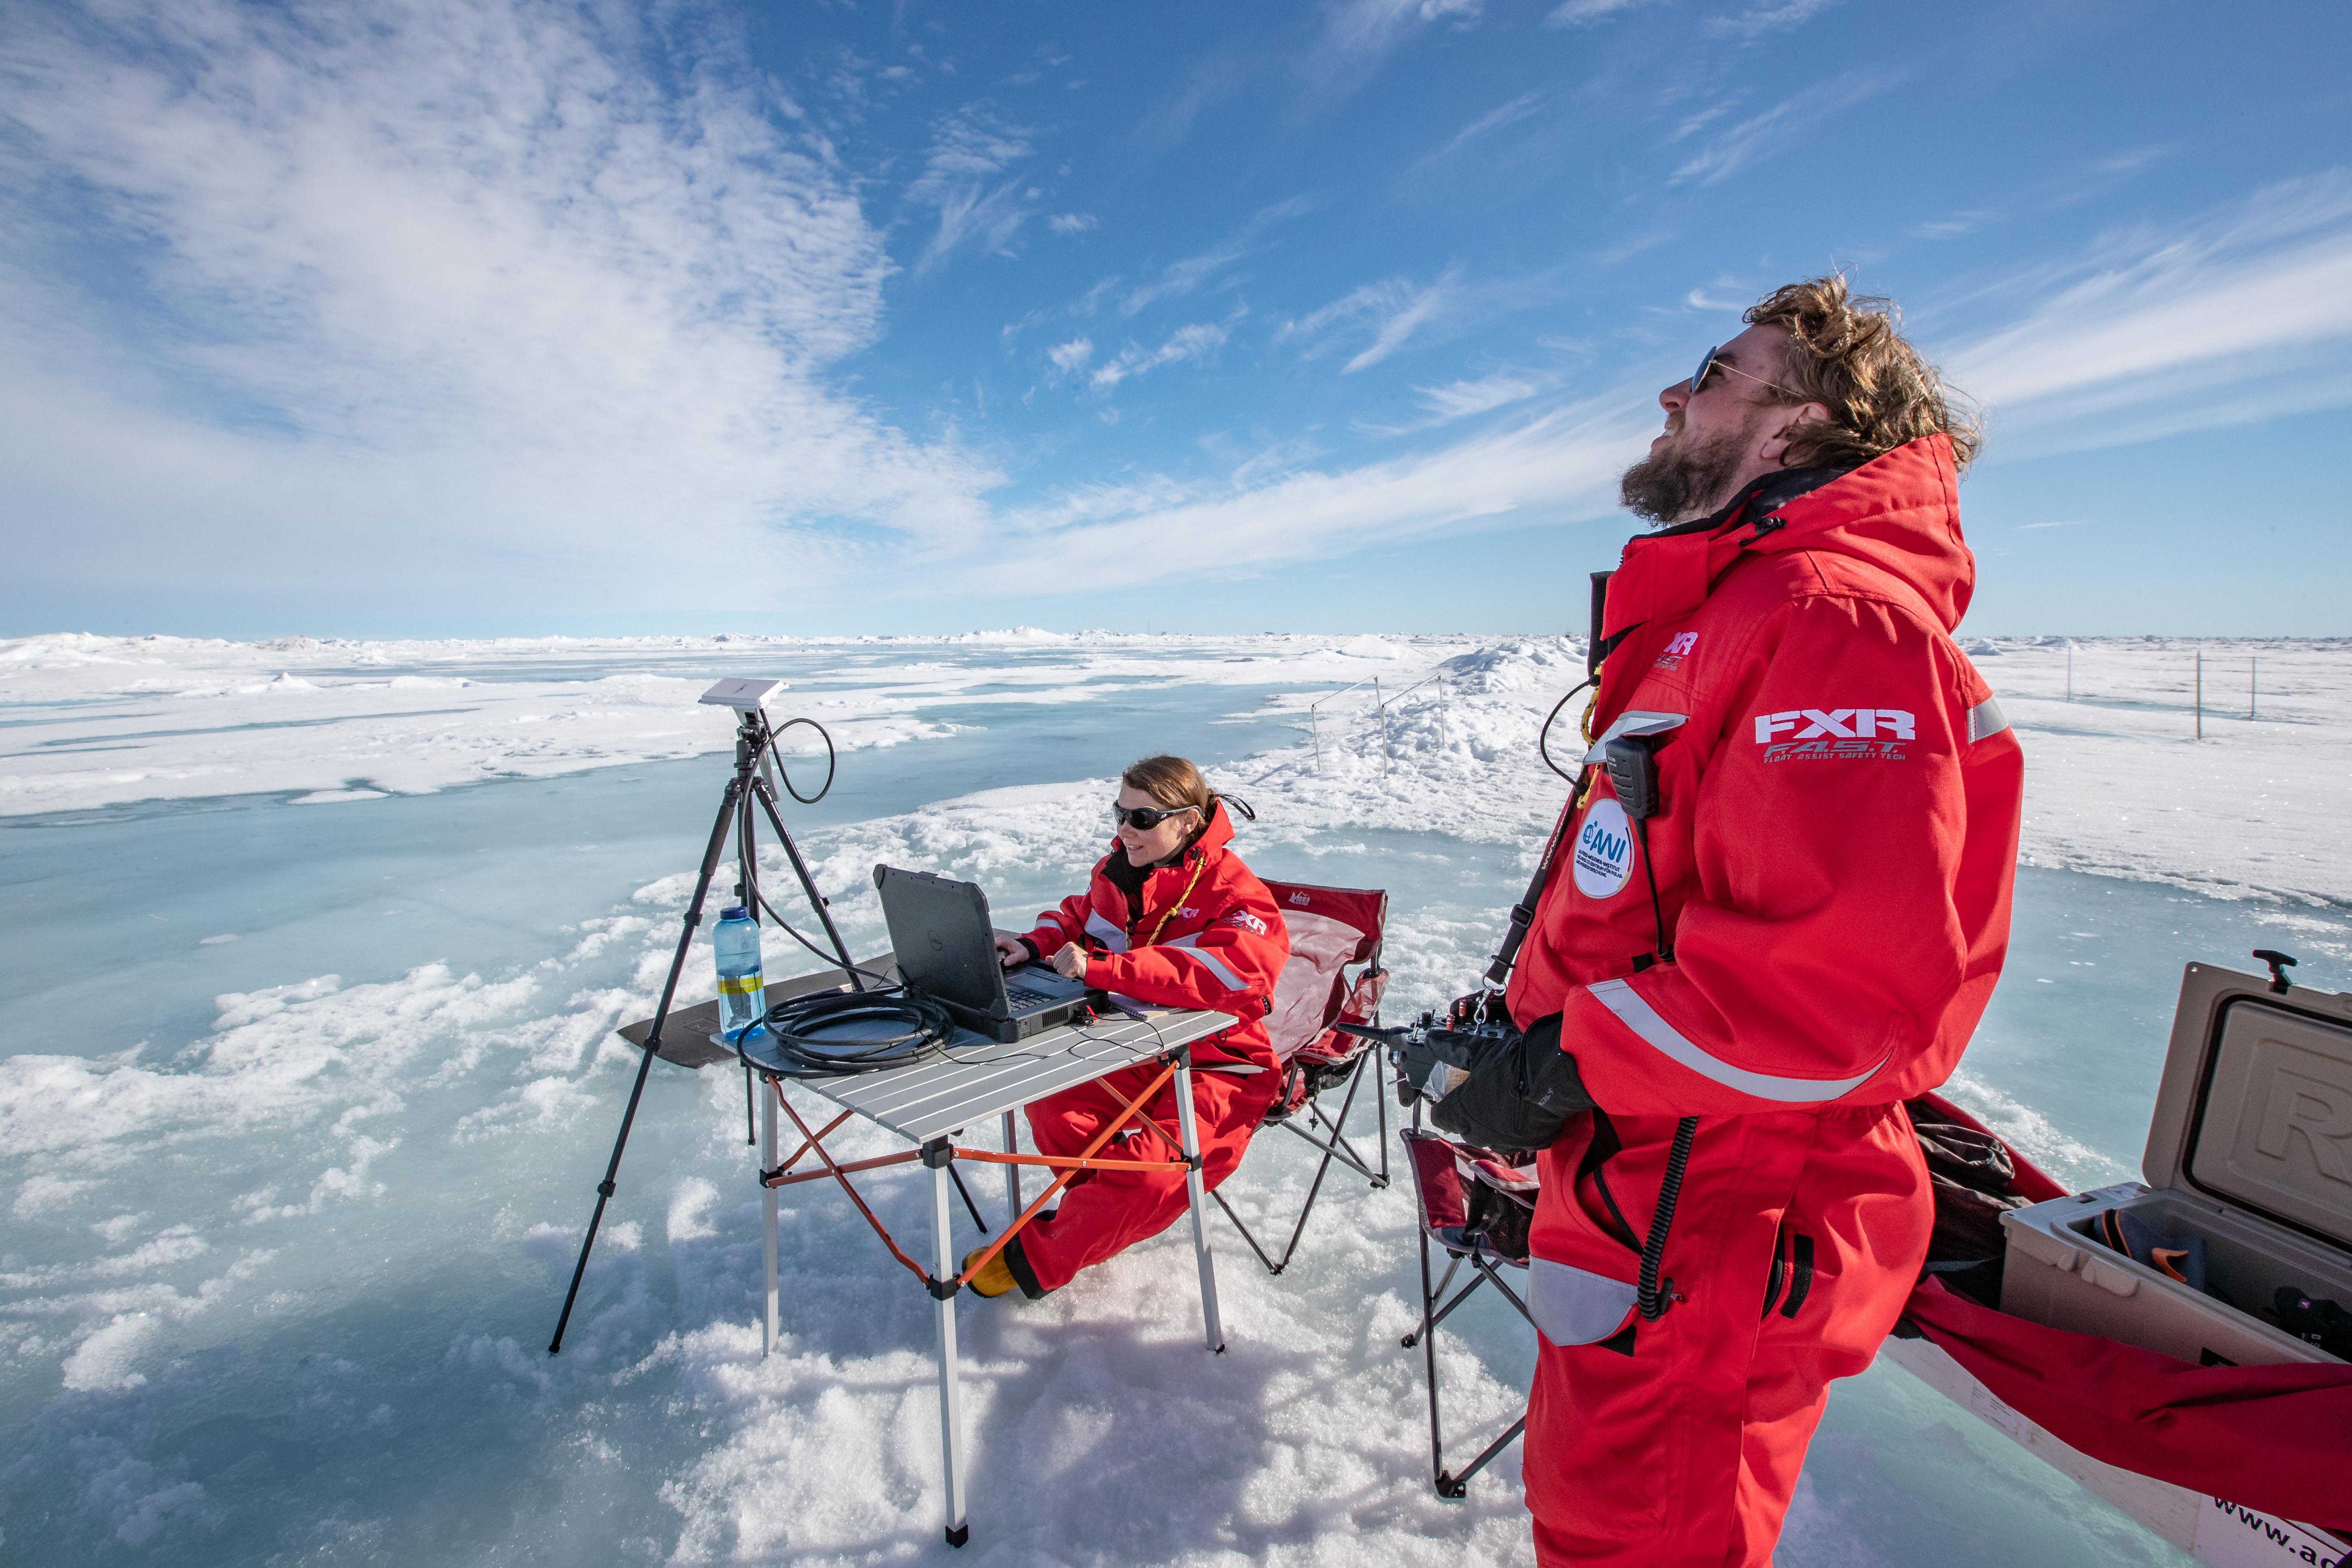
Photo (R): Atmospheric scientists Radiance Calmer and Jonathan Hamilton conduct drone operations on the ice at Droneville. Photo credit: Lianna Nixon, CIRES
In any case, diurnal variability has motivated people to go for a 24-hour cycle, from noon yesterday until noon today. Add in the regular daily operations (starting 9 am yesterday and ending 5:30 pm today) and we really had a 32.5-hour sampling period. Lots of coordination of activities; people going out on the ice at all hours of the night. Extra activities. Many more samples. A special tent was set up on the ice for resting and coffee. And there were lots of volunteers for so many different tasks; so many extra hands needed to pull this off. I spent time maintaining my own measurements as usual. But also helped with some balloon operations with this immense tethered balloon called Beluga. Then I went for a couple hours to Ocean City where they were doing continuous profiles down then up to monitor the evolution of the ocean structure. At night I stayed up until 3 am, taking the first slot of the cruise leadership position while Markus slept for a few hours. I was then able to sleep after 3 am until my bear guarding at 8 am for a team recovering some sediment traps at 8 am. Then back onto routine maintenance and checks on our operational equipment. Lots of work. Lots of science. In looking at our data, there wasn’t much variability in some of the near-surface energy transfer. But it will be interesting to see what the other work reveals about ocean structure, atmospheric boundary layer development, ecosystem functionality, and more.
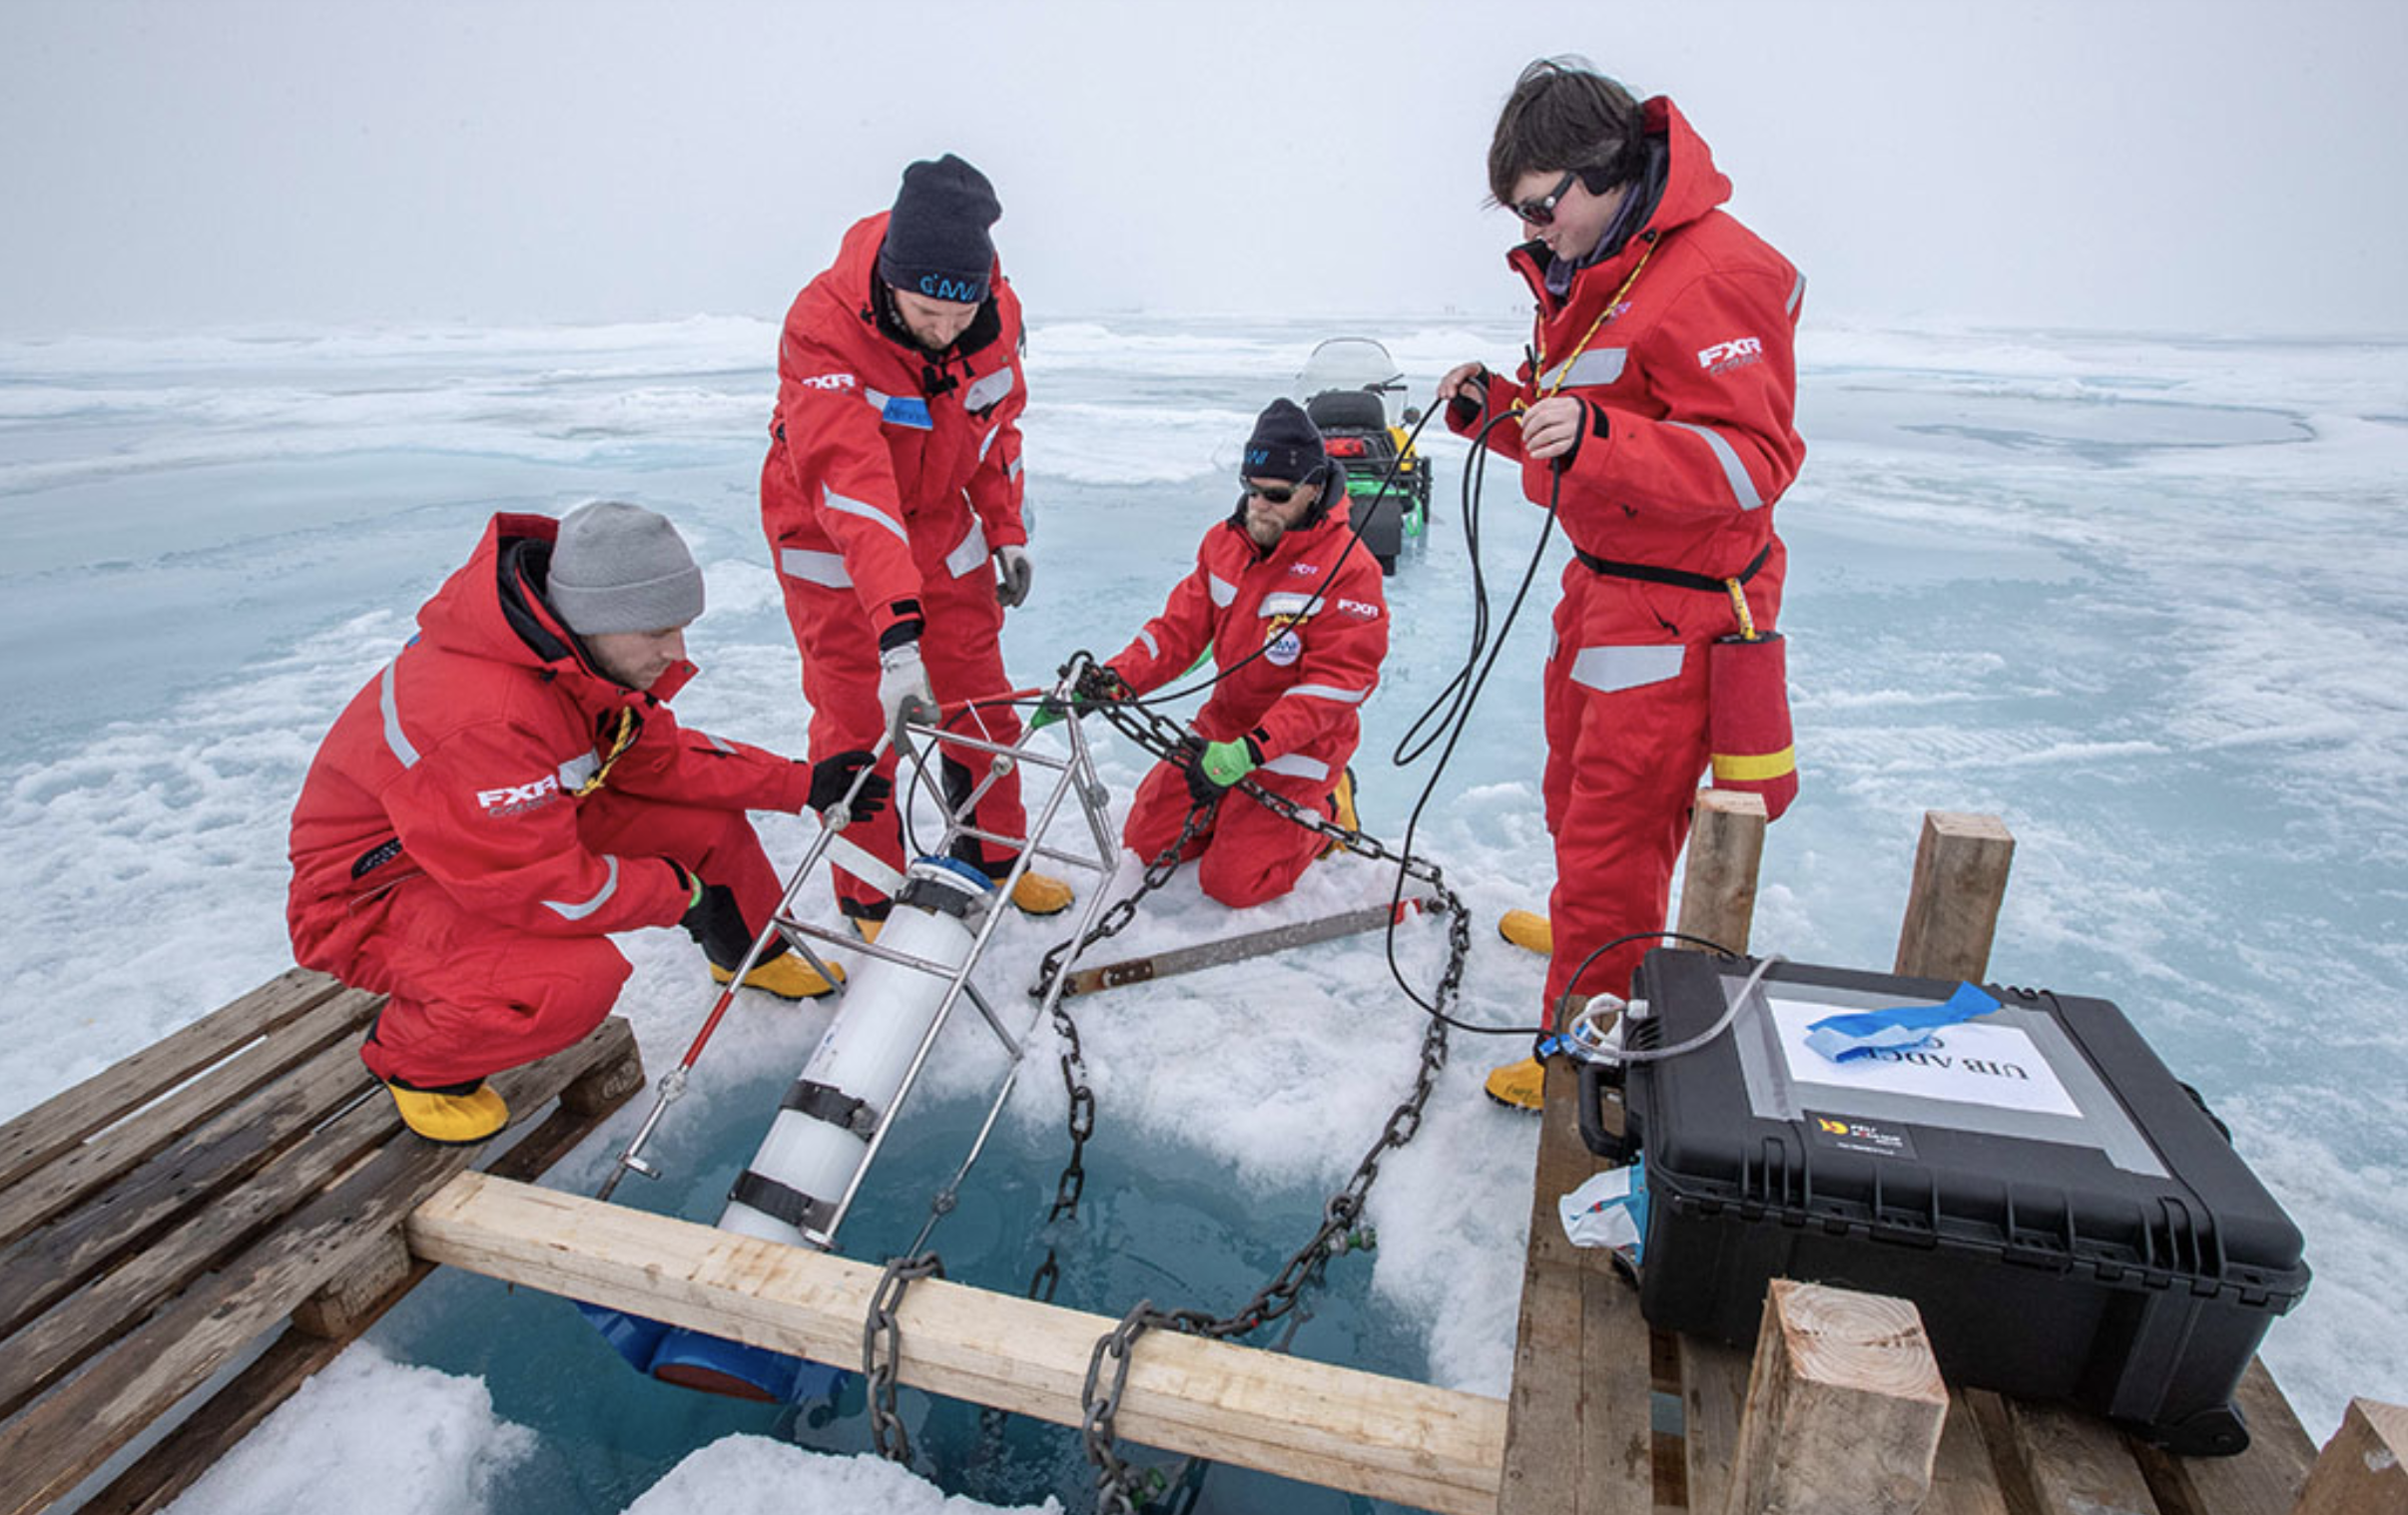
Photo (L): Team Ocean deploys an Acoustic Doppler Current Profiler (ADCP) underneath the sea ice. The ADCP measures the direction and speed of ocean currents. Photo credit: Lianna Nixon, CIRES
Read Matthew Shupe's and other MOSAiC team members' blogs
 #askmosaic: Send us your questions!
Are you curious what it is like to live on a ship in the middle of the Arctic for months at a time? Do you want to know more about what MOSAiC scientists are studying and how? Send us your questions, and we'll ask MOSAiC scientists and crew members to answer them. Questions and answers will be featured each week in MOSAiC Monday and on our #askmosaic page. Here are ways you can submit your #askmosaic questions:
1. Fill out a question submission form
2. Send us your questions via email: mosaic@colorado.edu
3. Ask your questions on social media using the hashtag #askmosaic
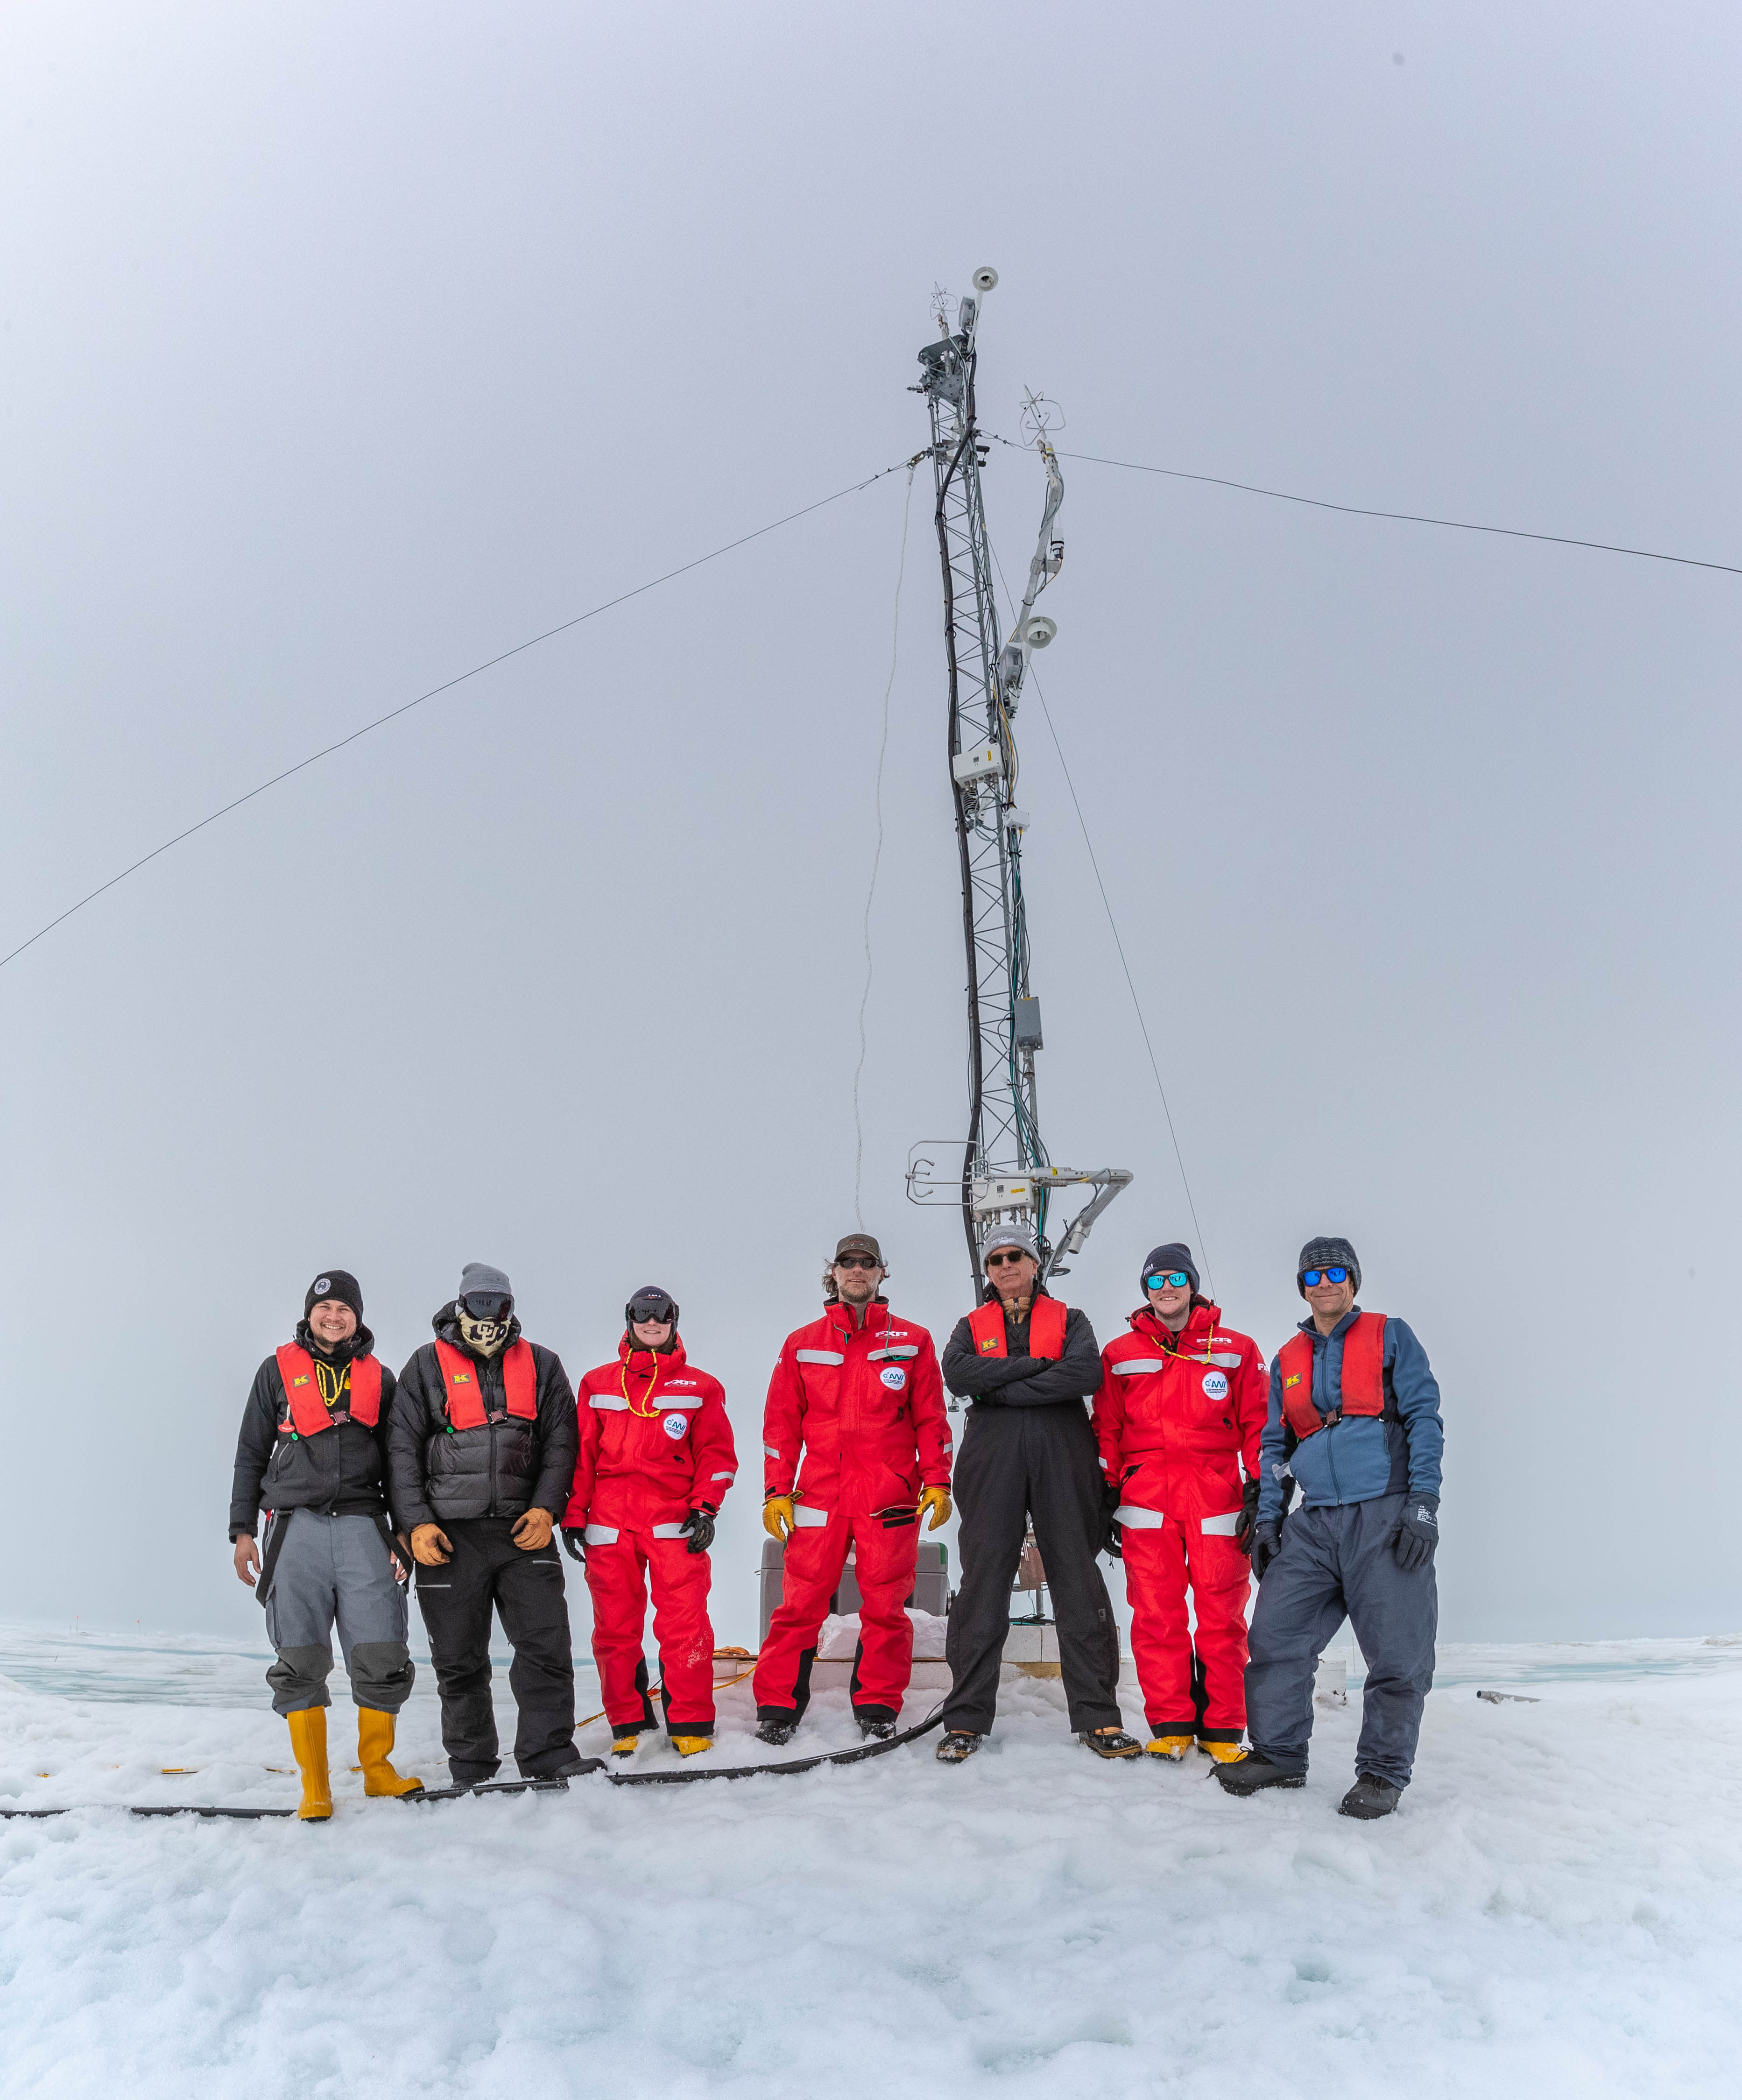
Photo: Assembly team for the MET City meteorological tower; Photo credit: Lianna Nixon, CIRES
 MOSAiC Virtual Summer Camp
Did you or your kids have summer camp plans that fell through because of COVID? Not to worry! Tune in to MOSAiC Monday each week for a fun, hands-on and engaging virtual summer camp activity related to MOSAiC or the Arctic. All MVSC activities should be done with parent supervision!
This Week's Activity: Make a MOSAiC Diorama
Natural history museums are ways for people to see and experience things that either happened in the past or are difficult to experience directly. Museums allow us to visualize what it might have been like to roam among the dinosaurs millions of years ago, or to dive to the deepest depths of the ocean in a submersible looking for extreme life. The MOSAiC expedition is something that the vast majority of people won't be able to experience directly, but there are ways they can experience it indirectly.
In this virtual summer camp activity, we challenge you to create a diorama, or mini museum exhibit, about the MOSAiC expedition. A diorama is just a three-dimensional miniature model of something. You can make your MOSAiC diorama about whatever you like, but if you need help getting started, here are some ideas:
- MOSAiC research on the ice
- Living on the icebreaker Polarstern
- The Arctic landscape and wildlife
What you will need:
- Shoebox, cardboard box, or some other small container that you can glue things to and/or draw on
- Paper and pencil
- Diorama materials, such as:
- Printed out photos from MOSAiC
- Construction paper
- Scissors
- Tape and/or glue
- Washable markers
- Other craft materials of your choosing!
What to do:
- Make sure at least one side of your box is open. If you are using a shoebox, this just means take the lid off of the shoebox. Turn the shoebox on its long side and put the lid inside the shoebox upside down to create a sort of floor for your diorama (see picture). If you are using a box with flaps, have someone help you cut three of the flaps off of the box. Get creative! If you think of a different way to set up the box that will contain your diorama than what is described here, go for it!
- Using your paper and pencil, draw out your idea for what you want your diorama to look like. What story do you want to tell? What kinds of things do you want it to show? How are you going to construct these things? What materials will you use?
- Build your MOSAiC diorama.
- Share your diorama! Show your friends and family, or take a picture of it and submit it to be showcased in our Museum of MOSAiC Art.
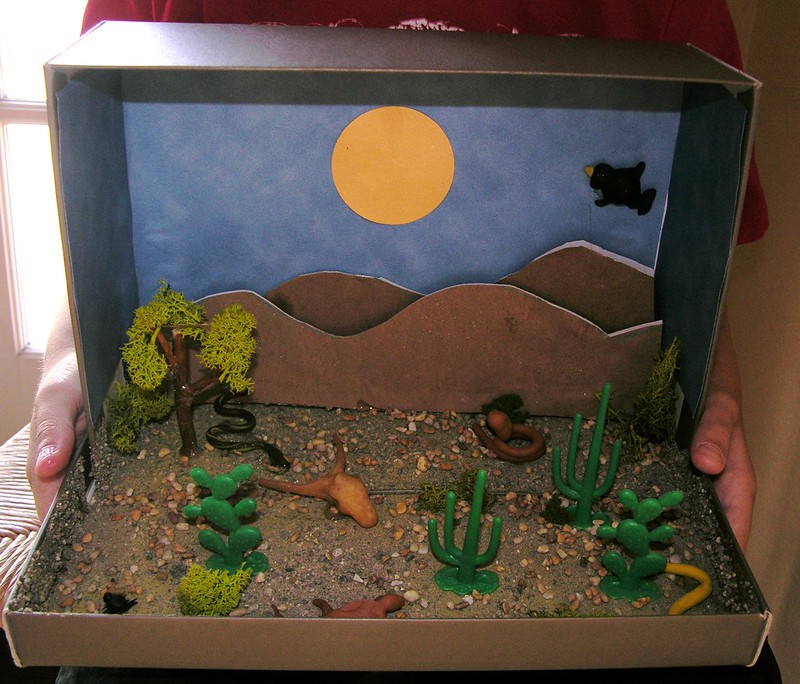
Photo: Example of a shoebox diorama showing the Mojave Desert. Photo credit: kinwart
Submit your MOSAiC diorama to the Museum of MOSAiC Art
Check out this website for instructions on how to create a shoebox diorama
Browse examples of dioramas on Pinterest for inspiration
Check out our full list of virtual and at-home polar learning resources!
 Educators' Corner
The school year has ended for most K-12 students and teachers in many places, which means that it's time for professional development workshops, fall curriculum planning, and hopefully a bit of relaxation time! Each week throughout the summer, we'll use Educators' Corner to highlight MOSAiC and Arctic-related lessons, multimedia resources, and other educational materials that you can use in your NGSS (or similar) classroom, in person or remotely. Are you looking for a particular kind of educational resource? Let us know! Email us at mosaic@colorado.edu.
For Your Classroom: Virtual Expeditions
With so much uncertainty surrounding what school will look like for K-12 students and teachers in the fall, we'd like to share a few educational resources that can be utilized both in-person and virtually. Your students can experience firsthand what it is like to be an Arctic explorer with these three 360-degree immersive experiences. All that is needed is a web browser, however two of these experiences can also be viewed as virtual reality experiences using Google Cardboard and the Google Expeditions app:
1. Explore the Arctic Aboard the Fram Virtual Expedition
In 1893 Fridtjof Nansen successfully froze a specially-designed ship, the Fram, into Arctic sea ice in an attempt to drift to the North Pole. Take a virtual stroll through the Fram and learn all about Nansen and his crew's adventures in the Arctic with this virtual expedition.
2. MOSAiC Distributed Network Virtual Expedition
The MOSAiC expedition aims to better understand the changing Arctic climate system. At the heart of the MOSAiC expedition is the German icebreaker, Polarstern, which was transformed into a drifting climate observatory for an entire year. To study the system at both a local and regional scale, the Russian vessel, Akademik Fedorov, deployed a network of research stations (distributed network) on ice up to 50 km from the Polarstern. See what it’s like to do fieldwork in the Arctic!
3. Tour the Polarstern in 360-Degrees
What is it like on board the icebreaker Polarstern? Step on board and take a tour in this 360-degree virtual experience! Check out the scientific lab spaces, enjoy a virtual meal inside one of the mess rooms, and be sure to relax in the on-board sauna.
 MOSAiC Weekly Tracking
Plot the Polarstern
Each week we will provide you with the latitude and longitude coordinates of the Polarstern so that you can track its journey across the Arctic.
Download the map to plot coordinates
Download a larger map of the Arctic for a bigger picture view of the expedition area
Location of the Polarstern
| Date | Latitude | Longitude |
| September 16, 2019 | 69.68 N | 18.99 E |
| September 23, 2019 | 72.31 N | 26.93 E |
| September 30, 2019 | 85.12 N | 138.05 E |
| October 4, 2019** | 85.08 N | 134.43 E |
| October 7, 2019 | 85.10 N | 133.82 E |
| October 14, 2019 | 84.85 N | 135.03 E |
| October 21, 2019 | 84.97 N | 132.73 E |
| October 28, 2019 | 85.47 N | 127.07 E |
| November 4, 2019 | 85.88 N | 121.70 E |
| November 11, 2019 | 85.82 N | 116.00 E |
| November 18, 2019 | 86.05 N | 122.43 E |
| November 25, 2019 | 85.85 N | 121.35 E |
| December 2, 2019 | 85.97 N | 112.95 E |
| December 9, 2019 | 86.25 N | 121.40 E |
| December 16, 2019 | 86.62 N | 118.12 E |
| December 23, 2019 | 86.63 N | 113.20 E |
| December 30, 2019 | 86.58 N | 117.13 E |
| January 6, 2020 | 87.10 N | 115.10 E |
| January 13, 2020 | 87.35 N | 106.63 E |
| January 20, 2020 | 87.42 N | 97.77 E |
| January 27, 2020 | 87.43 N | 95.82 E |
| February 3, 2020 | 87.42 N | 93.65 E |
| February 10, 2020 | 87.78 N | 91.52 E |
| February 17, 2020 | 88.07 N | 78.52 E |
| February 24, 2020 | 88.58 N | 52.87 E |
| March 2, 2020 | 88.17 N | 31.02 E |
| March 9, 2020 | 87.93 N | 24.20 E |
| March 16, 2020 | 86.87 N | 12.70 E |
| March 23, 2020 | 86.20 N | 15.78 E |
| March 30, 2020 | 85.37 N | 13.27 E |
| April 6, 2020 | 84.52 N | 14.38 E |
| April 13, 2020 | 84.28 N | 14.97 E |
| April 20, 2020 | 84.52 N | 14.57 E |
| April 27, 2020 | 83.93 N | 15.65 E |
| May 4, 2020 | 83.92 N | 18.03 E |
| May 11, 2020 | 83.47 N | 13.08 E |
| May 18+, 2020 | 83.32 N | 8.68 E |
| May 25+, 2020 | 82.43 N | 8.28 E |
| June 1+, 2020 | 81.33 N | 9.93 E |
| June 8+, 2020 | 78.10 N | 12.73 E |
| June 15+, 2020 | 82.20 N | 8.18 E |
| June 22, 2020 | 81.95 N | 9.27 E |
| June 29, 2020 | 82.03 N | 9.88 E |
| July 6, 2020 | 81.67 N | 5.22 E |
| July 13, 2020 | 81.40 N | 0.28 E |
| July 20, 2020 | TBD | TBD |
**Day when MOSAiC reached the ice floe that the Polarstern will become frozen in and drift with for the next year.
+ Indicates when the Polarstern traveled under its own engine power (no drifting)
Log MOSAiC Data
Keep track of Arctic conditions over the course of the expedition:
Download Data Logbook for Sept. 2019 - Dec. 2019
Download Data Logbook for Dec. 2019 - Mar. 2020
Download Data Logbook for Mar. 2020 - June 2020
Download Data Logbook for July 2020 - Oct. 2020
| Date | Length of day (hrs) | Air temperature (deg C) at location of Polarstern | Arctic Sea Ice Extent (million km2) |
| September 16, 2019 | 13.25 | High: 10 Low: 4.4 | 3.9 |
| September 23, 2019 | 12.35 | High: 6 Low: -1 | 4.1 |
| September 30, 2019 | 9.1 | -4.7 | 4.4 |
| October 4, 2019** | 6.27 | -13.0 | 4.5 |
| October 7, 2019 | 3.05 | -8.2 | 4.6 |
| October 14, 2019 | 0 | -14.7 | 4.8 |
| October 21, 2019 | 0 | -12.8 | 5.4 |
| October 28, 2019 | 0 | -18.3 | 6.8 |
| November 4, 2019 | 0 | -18.9 | 8.0 |
| November 11, 2019 | 0 | -25.5 | 8.7 |
| November 18, 2019 | 0 | -10.7 | 9.3 |
| November 25, 2019 | 0 | -18.4 | 10.0 |
| December 2, 2019 | 0 | -26.6 | 10.4 |
| December 9, 2019 | 0 | -23.1 | 11.2 |
| December 16, 2019 | 0 | -19.2 | 11.8 |
| December 23, 2019 | 0 | -26.9 | 12.2 |
| December 30, 2019 | 0 | -26.4 | 12.6 |
| January 6, 2020 | 0 | -28.0 | 13.0 |
| January 13, 2020 | 0 | -30.7 | 13.1 |
| January 20, 2020 | 0 | -27.1 | 13.6 |
| January 27, 2020 | 0 | -22.5 | 13.8 |
| February 3, 2020 | 0 | -28.8 | 14.1 |
| February 10, 2020 | 0 | -26.2 | 14.5 |
| February 17, 2020 | 0 | -31.9 | 14.4 |
| February 24, 2020 | 0 | -24.0 | 14.6 |
| March 2, 2020 | 0 | -35.5 | 14.8 |
| March 9, 2020 | 0 | -37.9 | 14.7 |
| March 16, 2020 | 10.5 | -27.5 | 14.7 |
| March 23, 2020 | 16.5 | -28.7 | 14.4 |
| March 30, 2020 | 24 | -28.6 | 14.0 |
| April 6, 2020 | 24 | -18.2 | 13.7 |
| April 13, 2020 | 24 | -25.8 | 13.6 |
| April 20, 2020 | 24 | -10.2 | 13.3 |
| April 27, 2020 | 24 | -11.7 | 12.8 |
| May 4, 2020 | 24 | -16.2 | 12.8 |
| May 11, 2020 | 24 | -10.4 | 12.4 |
| May 18, 2020 | 24 | -5.1 | 11.7 |
| May 25, 2020 | 24 | 0.4 | 11.5 |
| June 1, 2020 | 24 | 0.0 | 11.1 |
| June 8+, 2020 | 24 | -0.1 | 10.6 |
| June 15+, 2020 | 24 | -0.4 | 10.1 |
| June 22, 2020 | 24 | -0.4 | 9.6 |
| June 29, 2020 | 24 | 0.5 | 9.2 |
| July 6, 2020 | 24 | 0.6 | 8.2 |
| July 13, 2020 | 24 | 0.2 | 7.2 |
| July 20, 2020 | 24 | TBD | TBD |
*Note: We expect data to fall within the following ranges: Length of day, 0-24 hours; Temperature, -40 to 14 degrees C; Sea ice extent, 3-15 million km2
**Day when MOSAiC reached the ice floe that the Polarstern will become frozen in and drift with for the next year.
Is there something you'd like to see in MOSAiC Monday? Let us know!
Send us your feedback
New to MOSAiC Monday? Check out past editions!
Browse more expedition-related educational resources, videos, and blogs
Email us! mosaic@colorado.edu