Polar Bear at the Polarstern...Again!
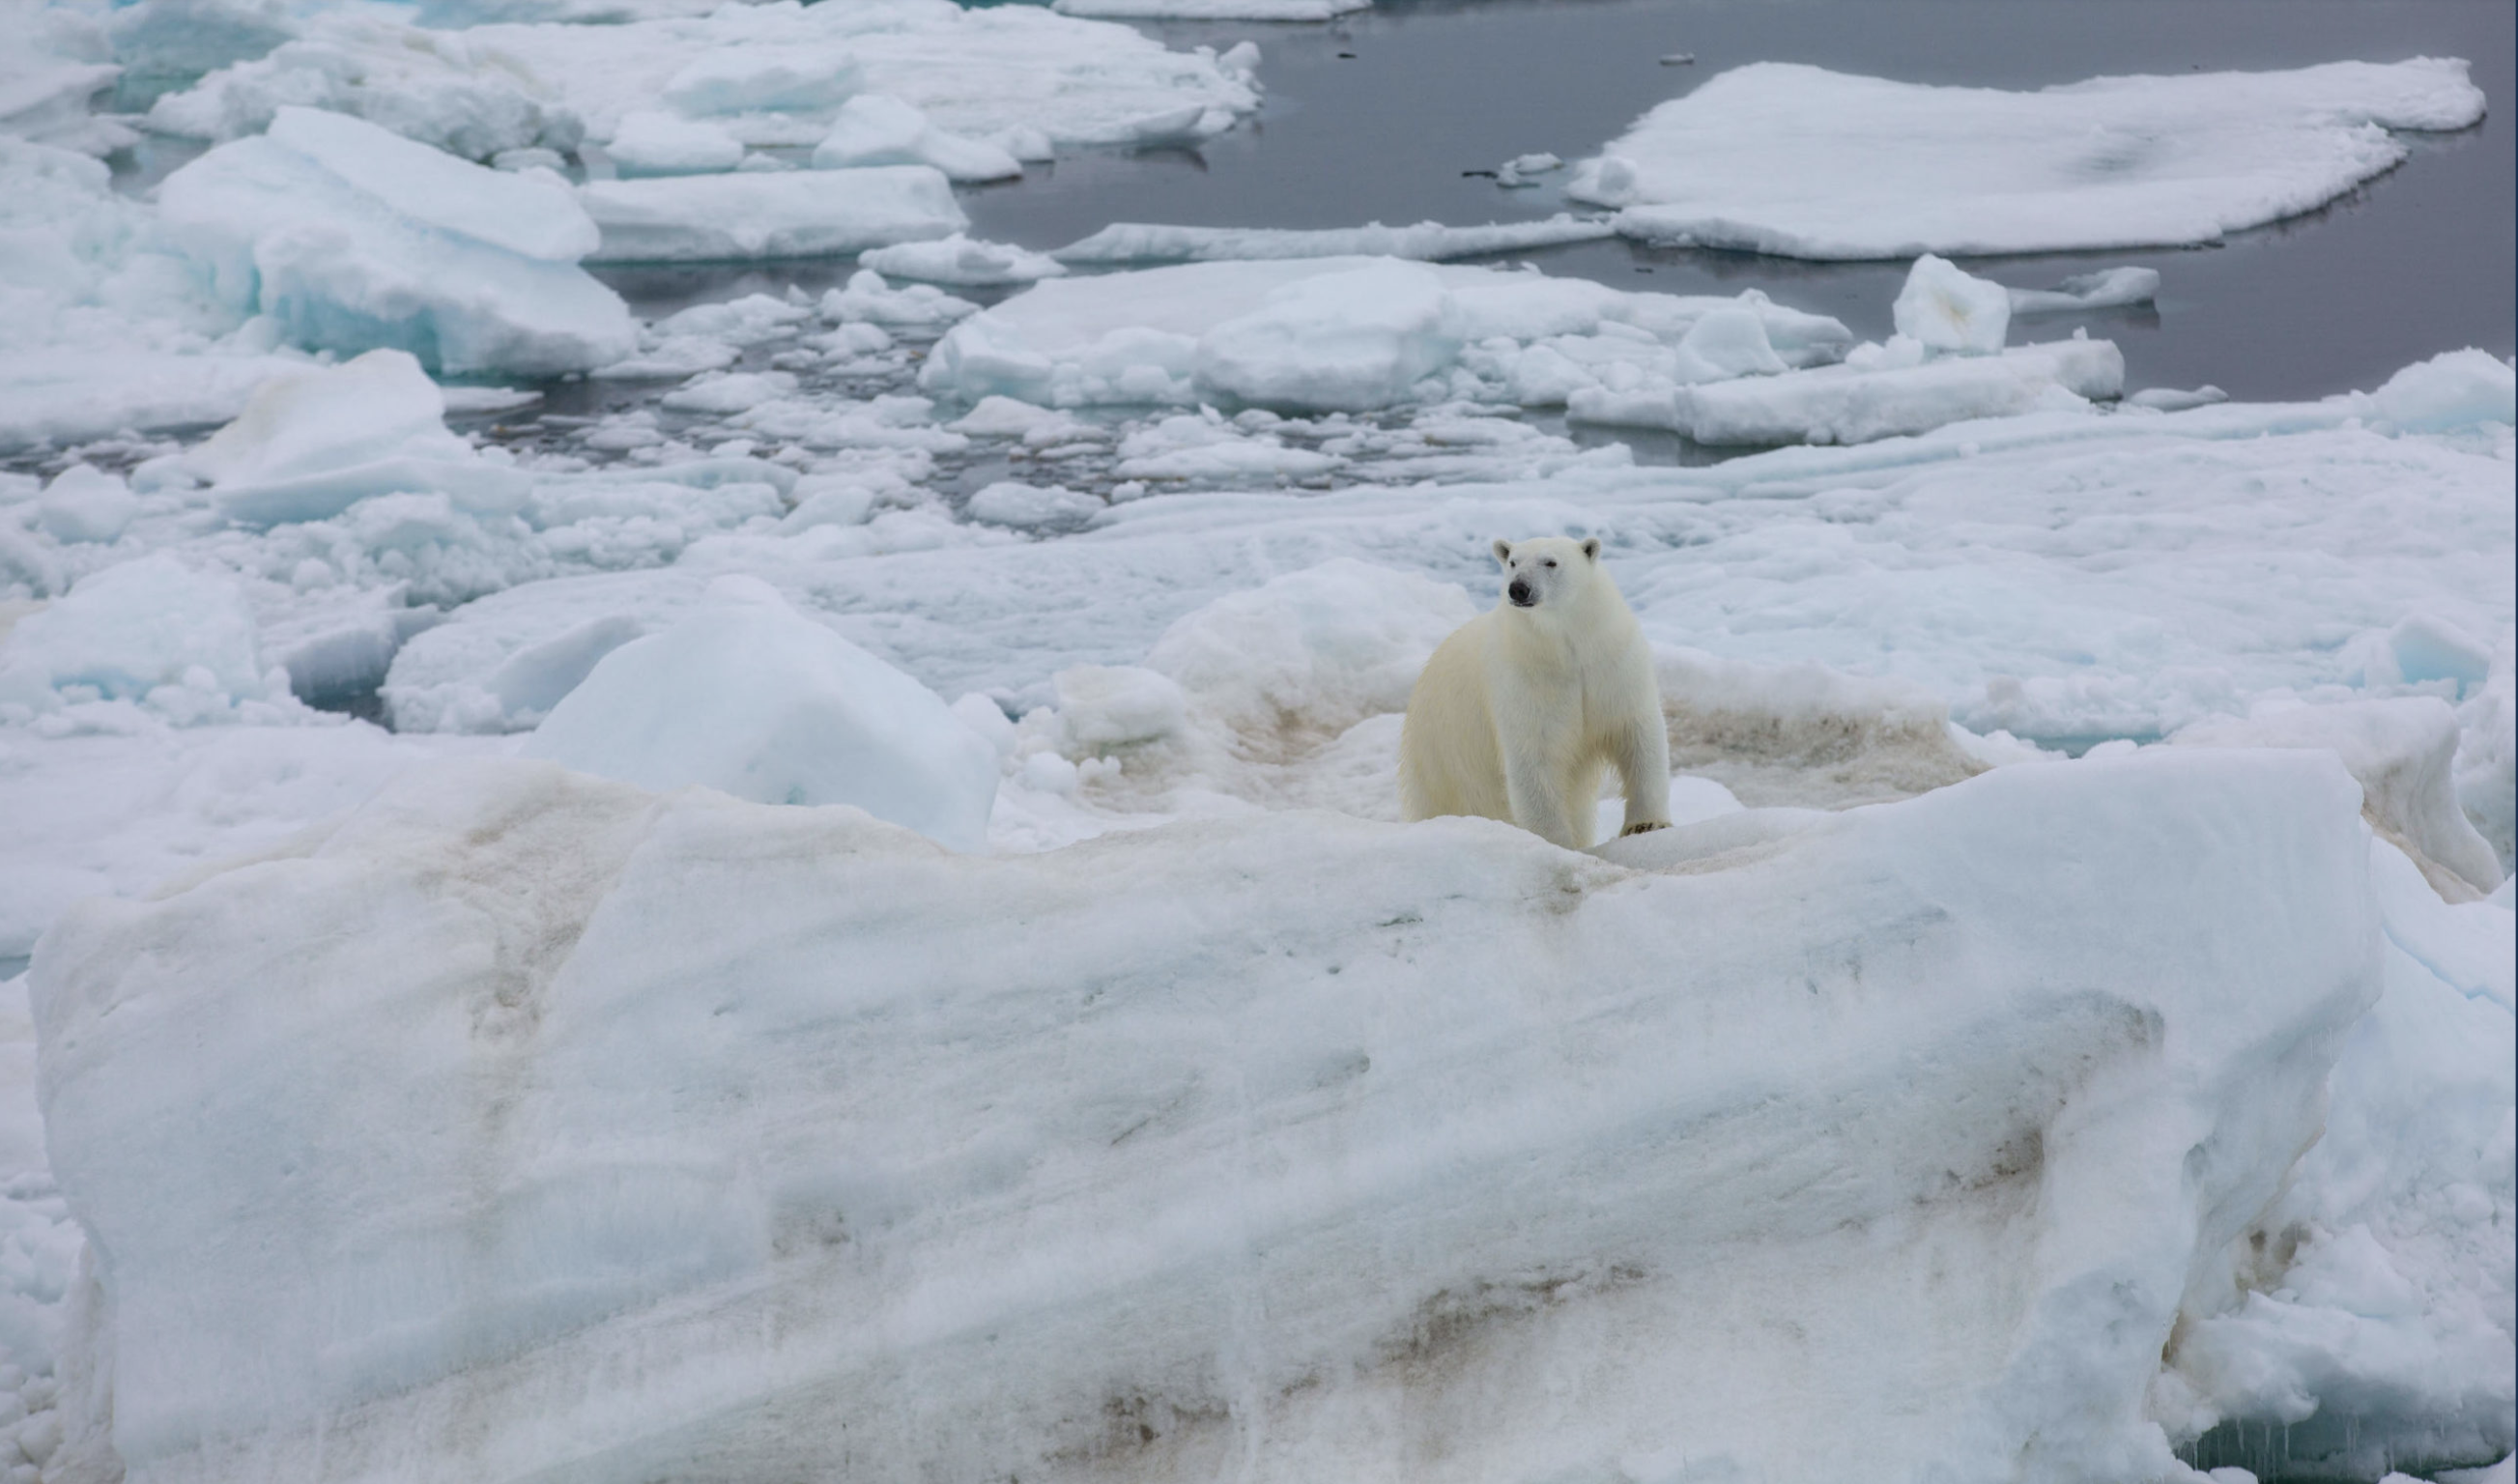
The Polarstern was visited by yet another polar bear recently - this one showed up to check out the research camps just as scientists were about to make their way onto the ice! Fortunately the MOSAiC crew has many protocols in place to watch for and spot polar bears and to keep both the MOSAiC team members and polar bears safe. Any time researchers are on the ice, there are polar bear guards keeping watch. Trip wires are also set up around the perimeter of the research camps to alert the team of any particularly sneaky polar bears. Photo by Lisa Grosfeld
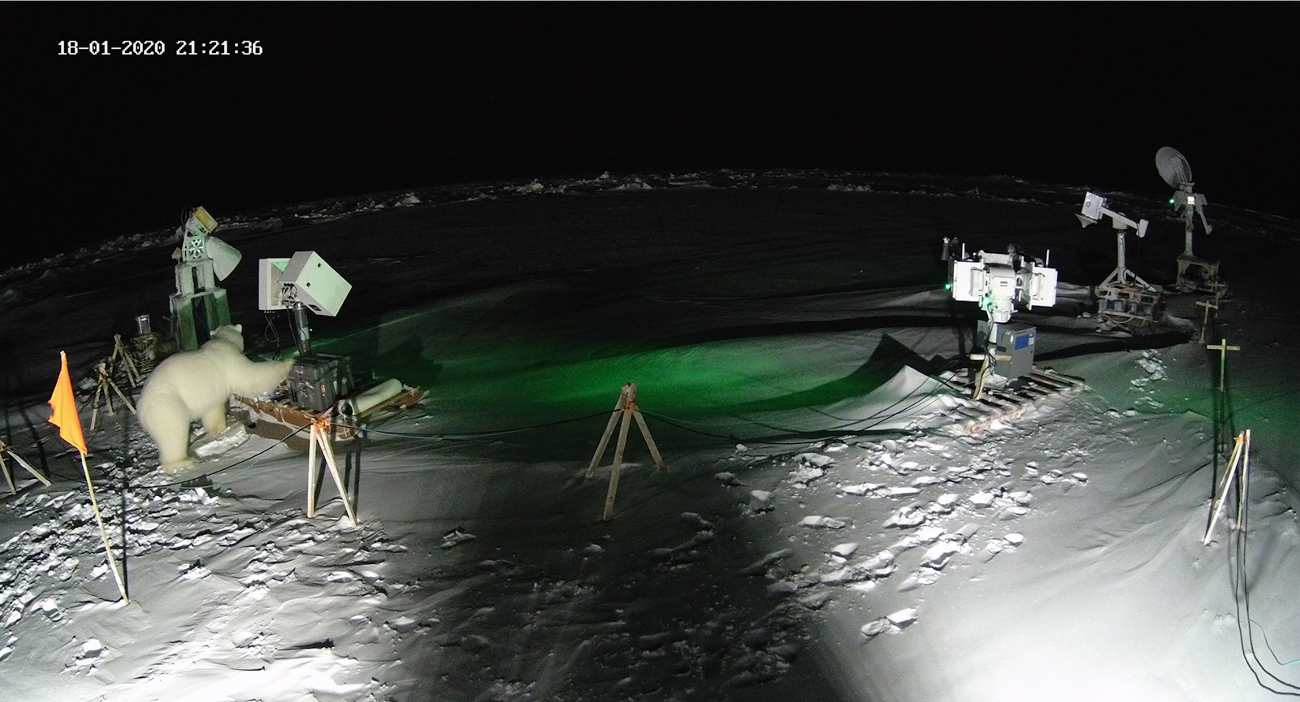
If you've been following MOSAiC Monday, you might remember when a polar bear was caught on camera rearranging some scientific equipment on the ice back in January. Here is the MOSAiC web app blog post from that day:
On Sunday morning Marcus Huntemann from the remote sensing team noticed the radiometer feedhorns of an instrument deployed on the ice were looking in different directions than before. He immediately checked the photos from a nearby camera, which takes photos automatically every five minutes. To his great surprise he discovered the reason for the disorder: One and only one photo showed a polar bear checking out the instruments at the remote sensing site shortly after midnight, Luckily, it approached the site quite carefully and only ripped the covering of the antenna tracker but did not damage any other installations and cautiously stepped over cables without ripping them....This polar bear visit was surprising to some of us and demonstrated that we still need to be observant and well prepared even in the death of winter. However, work continued unaffected because we have all the means to peacefully coexist with our furry Arctic neighbours. Photo credit: AWI
Follow the Polarstern and read daily updates on the MOSAiC Web App
 #askmosaic: Hot and Cold
This week's question was submitted by Daniel from Middleton Middle School: Which month is the coldest month in the Arctic? Hottest?
Great question! We've been tracking conditions in the Arctic now since last September (see MOSAiC Weekly Tracking below). What do you notice about how the temperatures in the Arctic have changed with the seasons? How cold did it get in the Arctic winter? What have temperatures been like recently, during the Arctic summer? With the data that we have, what can you say about what have been the coldest and warmest months in the Arctic so far during the MOSAiC expedition? How do these temperature ranges compare to where you live?
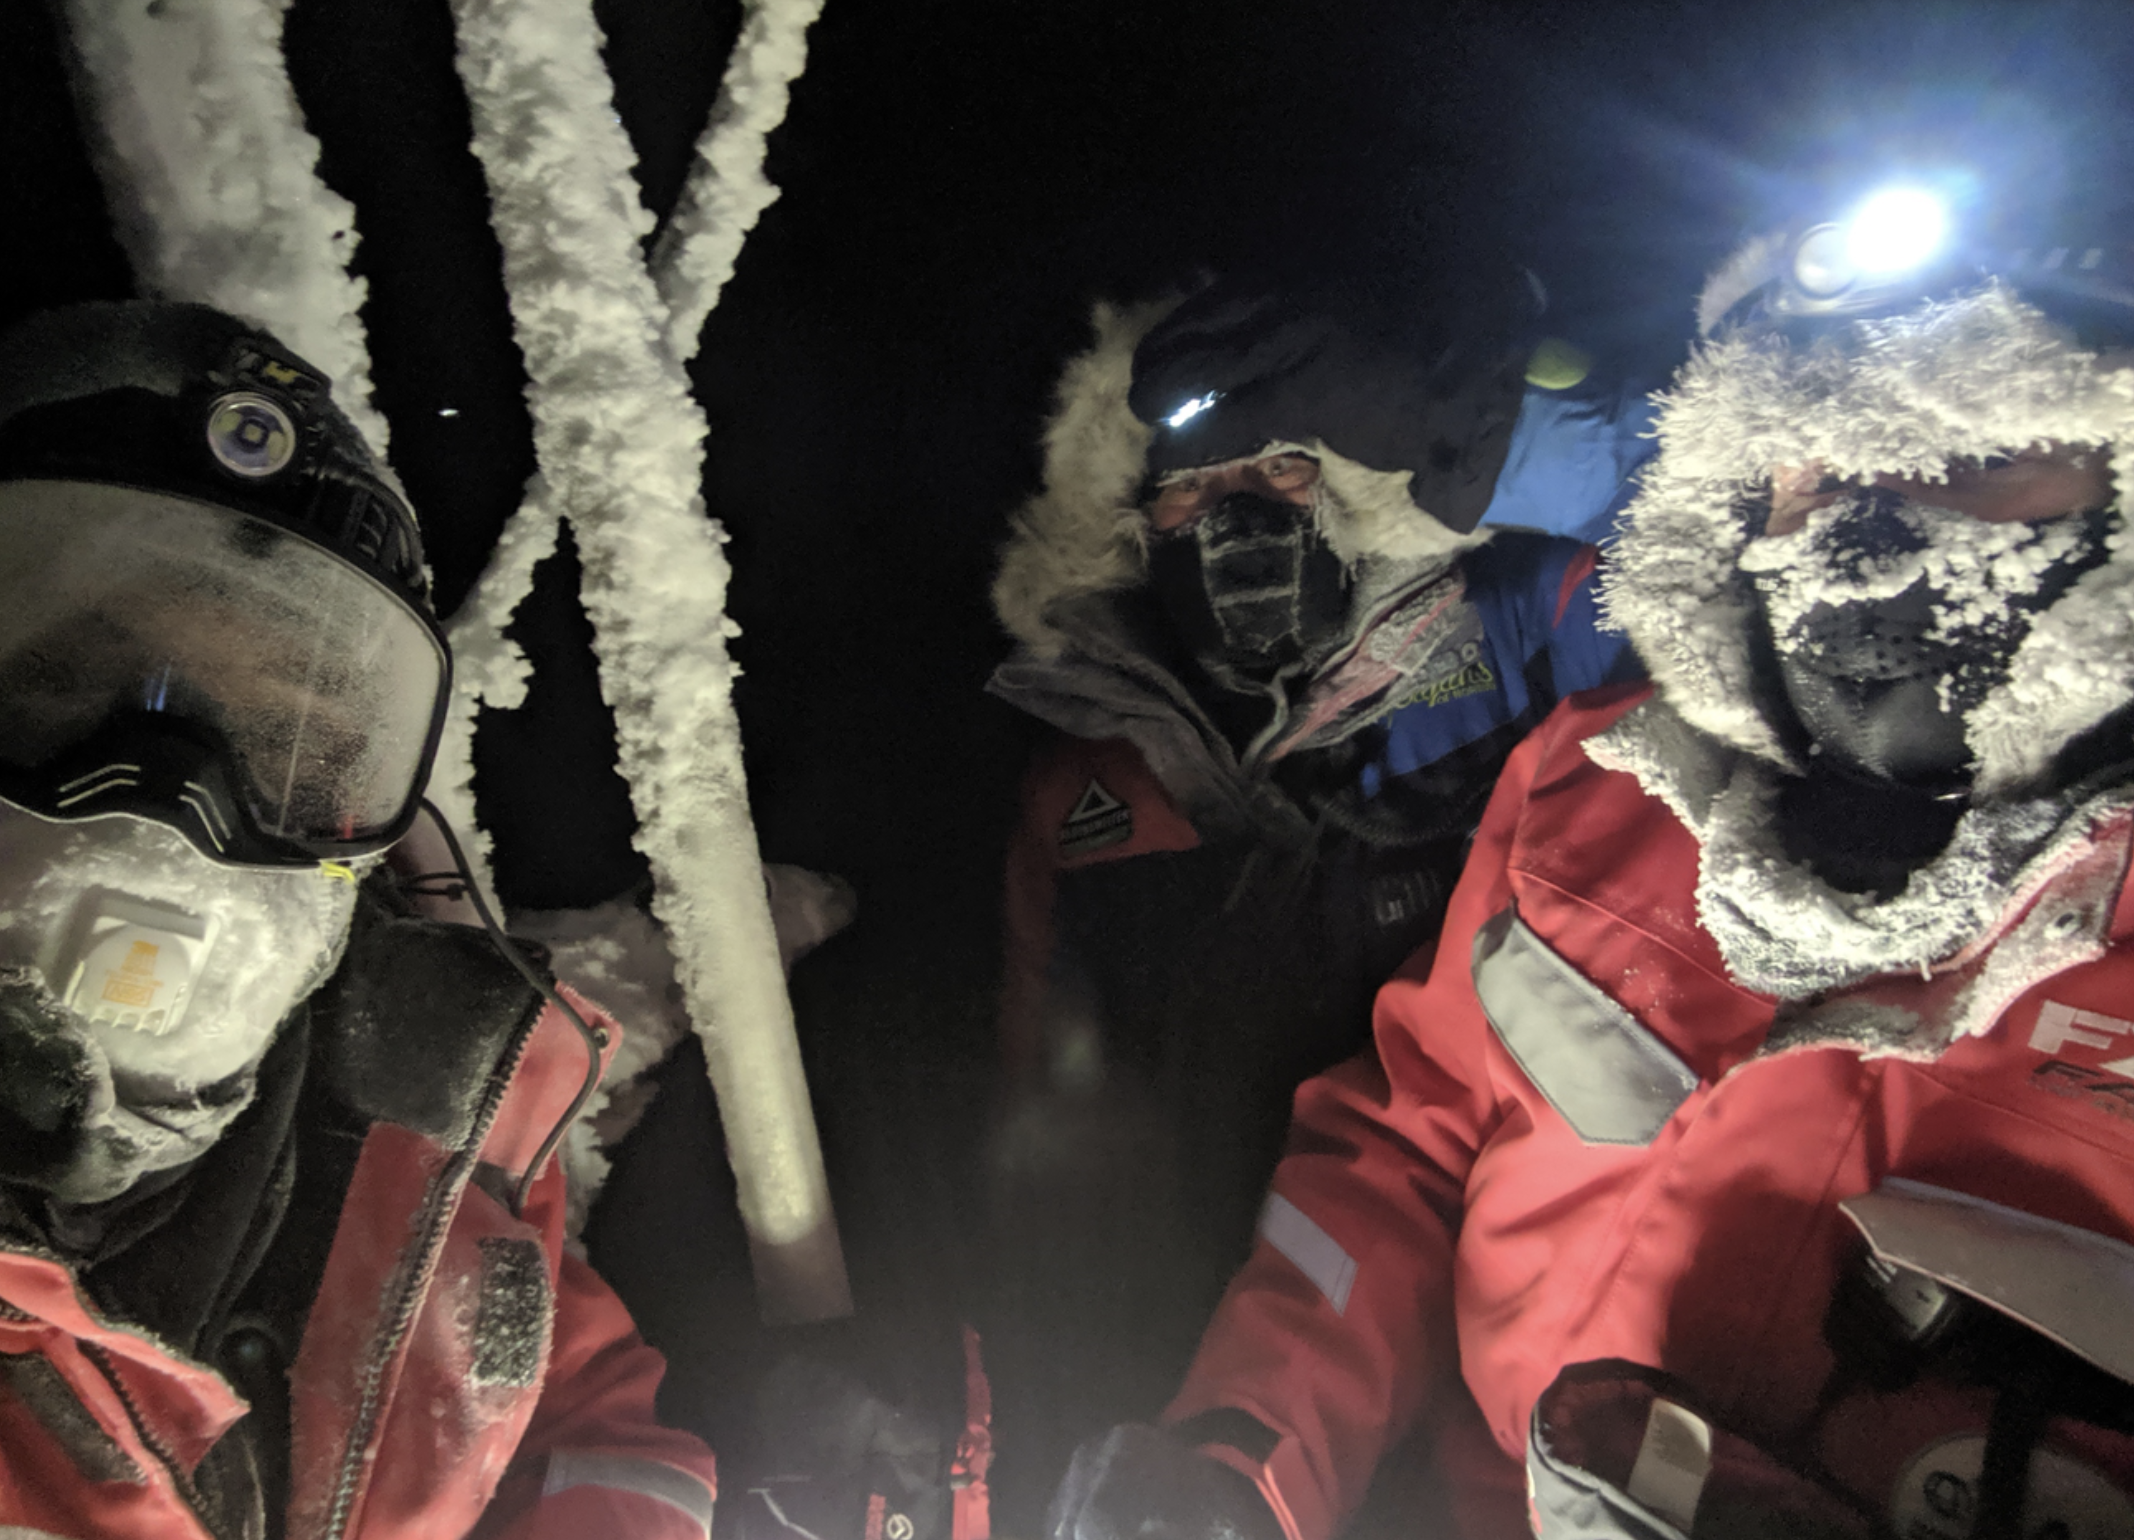
Photo of Team Atmosphere members Dave Costa (L) and Ola Persson (R) with polar bear guard Hans Honold, taken in November, 2019 when the air temperature was -28 degrees C! Photo credit: Dave Costa
Curious about the Arctic and MOSAiC expedition? Here are three ways you can send us your #askmosaic questions:
1. Submit them
2. Email them: mosaic@colorado.edu with subject line "#askmosaic"
3. Tag us on social media: #askmosaic
 MOSAiC Virtual Summer Camp
Did you or your kids have summer camp plans that fell through because of COVID? Not to worry! Tune in to MOSAiC Monday each week for a fun, hands-on and engaging virtual summer camp activity related to MOSAiC or the Arctic. All MVSC activities should be done with parent supervision!
This Week's Activity: Measuring Albedo (reflectivity)
When solar radiation reaches Earth, part of the energy is absorbed by the surface, while the rest is reflected back into space. This reflectivity is called albedo and is described using the following equation: Albedo = Solar radiation reflected/Total incoming solar radiation
Albedo (reflectivity) is typically reported on a scale from 0 to 1. Surfaces with high albedo values (closer to 1) reflect more solar radiation, whereas surfaces with low albedo values (closer to 0) reflect less solar radiation. The color of a surface plays a big role in determining how much incoming solar energy is reflected or absorbed.
What you will need:
- Cell phone
- "Albedo: A Reflectance App"
- Albedo App Instructions (Google Slides Presentation here)
- Gray surface (e.g., paper, t-shirt, couch cushion), black paper, white paper, and at least 3 other different colored surfaces
- Arctic sea ice video
What to do:
- Download the "Albedo: A Reflectance App" to your cell phone.
- Follow the App instructions provided in this Google Slides presentation to measure the reflectivity (albedo) of the black paper, the white paper, and at least 3 different colored surfaces.
- Which color surface had the highest albedo (reflectivity)? Which color surface had the lowest albedo?
- Create a rule that describes the relationship between the color of a surface and its albedo.
- Final Thoughts: Arctic sea ice is melting rapidly, resulting in more dark ocean being exposed at the surface as seen in this video. How do you think the Arctic's albedo will change as sea ice continues to decline? How might this change in albedo impact the Arctic?
- Check out the extension activity included at the end of the Google Slides presentation.
Check out our full list of virtual and at-home polar learning resources!
 Educators' Corner
The school year has ended for most K-12 students and teachers in many places, which means that it's time for professional development workshops, fall curriculum planning, and hopefully a bit of relaxation time! Each week throughout the summer, we'll use Educators' Corner to highlight MOSAiC and Arctic-related lessons, multimedia resources, and other educational materials that you can use in your NGSS (or similar) classroom, in person or remotely. Are you looking for a particular kind of educational resource? Let us know! Email us at mosaic@colorado.edu.
For Your Classroom: ArCGIS Living Atlas: Indicators of the Planet - 15 GIS Story Maps
Story Maps are interactive online learning experiences that utilize maps and visually compelling information and data. Check out these Story Maps from Esri's StoryMaps team, complete with infographics, maps, and data to learn more about how climate indicators such as sea ice, carbon dioxide, sea level rise, drought, and others have changed over the past few decades. This resource could be used in classrooms across many science subjects with students investigating 1-2 topics a week, or as a jigsaw activity in which students work individually or in teams to become experts on a specific topic, sharing what they've learned with the whole class.
Explore the Indicators of the Planet Story Map collection
 MOSAiC Weekly Tracking
Plot the Polarstern
Each week we will provide you with the latitude and longitude coordinates of the Polarstern so that you can track its journey across the Arctic.
Download the map to plot coordinates
Download a larger map of the Arctic for a bigger picture view of the expedition area
Location of the Polarstern
| Date | Latitude | Longitude |
| September 16, 2019 | 69.68 N | 18.99 E |
| September 23, 2019 | 72.31 N | 26.93 E |
| September 30, 2019 | 85.12 N | 138.05 E |
| October 4, 2019** | 85.08 N | 134.43 E |
| October 7, 2019 | 85.10 N | 133.82 E |
| October 14, 2019 | 84.85 N | 135.03 E |
| October 21, 2019 | 84.97 N | 132.73 E |
| October 28, 2019 | 85.47 N | 127.07 E |
| November 4, 2019 | 85.88 N | 121.70 E |
| November 11, 2019 | 85.82 N | 116.00 E |
| November 18, 2019 | 86.05 N | 122.43 E |
| November 25, 2019 | 85.85 N | 121.35 E |
| December 2, 2019 | 85.97 N | 112.95 E |
| December 9, 2019 | 86.25 N | 121.40 E |
| December 16, 2019 | 86.62 N | 118.12 E |
| December 23, 2019 | 86.63 N | 113.20 E |
| December 30, 2019 | 86.58 N | 117.13 E |
| January 6, 2020 | 87.10 N | 115.10 E |
| January 13, 2020 | 87.35 N | 106.63 E |
| January 20, 2020 | 87.42 N | 97.77 E |
| January 27, 2020 | 87.43 N | 95.82 E |
| February 3, 2020 | 87.42 N | 93.65 E |
| February 10, 2020 | 87.78 N | 91.52 E |
| February 17, 2020 | 88.07 N | 78.52 E |
| February 24, 2020 | 88.58 N | 52.87 E |
| March 2, 2020 | 88.17 N | 31.02 E |
| March 9, 2020 | 87.93 N | 24.20 E |
| March 16, 2020 | 86.87 N | 12.70 E |
| March 23, 2020 | 86.20 N | 15.78 E |
| March 30, 2020 | 85.37 N | 13.27 E |
| April 6, 2020 | 84.52 N | 14.38 E |
| April 13, 2020 | 84.28 N | 14.97 E |
| April 20, 2020 | 84.52 N | 14.57 E |
| April 27, 2020 | 83.93 N | 15.65 E |
| May 4, 2020 | 83.92 N | 18.03 E |
| May 11, 2020 | 83.47 N | 13.08 E |
| May 18+, 2020 | 83.32 N | 8.68 E |
| May 25+, 2020 | 82.43 N | 8.28 E |
| June 1+, 2020 | 81.33 N | 9.93 E |
| June 8+, 2020 | 78.10 N | 12.73 E |
| June 15+, 2020 | 82.20 N | 8.18 E |
| June 22, 2020 | 81.95 N | 9.27 E |
| June 29, 2020 | 82.03 N | 9.88 E |
| July 6, 2020 | 81.67 N | 5.22 E |
| July 13, 2020 | 81.40 N | 0.28 E |
| July 20, 2020 | 80.78 N | 0.42 W |
| July 27, 2020 | 79.55 N | 2.37 W |
**Day when MOSAiC reached the ice floe that the Polarstern will become frozen in and drift with for the next year.
+ Indicates when the Polarstern traveled under its own engine power (no drifting)
Log MOSAiC Data
Keep track of Arctic conditions over the course of the expedition:
Download Data Logbook for Sept. 2019 - Dec. 2019
Download Data Logbook for Dec. 2019 - Mar. 2020
Download Data Logbook for Mar. 2020 - June 2020
Download Data Logbook for July 2020 - Oct. 2020
| Date | Length of day (hrs) | Air temperature (deg C) at location of Polarstern | Arctic Sea Ice Extent (million km2) |
| September 16, 2019 | 13.25 | High: 10 Low: 4.4 | 3.9 |
| September 23, 2019 | 12.35 | High: 6 Low: -1 | 4.1 |
| September 30, 2019 | 9.1 | -4.7 | 4.4 |
| October 4, 2019** | 6.27 | -13.0 | 4.5 |
| October 7, 2019 | 3.05 | -8.2 | 4.6 |
| October 14, 2019 | 0 | -14.7 | 4.8 |
| October 21, 2019 | 0 | -12.8 | 5.4 |
| October 28, 2019 | 0 | -18.3 | 6.8 |
| November 4, 2019 | 0 | -18.9 | 8.0 |
| November 11, 2019 | 0 | -25.5 | 8.7 |
| November 18, 2019 | 0 | -10.7 | 9.3 |
| November 25, 2019 | 0 | -18.4 | 10.0 |
| December 2, 2019 | 0 | -26.6 | 10.4 |
| December 9, 2019 | 0 | -23.1 | 11.2 |
| December 16, 2019 | 0 | -19.2 | 11.8 |
| December 23, 2019 | 0 | -26.9 | 12.2 |
| December 30, 2019 | 0 | -26.4 | 12.6 |
| January 6, 2020 | 0 | -28.0 | 13.0 |
| January 13, 2020 | 0 | -30.7 | 13.1 |
| January 20, 2020 | 0 | -27.1 | 13.6 |
| January 27, 2020 | 0 | -22.5 | 13.8 |
| February 3, 2020 | 0 | -28.8 | 14.1 |
| February 10, 2020 | 0 | -26.2 | 14.5 |
| February 17, 2020 | 0 | -31.9 | 14.4 |
| February 24, 2020 | 0 | -24.0 | 14.6 |
| March 2, 2020 | 0 | -35.5 | 14.8 |
| March 9, 2020 | 0 | -37.9 | 14.7 |
| March 16, 2020 | 10.5 | -27.5 | 14.7 |
| March 23, 2020 | 16.5 | -28.7 | 14.4 |
| March 30, 2020 | 24 | -28.6 | 14.0 |
| April 6, 2020 | 24 | -18.2 | 13.7 |
| April 13, 2020 | 24 | -25.8 | 13.6 |
| April 20, 2020 | 24 | -10.2 | 13.3 |
| April 27, 2020 | 24 | -11.7 | 12.8 |
| May 4, 2020 | 24 | -16.2 | 12.8 |
| May 11, 2020 | 24 | -10.4 | 12.4 |
| May 18, 2020 | 24 | -5.1 | 11.7 |
| May 25, 2020 | 24 | 0.4 | 11.5 |
| June 1, 2020 | 24 | 0.0 | 11.1 |
| June 8+, 2020 | 24 | -0.1 | 10.6 |
| June 15+, 2020 | 24 | -0.4 | 10.1 |
| June 22, 2020 | 24 | -0.4 | 9.6 |
| June 29, 2020 | 24 | 0.5 | 9.2 |
| July 6, 2020 | 24 | 0.6 | 8.2 |
| July 13, 2020 | 24 | 0.2 | 7.2 |
| July 20, 2020 | 24 | -0.1 | 6.2 |
| July 27, 2020 | 24 | 1.9 | 5.8 |
*Note: We expect data to fall within the following ranges: Length of day, 0-24 hours; Temperature, -40 to 14 degrees C; Sea ice extent, 3-15 million km2
**Day when MOSAiC reached the ice floe that the Polarstern will become frozen in and drift with for the next year.
Is there something you'd like to see in MOSAiC Monday? Let us know!
Send us your feedback
New to MOSAiC Monday? Check out past editions!
Browse more expedition-related educational resources, videos, and blogs
Email us! mosaic@colorado.edu