Under Pressure
The Atmosphere: Part 2
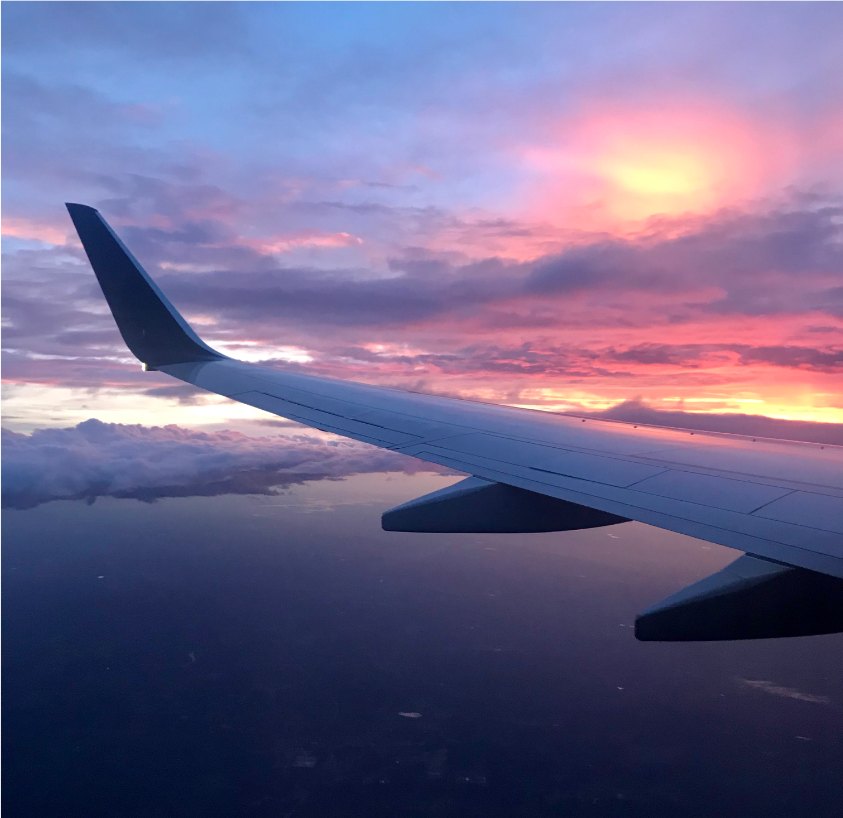
In last week's MOSAiC Monday, we mentioned that most of the mass (75-80%) of Earth's atmosphere is in the ~6-mile (~10 km) thick bottom layer called the troposphere. The troposphere is where we live, where most clouds form, where all weather occurs, and is the wettest of all atmospheric layers. Air is warmest at the bottom of the troposphere, and cooler near the top - hence why mountaintops are often covered by snow. Air pressure also decreases towards the top of the troposphere, which is why the cabins of airplanes you fly in are pressurized. But what exactly does this mean? What is air pressure?
Did you miss The Atmosphere Part 1? Check it out here!
 Quick Bite: I Notice, I Wonder
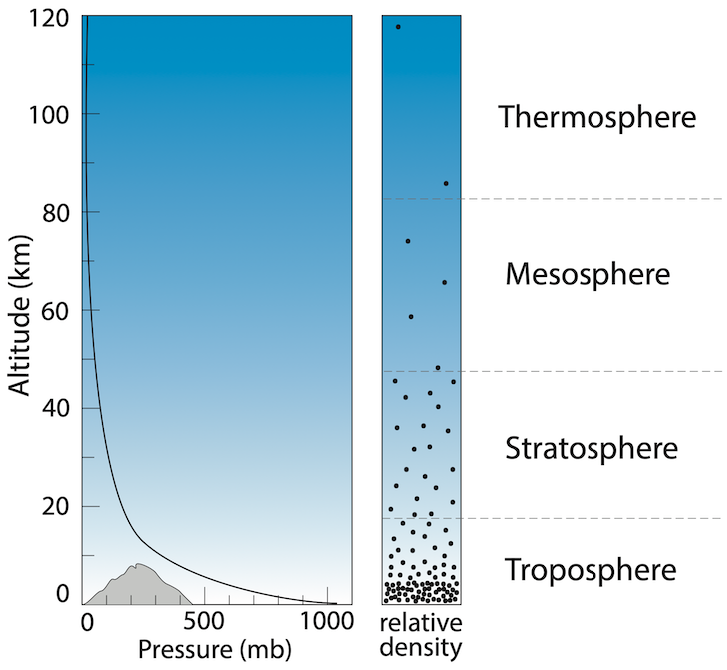
So what exactly is air pressure? Take a look at the figure on the right, which shows how air pressure changes as you move up in the atmosphere through its various layers compared to the relative density of air molecules. What do you notice? What do you wonder? Can you use this figure to explain what air pressure is? Can you use this diagram to explain why most people who climb Mount Everest, Earth's highest mountain above sea level, wear oxygen masks and tanks when they get above 26,000 feet (8,000 m)? Figure credit: Visionlearning
Read more about Earth's atmospheric composition and learn what air pressure is
What is it like to scale Earth's tallest mountain?
![]()
![]()
![]()
 In the Classroom: Pondering Pressure
What is air pressure, and what affects or changes it? We can explore this question using a PhET simulation that allows us to visualize gas particles and their motion.
Have your students explore this simulation for a few minutes on their own individually or in small groups, starting with the 'Intro' screen, to become familiar with it. Then, ask students to use either the 'Intro' screen or the 'Laws' screen to explore the following questions: What is, or causes, air pressure? What affects or changes air pressure? Why do you think the air pressure at the bottom of the troposphere is greater than the air pressure at the top? How is an airplane cabin pressurized?
Direct link to Gases Intro PhET simulation
Activity (grades 6-12): Air Pressure, It's in the Bag
Extension: Gas Laws
Teachers: In the short activity above, your students are beginning their exploration of the Gas Laws that describe the relationship between the pressure, volume, temperature, and number of particles of a gas. Here are some additional resources you can use in your classroom to continue this learning:
AACT Simulation Activity: Gas Laws (grades 6-12)
NOAA Ocean Explorer: Gas laws and their application to scuba diving (grades 7-8)
![]()
![]()
![]()
Weather and Pressure in the Arctic
Atmospheric pressure is something that many of us have an interest in or check on daily whether we realize it or not. This is because atmospheric pressure plays a big role in weather. The difference between a high or low pressure system could mean the different between packing your sunglasses or an umbrella!
Pressure Measure
Barometers are instruments that measure atmospheric pressure. Around the Polarstern there is a network of buoys deployed on the ice containing barometers that have been collecting data since the expedition began! And...we are giving you an exclusive sneak peak at some preliminary pressure data that was collected during Leg I!
 Quick Bite: Weathering the Storms
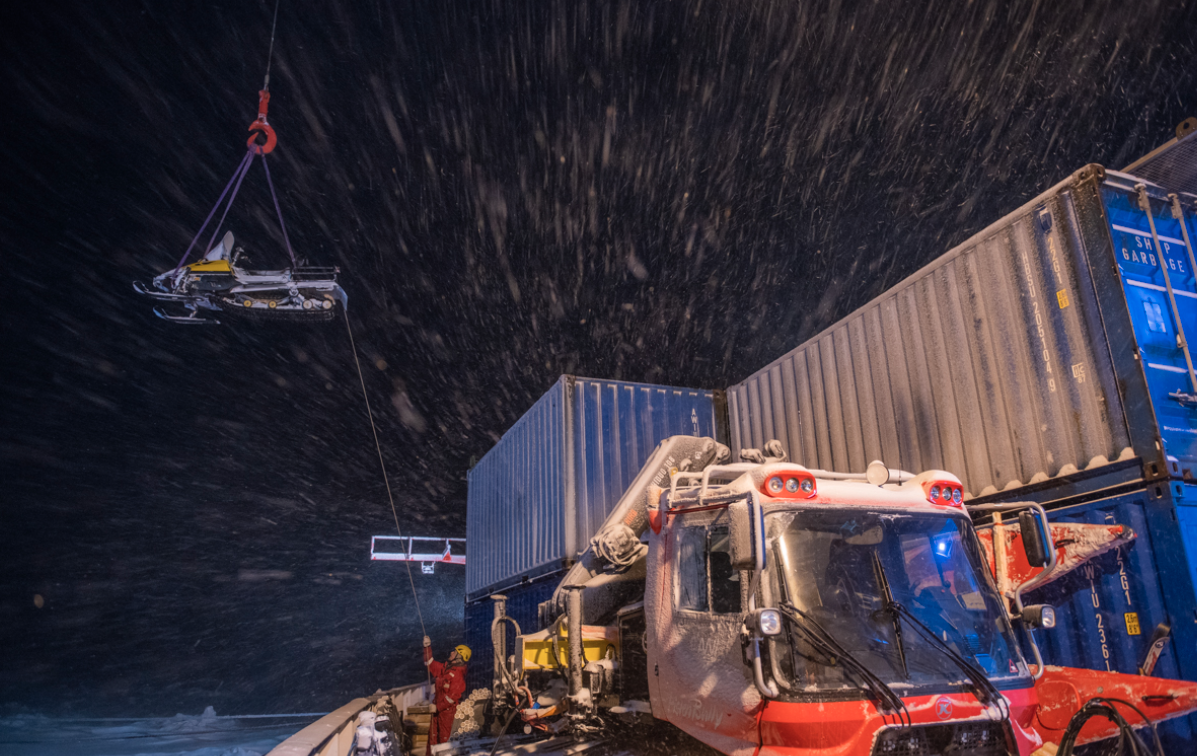
MOSAiC participants are particularly interested in pressure because changes in air pressure can mean big changes in weather, and changes in weather can affect scientific activities on the ice, the resilience of the equipment on the ice, and whether or not the expedition helicopters can fly. The Polarstern has already weathered (pun intended) a couple of serious storms that have caused the ice to move around the ship, cracking and ridging and wreaking havoc on some of the science cities. Photo: MOSAiC crew hoist skidoos off of the sea ice as a storm rolls in; Photo credit: Esther Horvath
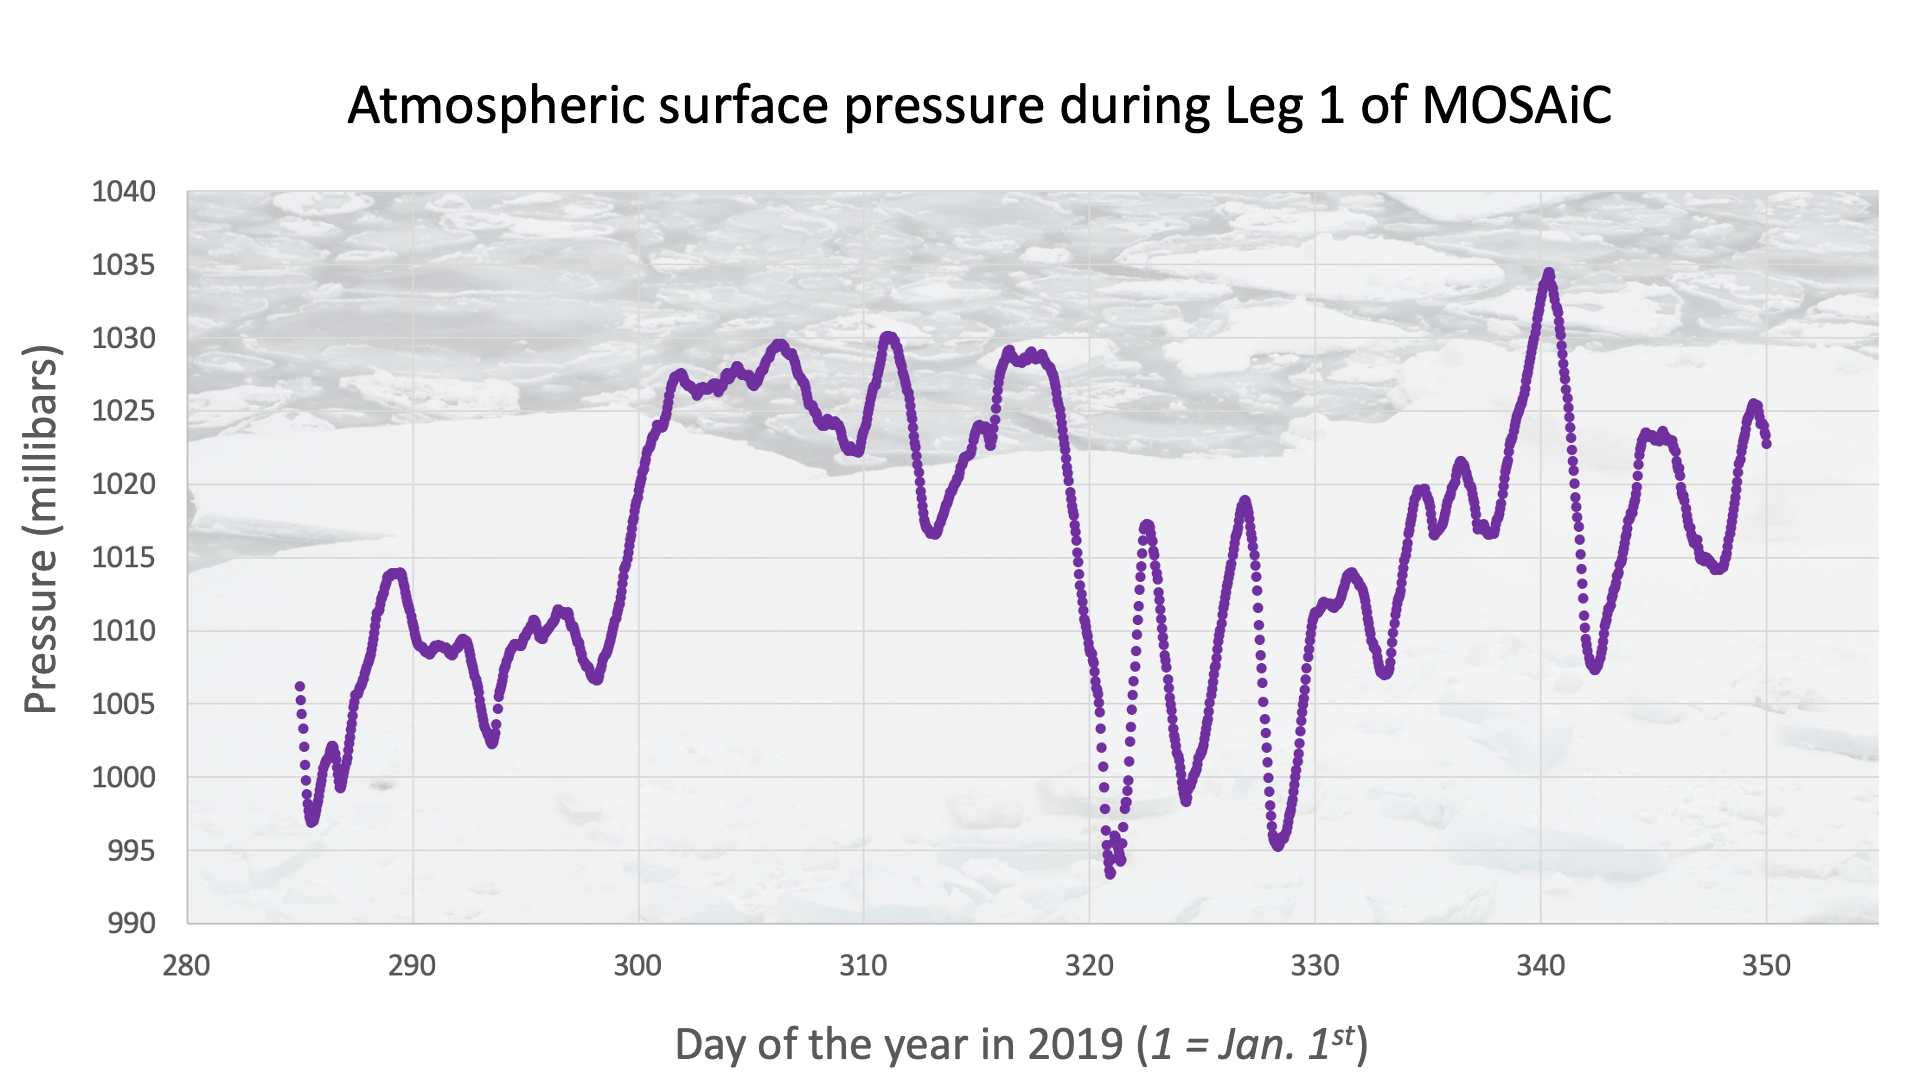
Below is a graph showing the preliminary (surface) atmospheric pressure data near the Polarstern from MOSAiC Leg I. Preliminary means that this data hasn't yet been put through a rigorous quality assurance check, but we've gotten the initial ok to share it with you. Watch the short video above about how atmospheric pressure is connected to weather. Can you identify when storms might have happened at the location of Polarstern from this graph? You might notice that the x-axis of this graph is in units of 'day of the year,' where January 1st = 1 (and January 31st = 31, and February 28th = 59, and so on...). Can you figure out the dates of the possible storms you identified? The MOSAiC web app reported on one major storm that hit the Polarstern during Leg I - scroll back in time through the web app blog to see if you identified a storm correctly in the pressure data. Data courtesy of expedition co-coordinator Matt Shupe
![]()
![]()
 #askmosaic: Technology on and off the ship
This question was submitted by Jeremiah from Seneca Falls Middle School: How reliable is the Internet/Wifi on the expedition?
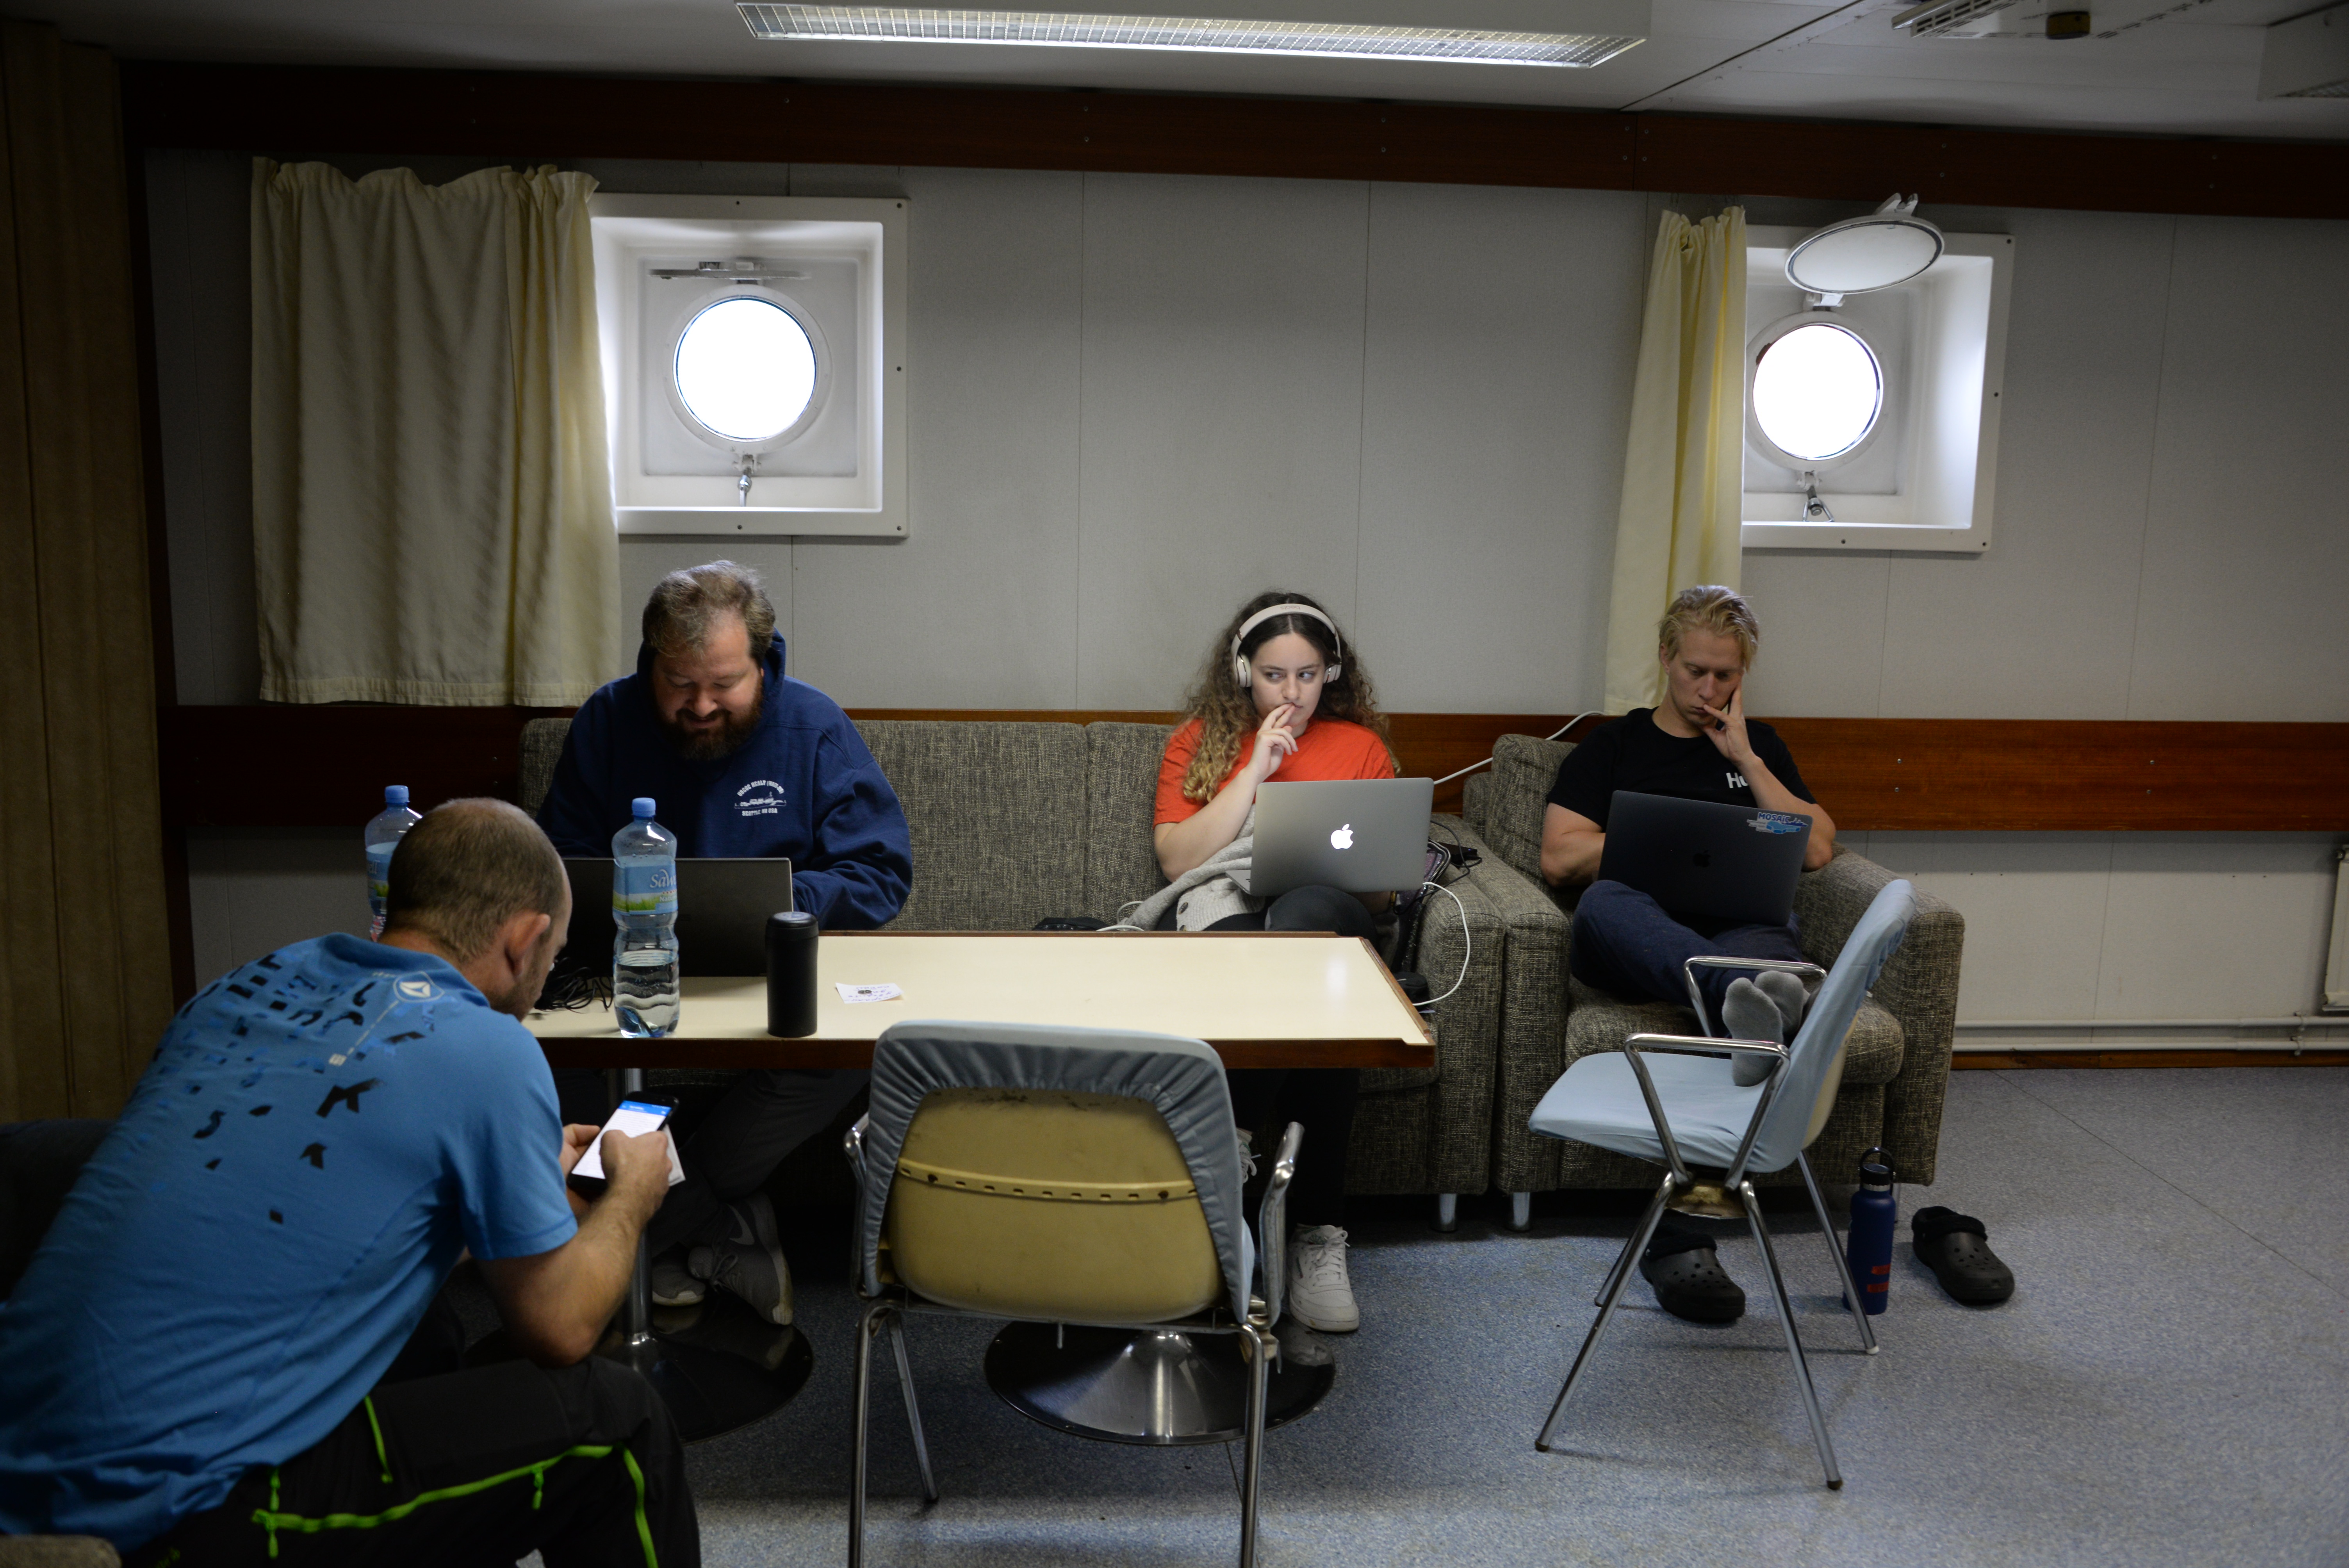
A few people are able to post to blogs and send a limited number of photos to keep you all informed, but in general we don't have internet available to us on this project. No web searches, facebook or streaming music. Imagine that! We have an email account supplied by the ship but it is limited to messages of 50 kb or less. So, by 21st century standards this is a very remote location indeed. Photo: MOSAiC team members pass the time on their computers on the Akademik Fedorov during MOSAiC Leg I; Photo credit: Anne Gold
-Byron Blomquist, Team Atmosphere, University of Colorado/NOAA
Griffin from Seneca Falls Middle School wants to know: Why do they call it a 'buoy'?
The term “buoy” is usually reserved for a small body not able to actively move but float in water. Some buoys are drifting with the wind whereas others are moored to the seafloor. Examples are drifers measuring surface currents or marker buoys for shipping lanes. Buoys are not ships or large platforms, such as oil rigs.
Polar researchers working in the marine realm have come up with another curious use of the word “buoy”: they often use measurement devices that are mounted on, in or under sea-ice. These systems are able to make observations automatically, obtain their position by GPS (satellites) and usually send back their data via communication satellites. That means you can follow most of these systems almost live on a map. They are technically termed “Ice-tethered Platforms”. Many but not all of these devices are able to float in water and, thus, are actually “buoys”. However, several are not. Despite that fact, those may also be called “buoys” by many scientists, due to the analog of the one just drifting at the water surface. Examples include systems measuring atmospheric temperature and pressure; ice and snow thickness; or ocean temperature and salinity. So, happy “buoy” spotting!
-Benjamin Rabe, Alfred Wegener Institute, Team OCEAN and co-cruise leader of Leg II
I am not really sure why it is called a buoy, but I imagine it comes from the word buoyance which means “the ability to float in a liquid or to rise in a fluid. the property of a fluid to exert an upward force (upthrust) on a body that is wholly or partly submerged in it.” (Dictionary.com)
-Ryleigh Moore, University of Utah, MOSAiC School Participant and Team Sea Ice member
Want to know where there are currently buoys in the polar regions? Find them here!
Submit your #askmosaic questions!
 MOSAiC Weekly Tracking
Plot the Polarstern
Each week we will provide you with the latitude and longitude coordinates of the Polarstern so that your students can track its journey across the Arctic in your classroom.
Download the map to plot coordinates
Download a larger map of the Arctic for a bigger picture view of the expedition area
Location of the Polarstern
| Date | Latitude | Longitude |
| September 16, 2019 | 69.68 N | 18.99 E |
| September 23, 2019 | 72.31 N | 26.93 E |
| September 30, 2019 | 85.12 N | 138.05 E |
| October 4, 2019** | 85.08 N | 134.43 E |
| October 7, 2019 | 85.10 N | 133.82 E |
| October 14, 2019 | 84.85 N | 135.03 E |
| October 21, 2019 | 84.97 N | 132.73 E |
| October 28, 2019 | 85.47 N | 127.07 E |
| November 4, 2019 | 85.88 N | 121.70 E |
| November 11, 2019 | 85.82 N | 116.00 E |
| November 18, 2019 | 86.05 N | 122.43 E |
| November 25, 2019 | 85.85 N | 121.35 E |
| December 2, 2019 | 85.97 N | 112.95 E |
| December 9, 2019 | 86.25 N | 121.40 E |
| December 16, 2019 | 86.62 N | 118.12 E |
| December 23, 2019 | 86.63 N | 113.20 E |
| December 30, 2019 | 86.58 N | 117.13 E |
| January 6, 2020 | 87.10 N | 115.10 E |
| January 13, 2020 | 87.35 N | 106.63 E |
| January 20, 2020 | 87.42 N | 97.77 E |
| January 27, 2020 | 87.43 N | 95.82 E |
| February 3, 2020 | 87.42 N | 93.65 E |
| February 10, 2020 | 87.78 N | 91.52 E |
| February 17, 2020 | 88.07 N | 78.52 E |
| February 24, 2020 | 88.58 N | 52.87 E |
| March 2, 2020 | 88.17 N | 31.02 E |
**Day when MOSAiC reached the ice floe that the Polarstern will become frozen in and drift with for the next year.
Log MOSAiC Data
Keep track of Arctic conditions over the course of the expedition:
Download Data Logbook for Sept. 2019 - Dec. 2019
Download Data Logbook for Dec. 2019 - Mar. 2020
| Date | Length of day (hrs) | Air temperature (deg C) at location of Polarstern | Arctic Sea Ice Extent (million km2) |
| September 16, 2019 | 13.25 | High: 10 Low: 4.4 | 3.9 |
| September 23, 2019 | 12.35 | High: 6 Low: -1 | 4.1 |
| September 30, 2019 | 9.1 | -4.7 | 4.4 |
| October 4, 2019** | 6.27 | -13.0 | 4.5 |
| October 7, 2019 | 3.05 | -8.2 | 4.6 |
| October 14, 2019 | 0 | -14.7 | 4.8 |
| October 21, 2019 | 0 | -12.8 | 5.4 |
| October 28, 2019 | 0 | -18.3 | 6.8 |
| November 4, 2019 | 0 | -18.9 | 8.0 |
| November 11, 2019 | 0 | -25.5 | 8.7 |
| November 18, 2019 | 0 | -10.7 | 9.3 |
| November 25, 2019 | 0 | -18.4 | 10.0 |
| December 2, 2019 | 0 | -26.6 | 10.4 |
| December 9, 2019 | 0 | -23.1 | 11.2 |
| December 16, 2019 | 0 | -19.2 | 11.8 |
| December 23, 2019 | 0 | -26.9 | 12.2 |
| December 30, 2019 | 0 | -26.4 | 12.6 |
| January 6, 2020 | 0 | -28.0 | 13.0 |
| January 13, 2020 | 0 | -30.7 | 13.1 |
| January 20, 2020 | 0 | -27.1 | 13.6 |
| January 27, 2020 | 0 | -22.5 | 13.8 |
| February 3, 2020 | 0 | -28.8 | 14.1 |
| February 10, 2020 | 0 | -26.2 | 14.5 |
| February 17, 2020 | 0 | -31.9 | 14.4 |
| February 24, 2020 | 0 | -24.0 | 14.6 |
| March 2, 2020 | 0 | -35.5 | 14.8 |
*Note: We expect data to fall within the following ranges: Length of day, 0-24 hours; Temperature, -40 to 14 degrees C; Sea ice extent, 3-15 million km2
**Day when MOSAiC reached the ice floe that the Polarstern will become frozen in and drift with for the next year.
Contribute to the Museum of MOSAiC Art (MoMOA)
Do you like to draw, paint, sculpt, take photos, build models, knit, sew, write poetry, or engage in any other kind of creative endeavor? We want you to send us photos or scans of your MOSAiC-themed artwork! You can use any artistic medium you like and submit as many creations as you wish to the following categories:
- How the Arctic affects you
- Arctic exploration
- People of the Arctic
- MOSAiC science
- Arctic flora and fauna
- Arctic land and seascapes
- Life on an Arctic icebreaker
- Abstract Arctic
- Other
We'll be showcasing your artwork in the new virtual Museum of MOSAiC Art (MoMOA). Submit photos or scans of your artwork using the submission form below (open to all ages)!
Submit your artwork
Check out the Museum of MOSAiC Art
Questions? Email us with the subject line "MOSAiC Art": mosaic@colorado.edu
Opportunities for Students and Educators
MOSAiC + Reach the World
Exciting news! The MOSAiC education & outreach team has partnered with Reach the World to connect more classrooms to the MOSAiC expedition. Over the coming months, Reach the World will share MOSAiC team members' incredible stories about the expedition, its research, and the everyday challenges of life in the Arctic.
Up next, MOSAiC expedition videographer and photographer Amy Richman and PolarTREC educator Katie Gavenus, both participants on MOSAiC Leg I, share why it is important to document expeditions like MOSAiC and places like the Arctic.
Check out Amy's album of photos and videos from her time on board the ship
Read Katie's journal entry about her experience on MOSAiC Leg I
Watch Amy and Katie's classroom video call live on March 2 at 12 pm Eastern Time
Sign up for an on-camera spot for Amy and Katie's classroom call
 MOSAiC Monday and the NGSS
What do those funny symbols below some engagements mean?
Good news for educators in the U.S. teaching with the Next Generation Science Standards (NGSS) or similar! We will now be tagging MOSAiC Monday engagements with the NGSS Disciplinary Core Idea subject(s), Science and Engineering Practice(s), and Crosscutting Concept(s) that they most closely connect to. Look for these symbols listed below each engagement:
Disciplinary Core Idea Subjects
Science and Engineering Practices (adopted from the San Diego County Office of Education Science Resource Center)
Crosscutting Concepts (adopted from the San Diego County Office of Education Science Resource Center)
Is there something you'd like to see in MOSAiC Monday? Let us know!
Send us your feedback
New to MOSAiC Monday? Check out past editions!
Browse more expedition-related educational resources, videos, and blogs
Email us! mosaic@colorado.edu