Check out these upcoming events!
 Connect with MOSAiC scientists with Reach the World
Join us as we partner again this fall with our friends at Reach the World and Exploring by the Seat of Your Pants to help you connect your students virtually to MOSAiC team members and crew!
Coming Up: Live Video Call with MOSAiC Logistics Expert and Polar Bear Guard Laura Schmidt on Monday Oct. 5th!
Don't miss the live video call with Laura Schmidt on Monday October 5th at 10 am ET/8 am MT, hosted by Exploring by the Seat of Your Pants! Laura has firsthand knowledge of what it takes to coordinate field work in the Arctic and how to keep researchers safe on the ice. Also, check out the Reach the World MOSAiC program page to read expedition co-leader Matthew Shupe's logbook article looking back on the Arctic summer.
Sign up for an on-camera spot for Laura Schmidt's live video call or watch the live stream on YouTube
 Tune in weekly from now through December for the CIRES/NOAA Science at Home Webinar Series!
Join us every Tuesday at 1:00 pm MT from now through December for the CIRES/NOAA Science at Home webinar series! Each webinar features a 10-15 minute presentation by a scientist about how they got into science and what they do as a scientist, followed by 10-15 minutes of live Q&A.
Coming Up:
October 6th – Dr. Andy Hoell will present on: Flash Drought
October 13th – Dr. Matt Druckenmiller will present on: Exchange for Local Observations and Knowledge of the Arctic (ELOKA)
October 20th – Dr. Aleya Kaushik will present on: The Arctic Carbon Cycle
See the full speaker line-up on the Science at Home website
Register to receive weekly Science at Home email reminders
Help us welcome home the Polarstern!
The Polarstern is scheduled to return home on or around October 12th. We want your help in welcoming the ship, scientists, and crew home! Send us your welcome home messages, favorite expedition memories, or artwork, and we'll share them with MOSAiC team members as they arrive back on land and the field portion of the expedition comes to a close.
Share your welcome home messages with the MOSAiC team
Expedition Update
Games, Balloons, and Pancakes
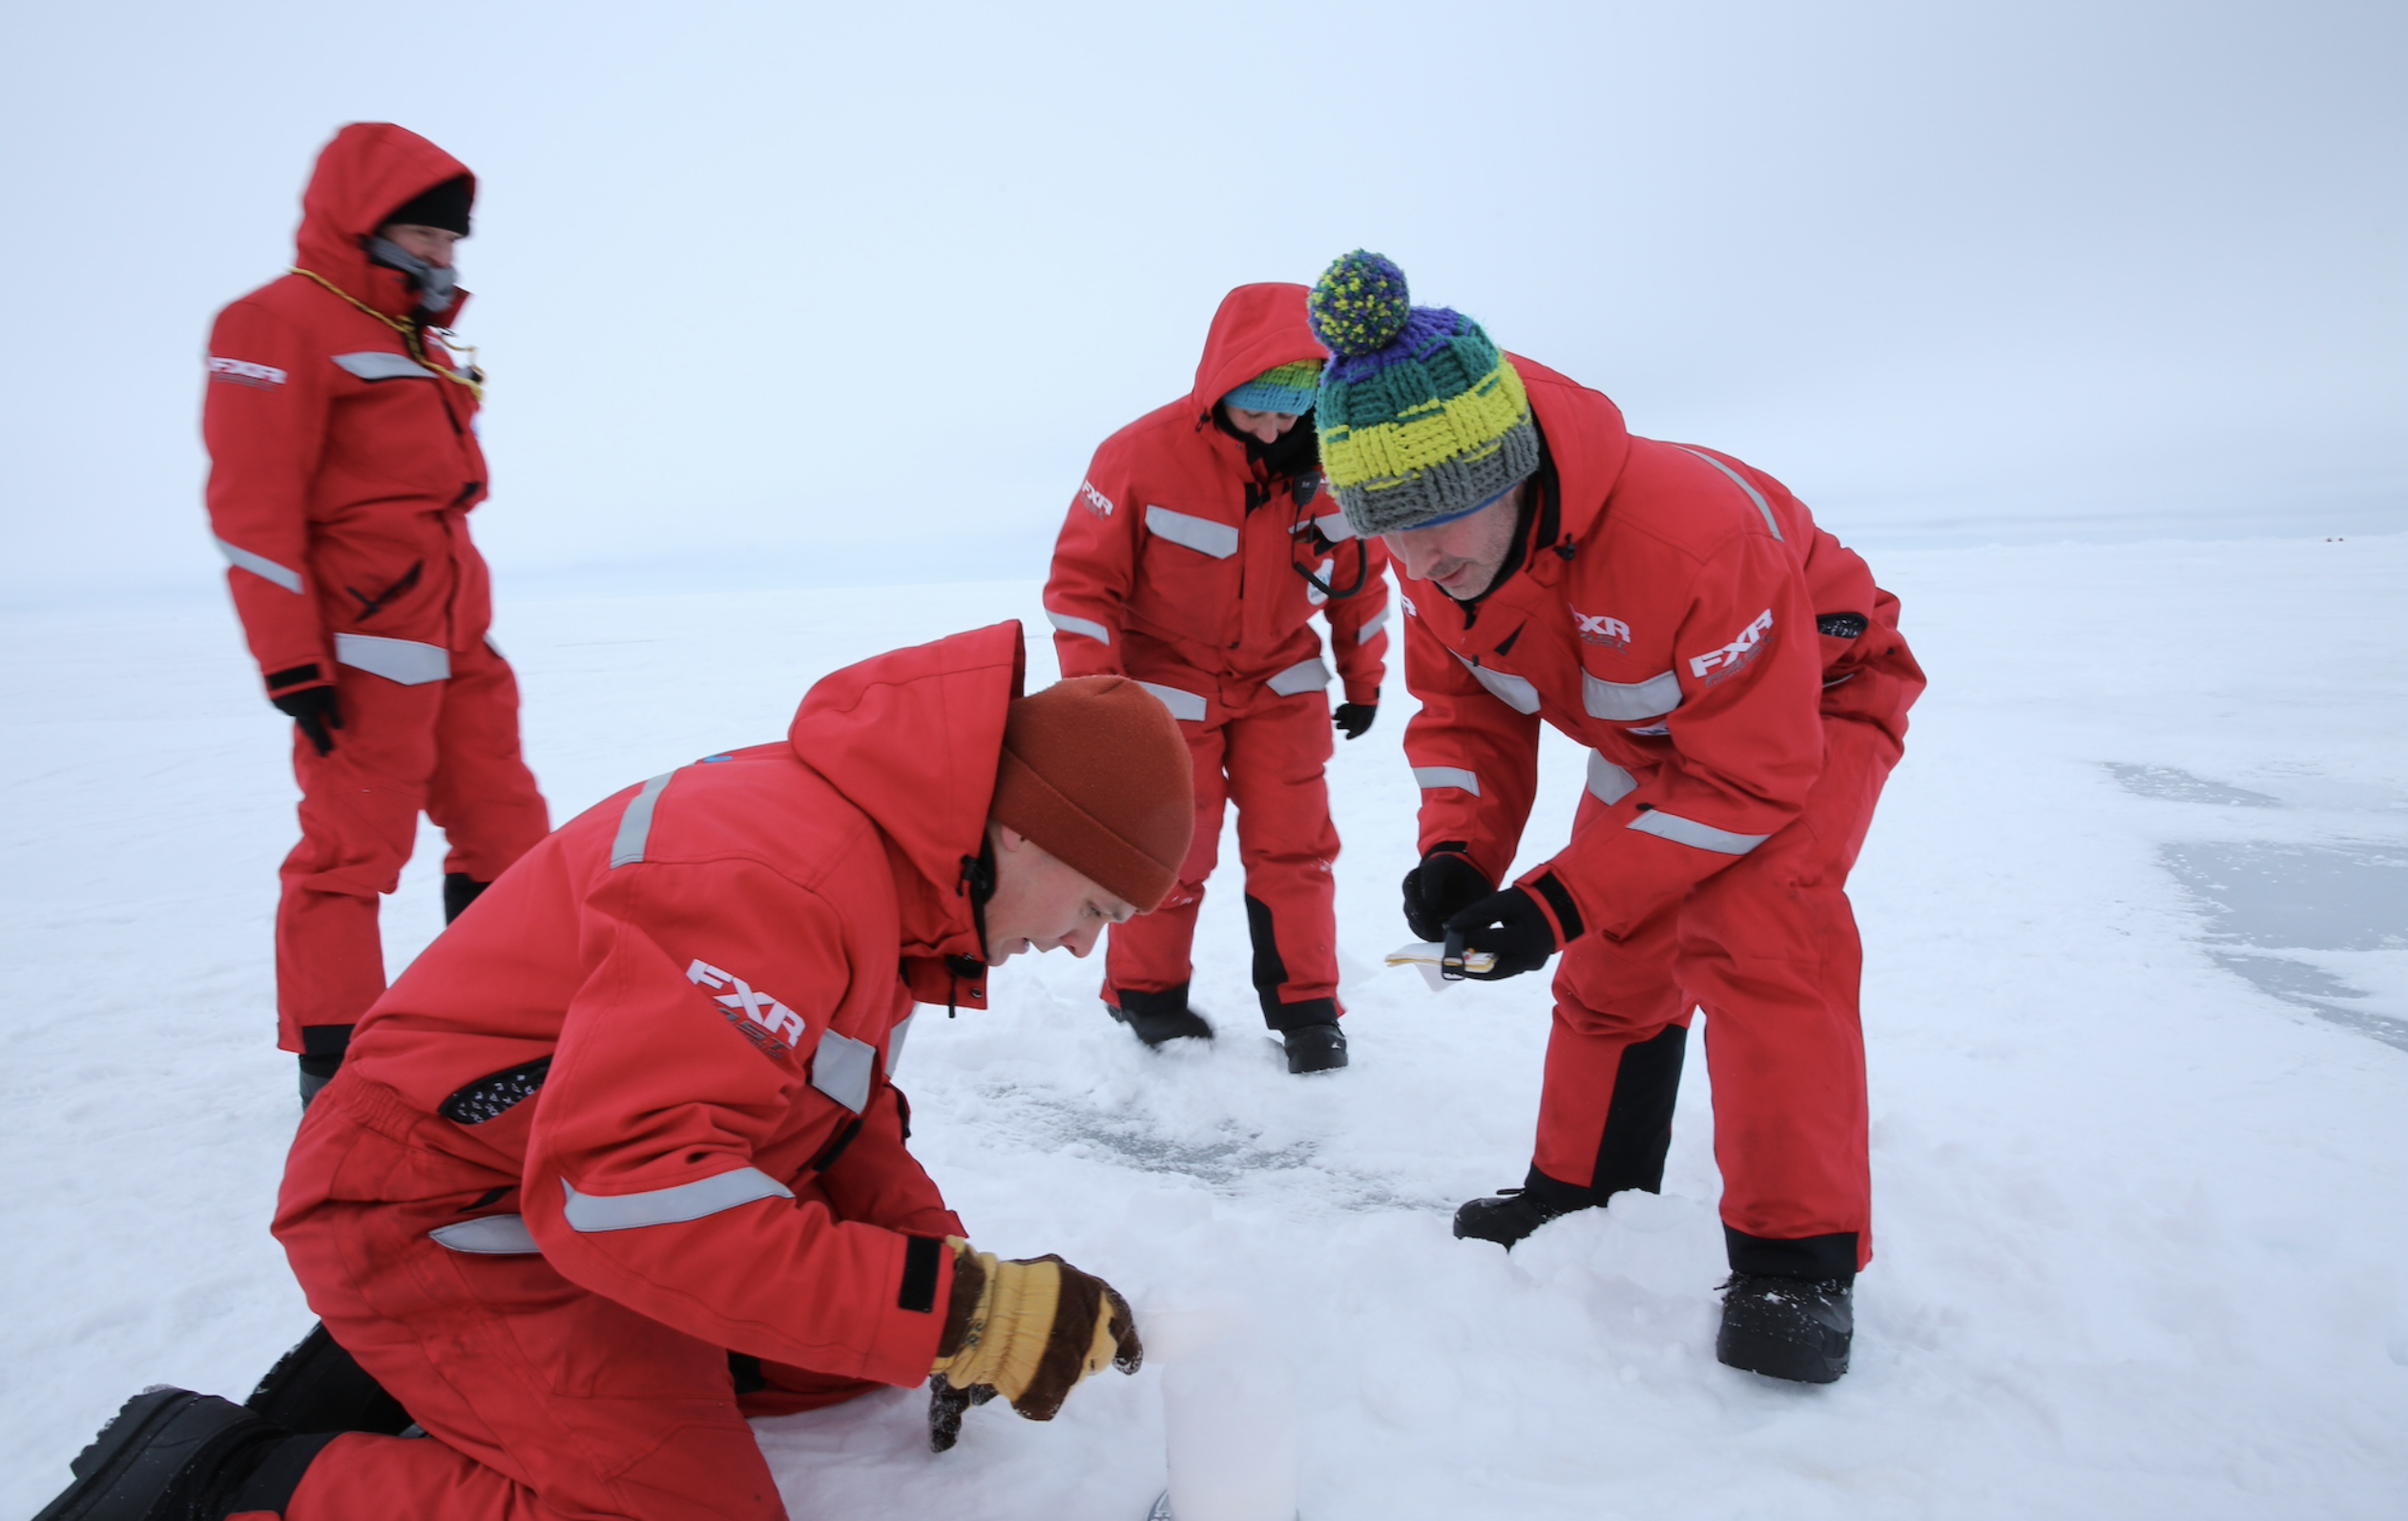
The Polarstern is on its way back to port, but that doesn't mean the science has stopped. On Thursday, scientists got back out on the ice one more time. Researchers took measurements from the atmosphere, ice, and snow. They even held a a competition they dubbed the 'Ice Challenge' where team members challenged each other to drilling ice cores by hand, measuring ice thickness, and more.
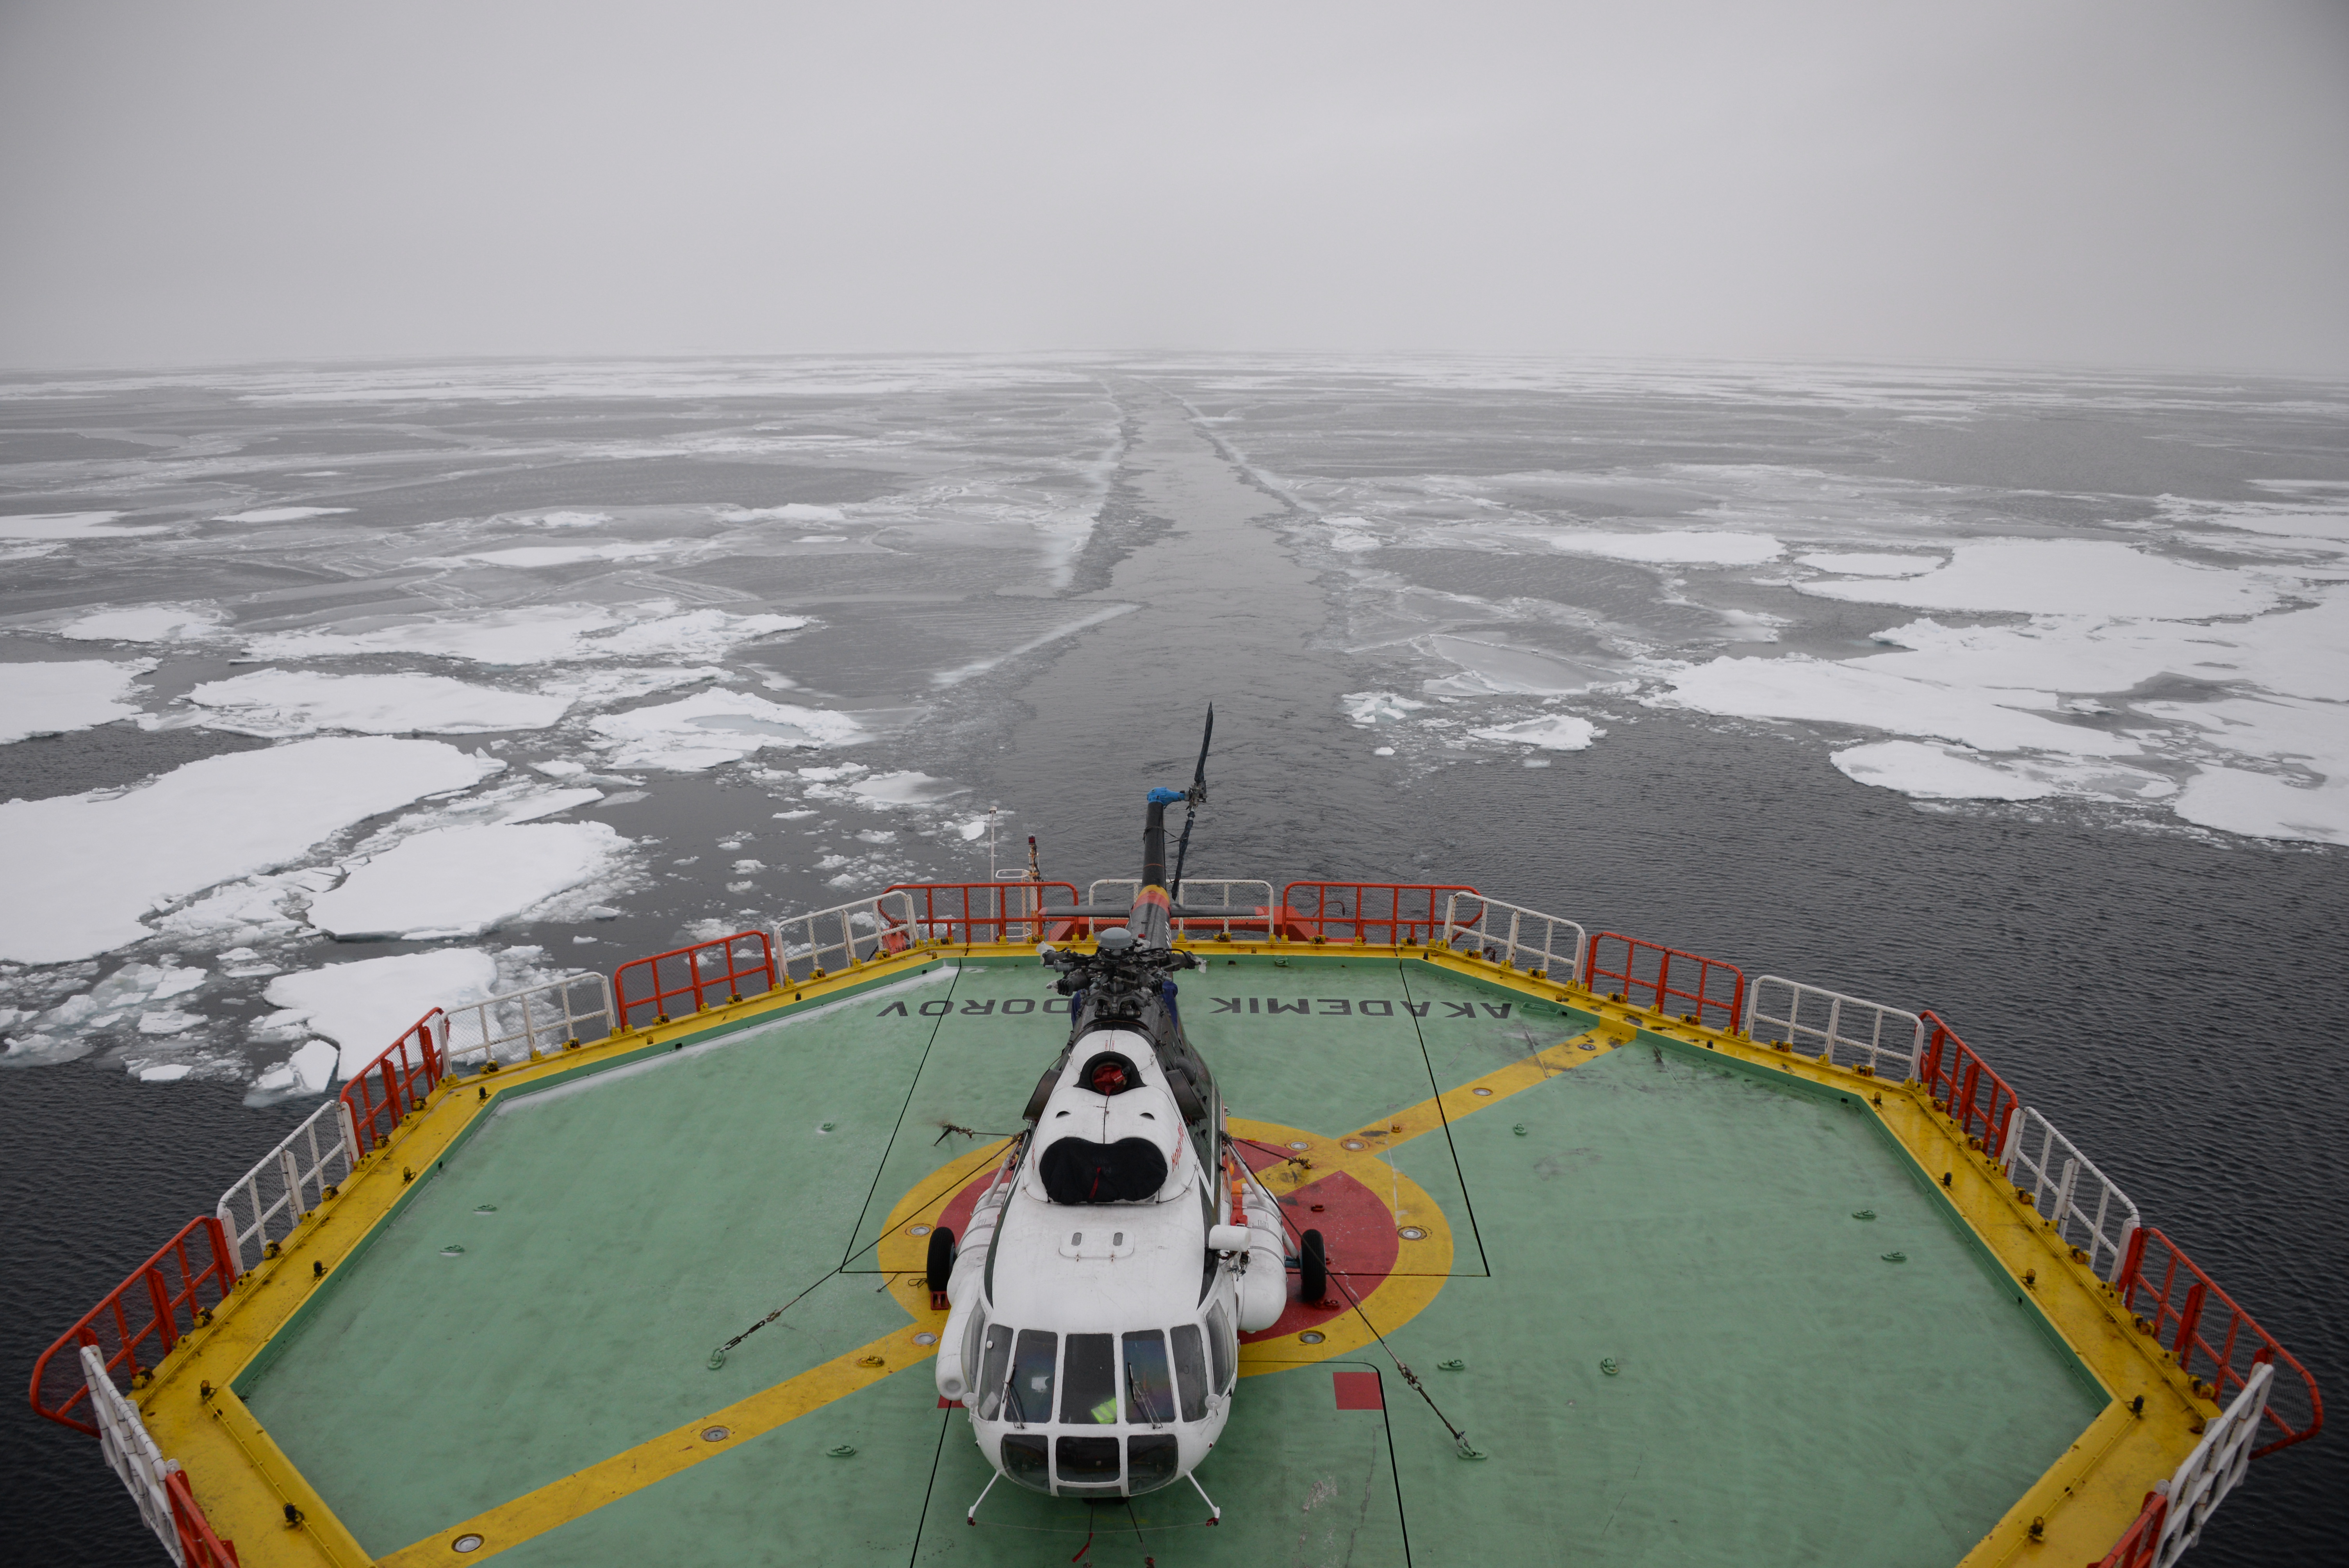
The atmosphere team also launched their last weather balloon for MOSAiC research from the helipad on the ship, bringing the grand total for the team up to 1,574 balloon launches! That's a lofty achievement.
Photo (R): MOSAiC team members participating in the Ice Challenge competition; Photo credit: Folke Mehrtens, AWI
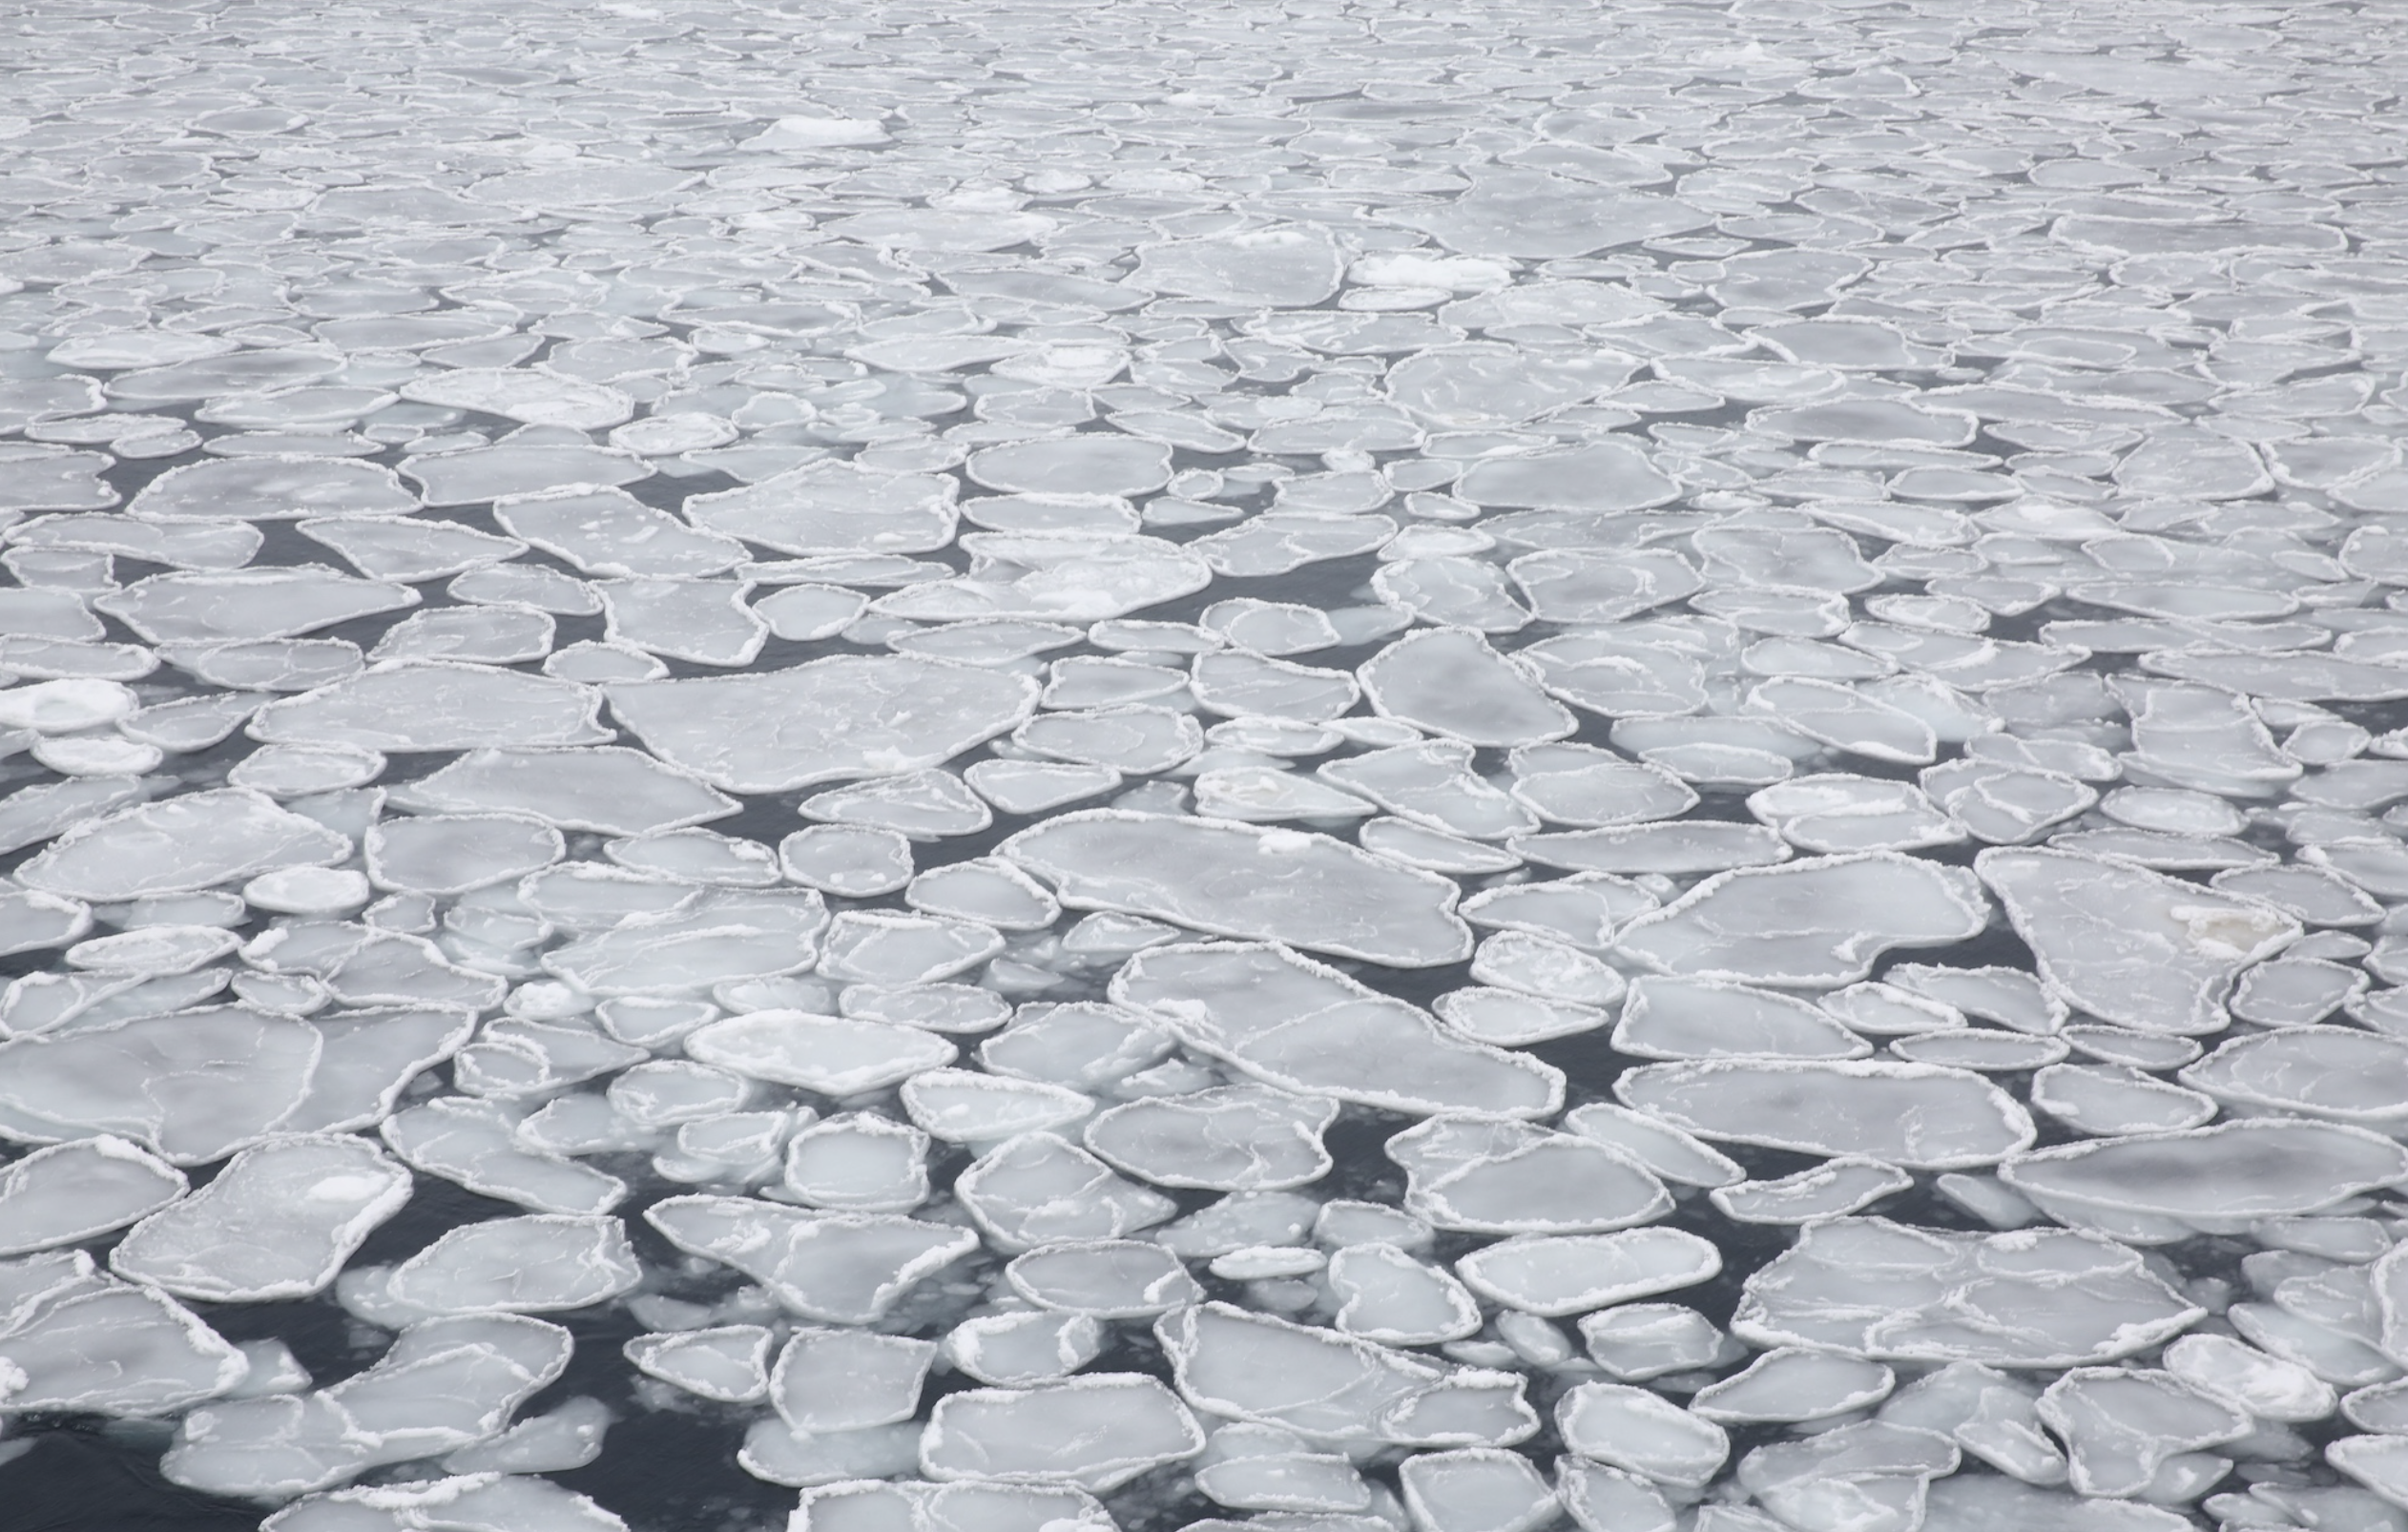
Marginally Icy
In its journey south, the ship has traveled through what's called the marginal ice zone, which is a sort of transition zone between the edge of the sea ice and the thick pack ice. They were delighted to find pancake ice in the marginal ice zone. Pancake ice forms early on in the sea ice life cycle, and forms in rougher seas where there is enough swell in the ocean for pieces of ice to collide with each other and form flat, rounded pancakes of ice. Learn more about the life cycle of sea ice and the influence of the seas on sea ice formation below.
Photo (L): Pancake ice in the marginal ice zone; Photo credit: Folke Mehrtens, AWI
The Life Cycle of Sea Ice
Did you know that plants and animals aren't the only things that go through life cycles (think of caterpillar to butterfly)? Arctic sea ice does too! As sea ice freezes, it goes through various forms and stages before it becomes what we call 'sheet ice'. There are two different pathways sea ice can take on its journey to becoming sheet ice, and these pathways depend on whether it is forming in calm or rough seas. In both pathways, as ocean water begins to freeze it first forms needle-like ice crystals called frazil ice.
Ice Formation in Calm Seas
If the ocean is calm, frazil ice crystals turn into a smooth, thin form of ice called grease ice, which then develops into a continuous thin sheet of ice called nilas. Rafting occurs when light winds push the nilas around and cause them to slide over one another. Nilas ice eventually thickens into congelation ice, which eventually becomes smooth-bottomed sheet ice.
Ice Formation in Rough Seas
If winds are blowing and the seas are rough, frazil ice accumulates into slushy circles called pancake ice. Pieces of pancake ice can raft like the nilas, or if thick enough they can form ridges. Eventually, pancake ice cements together into sheet ice, but in this case, the sheet ice is rough underneath.
Learn more about sea ice formation
 Learning at Home: The Writing's in the Ice
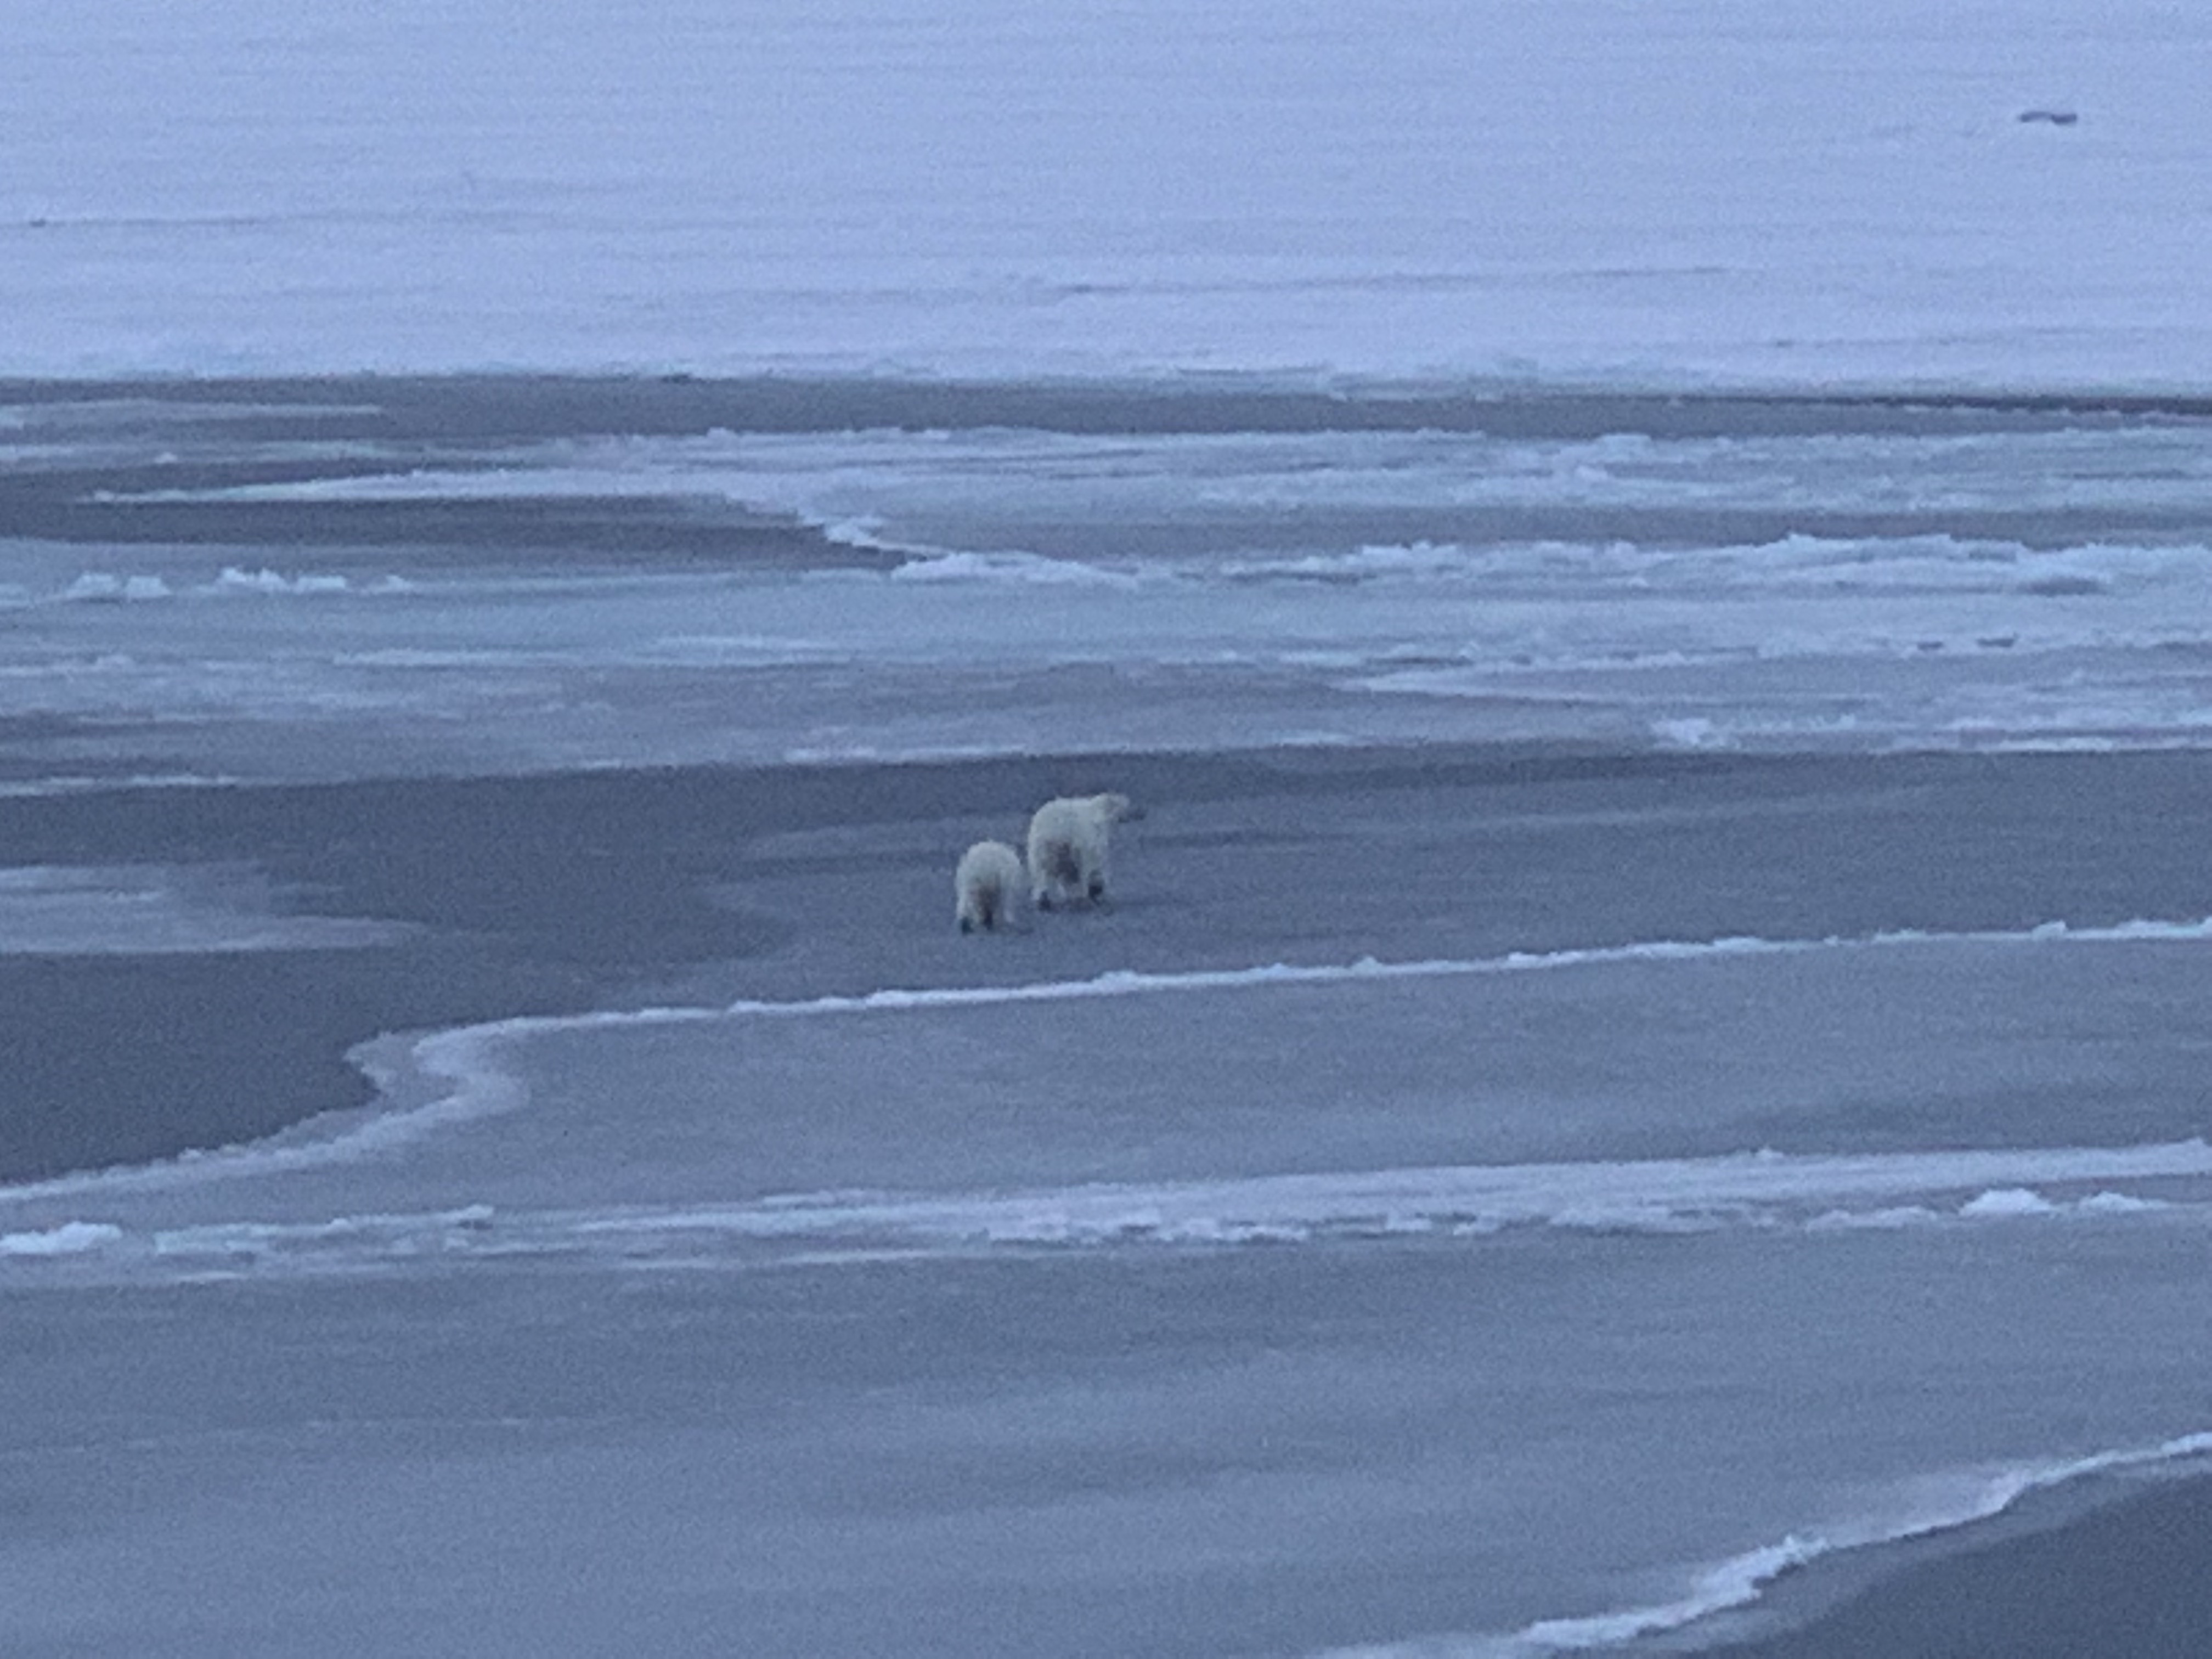
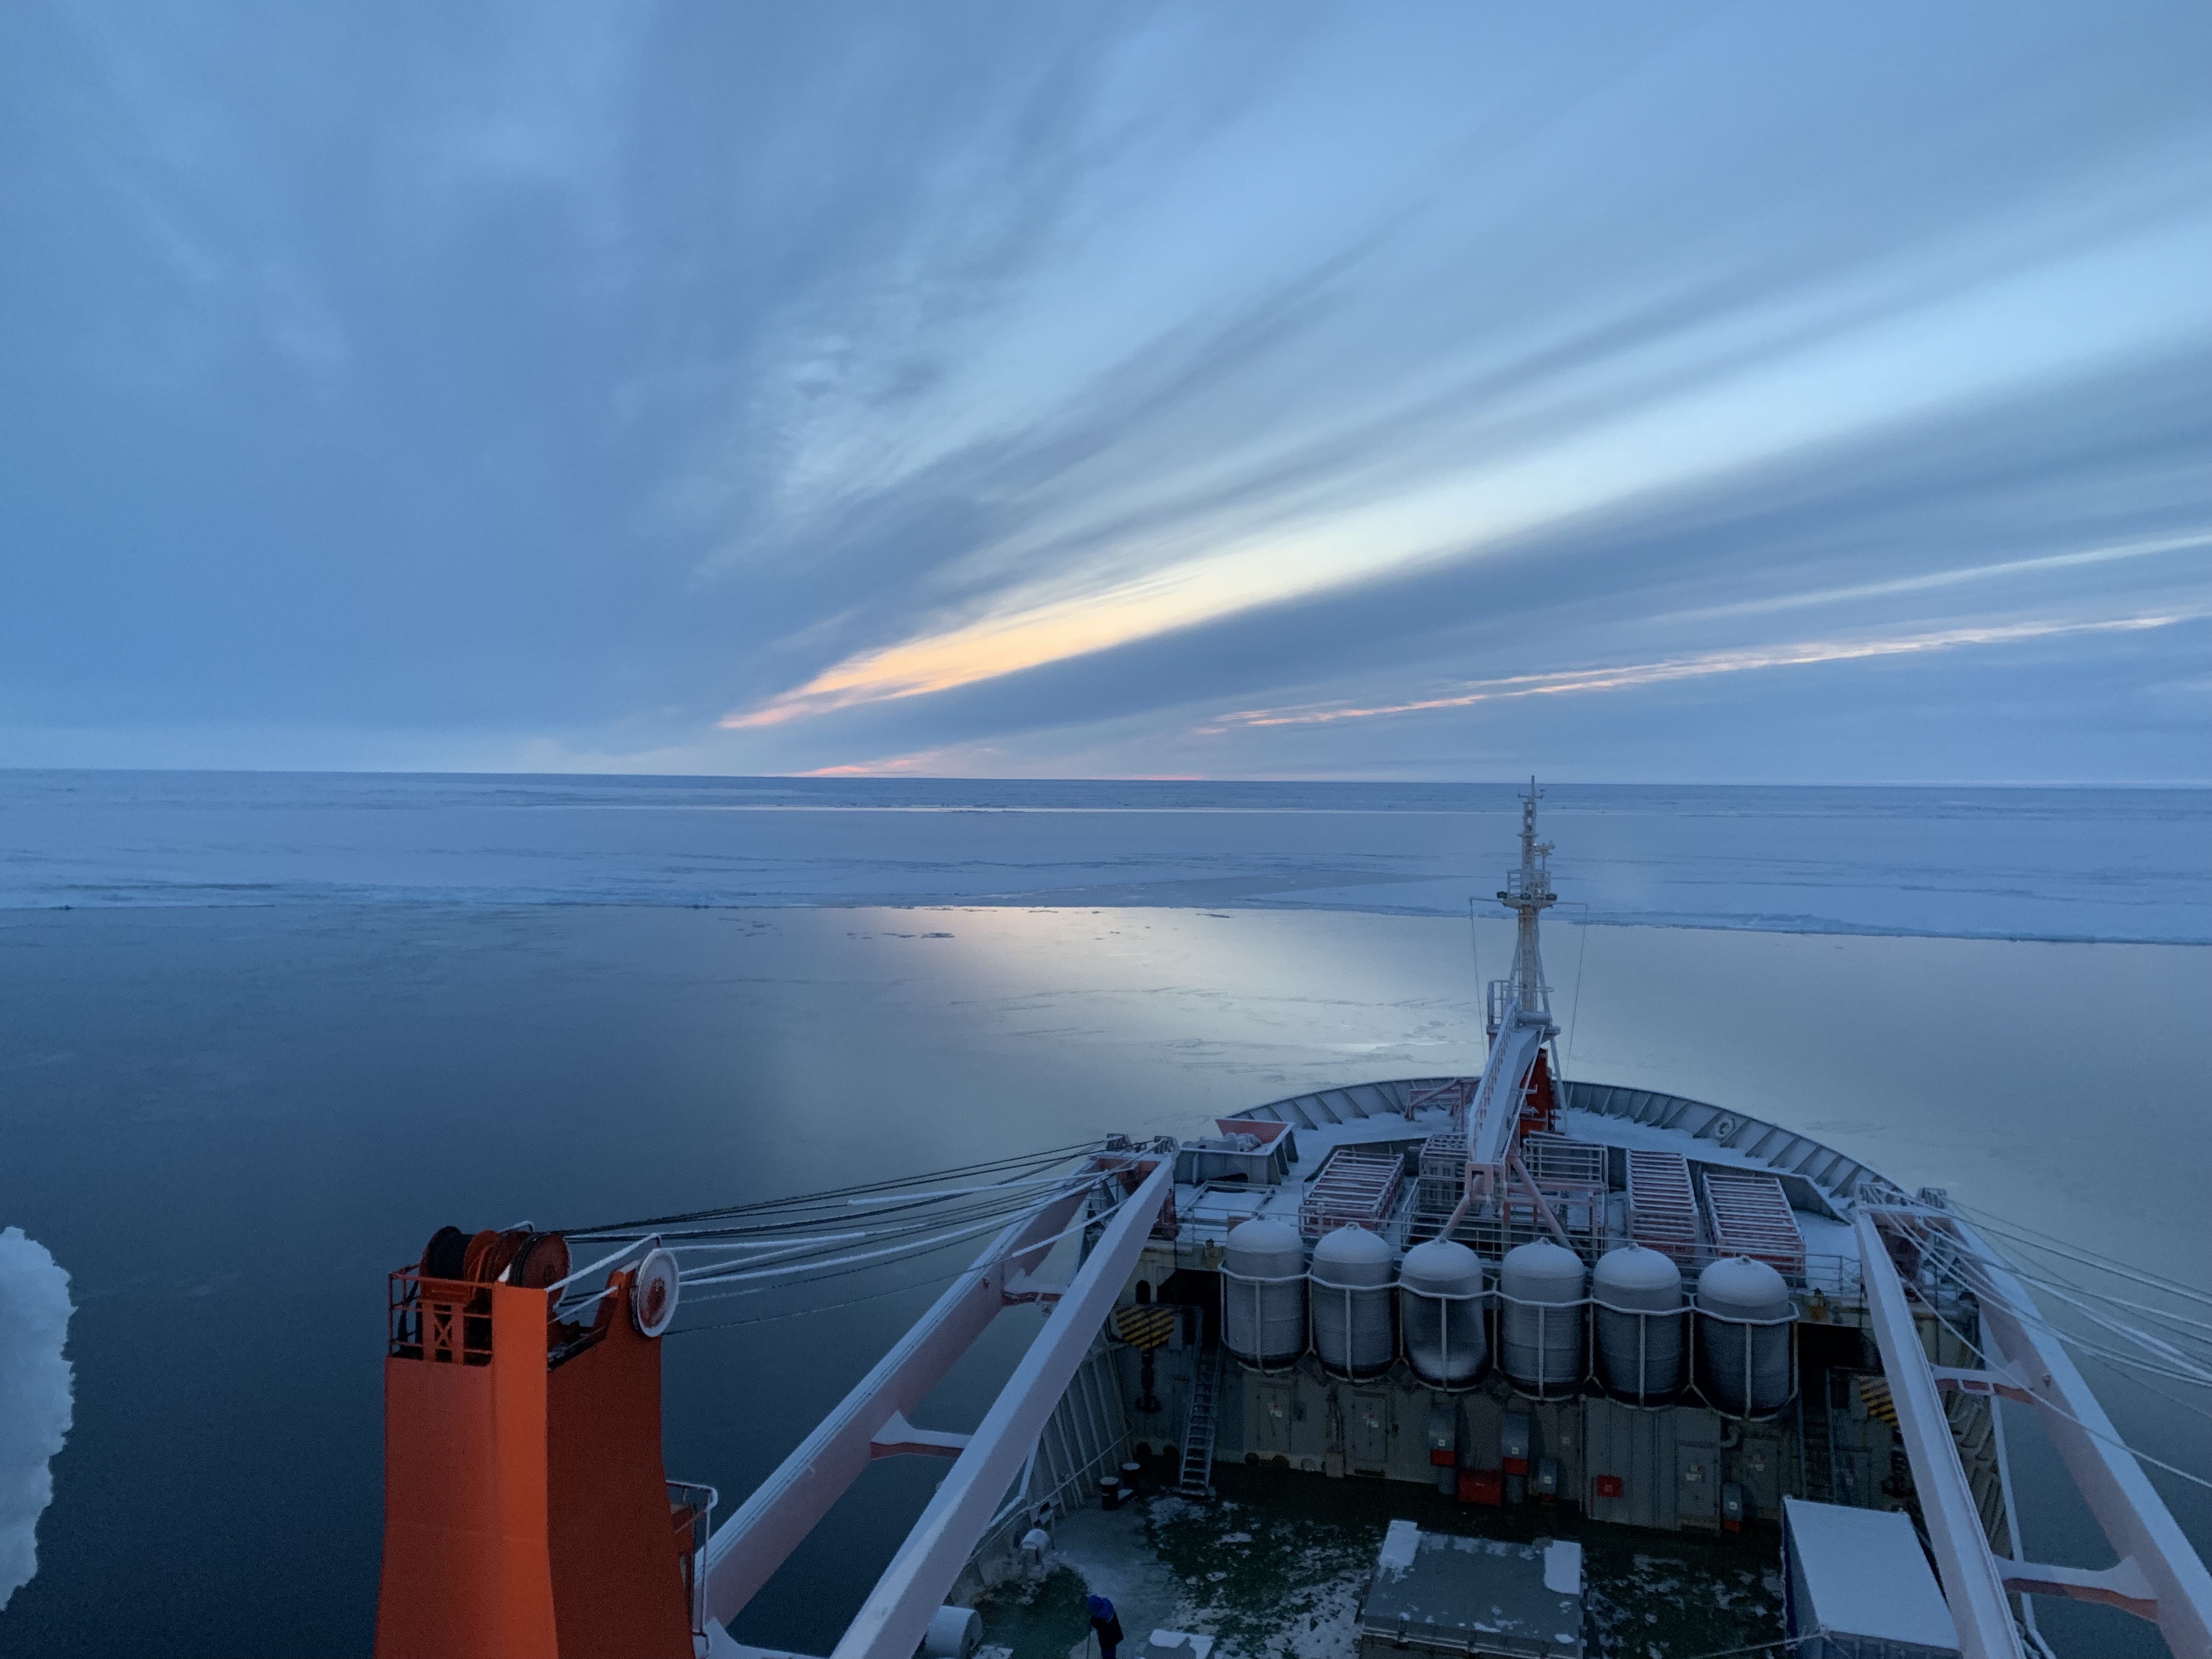
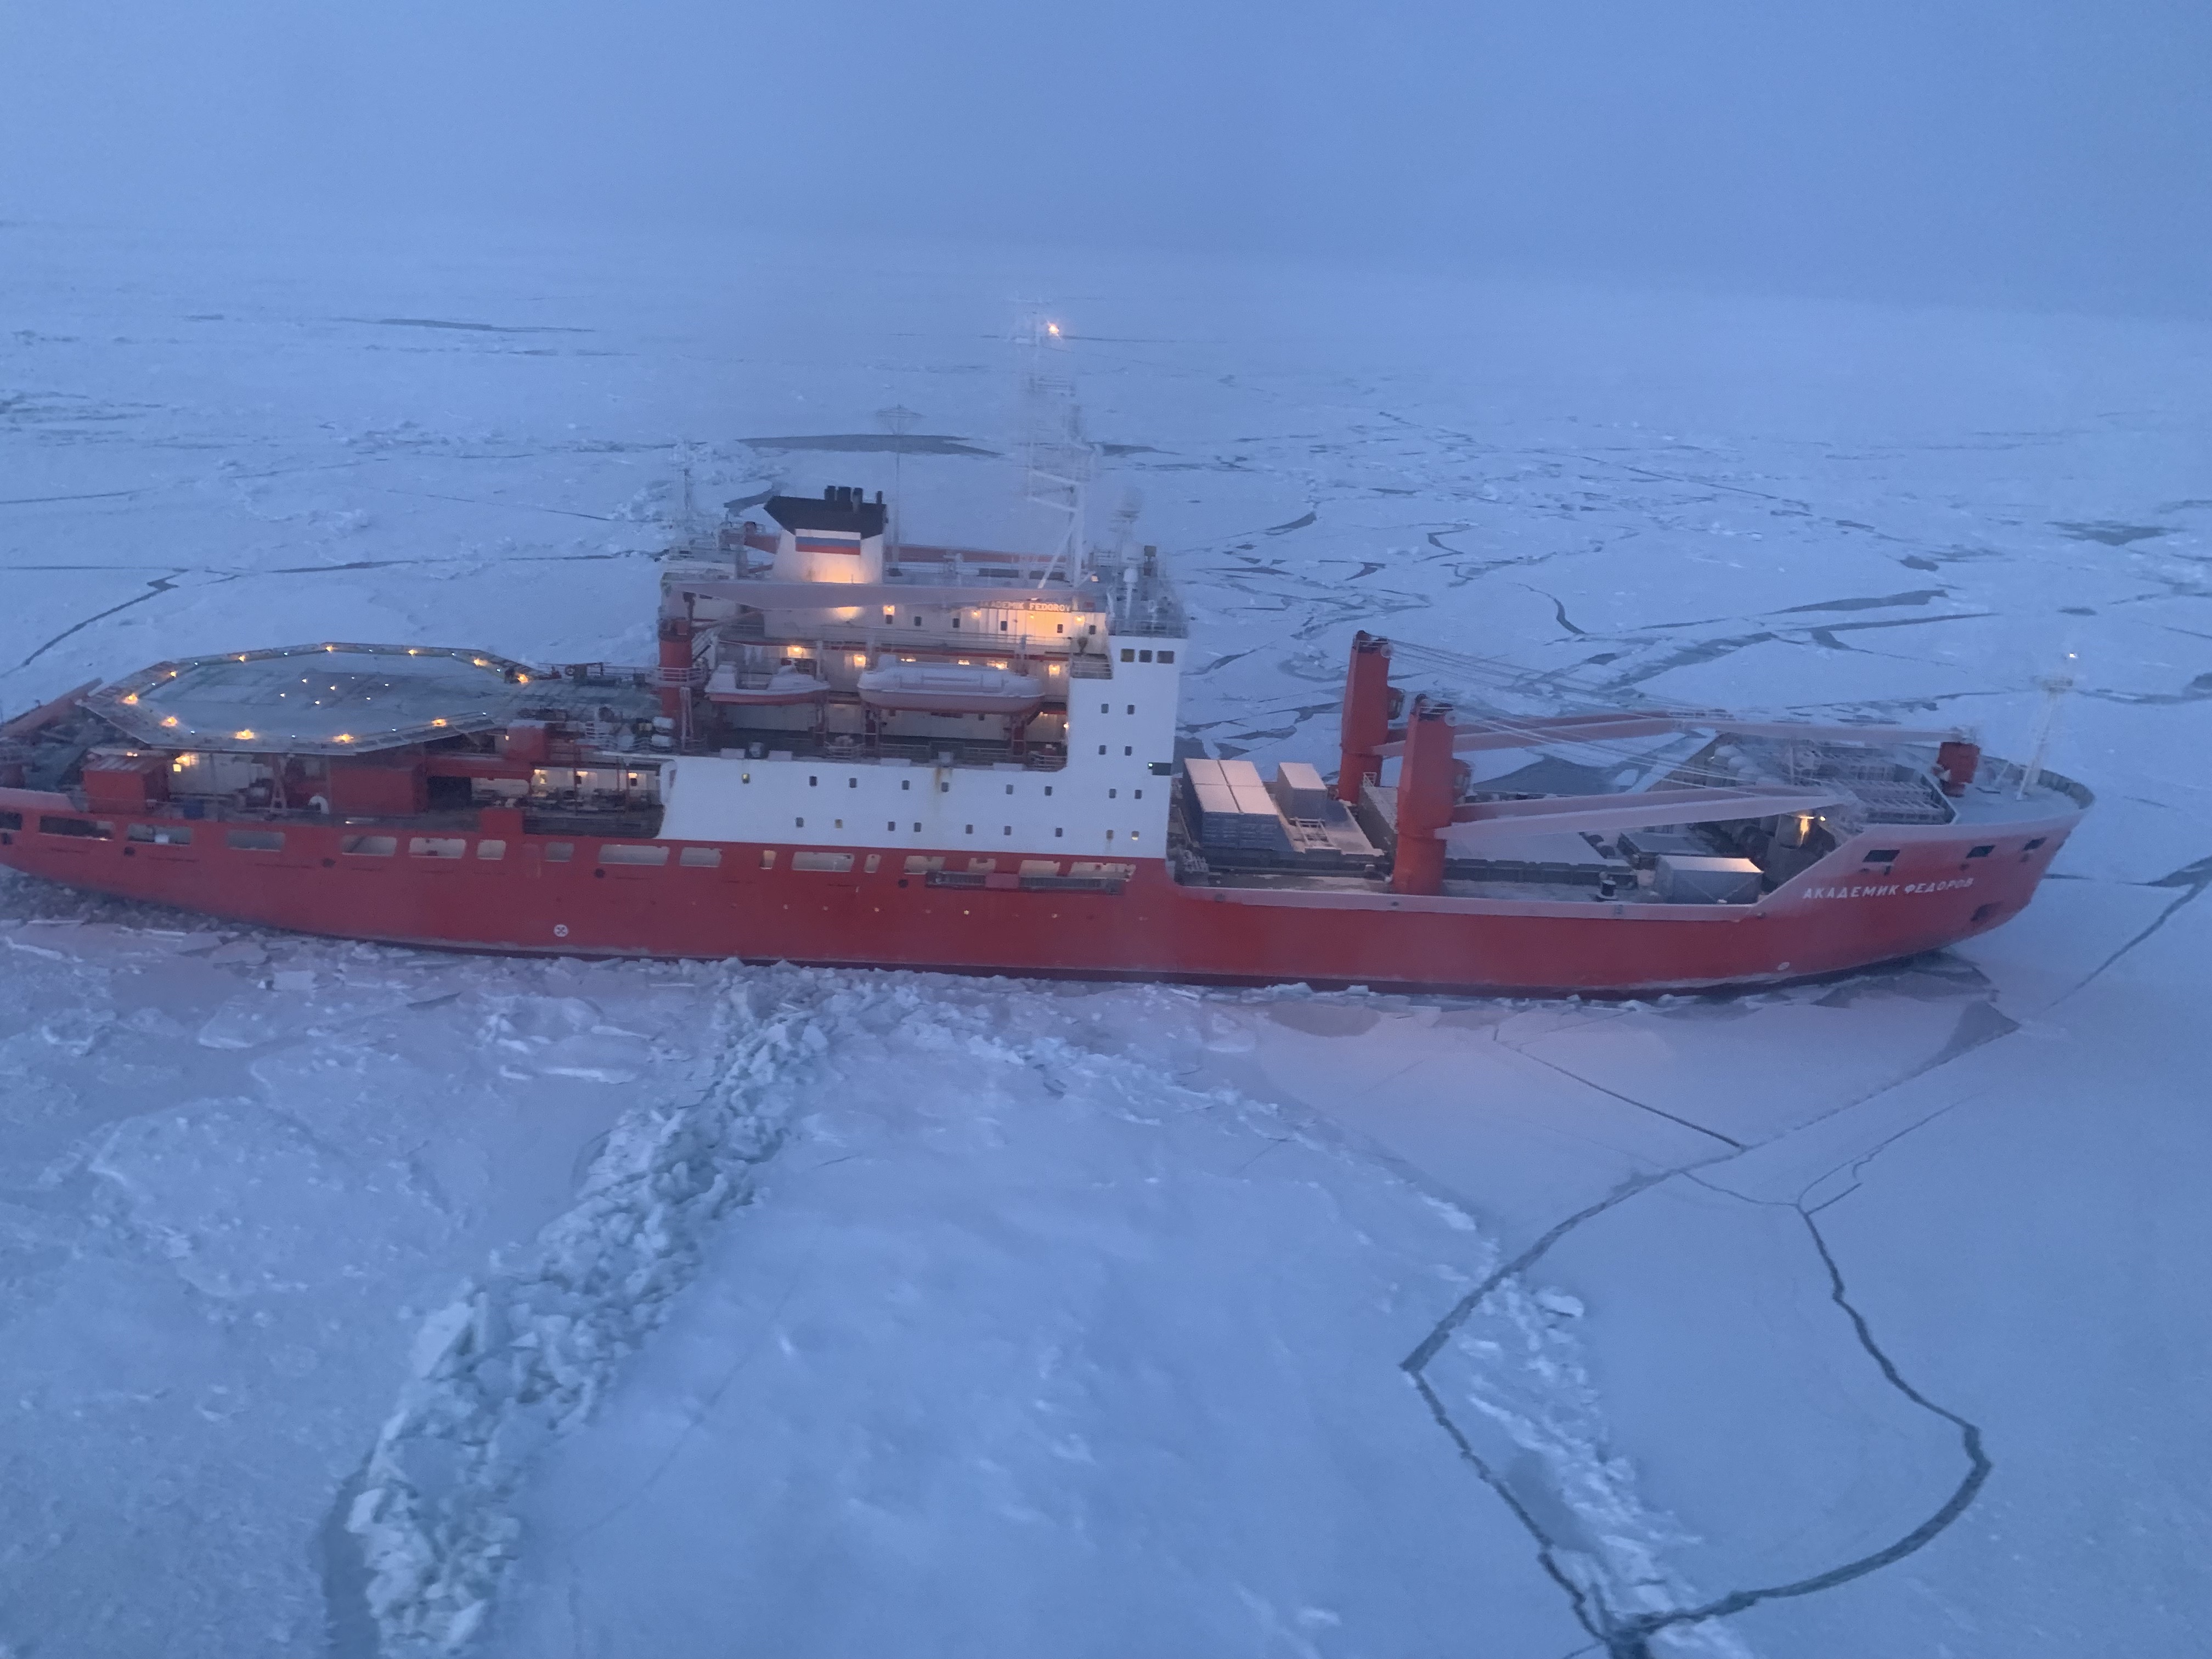
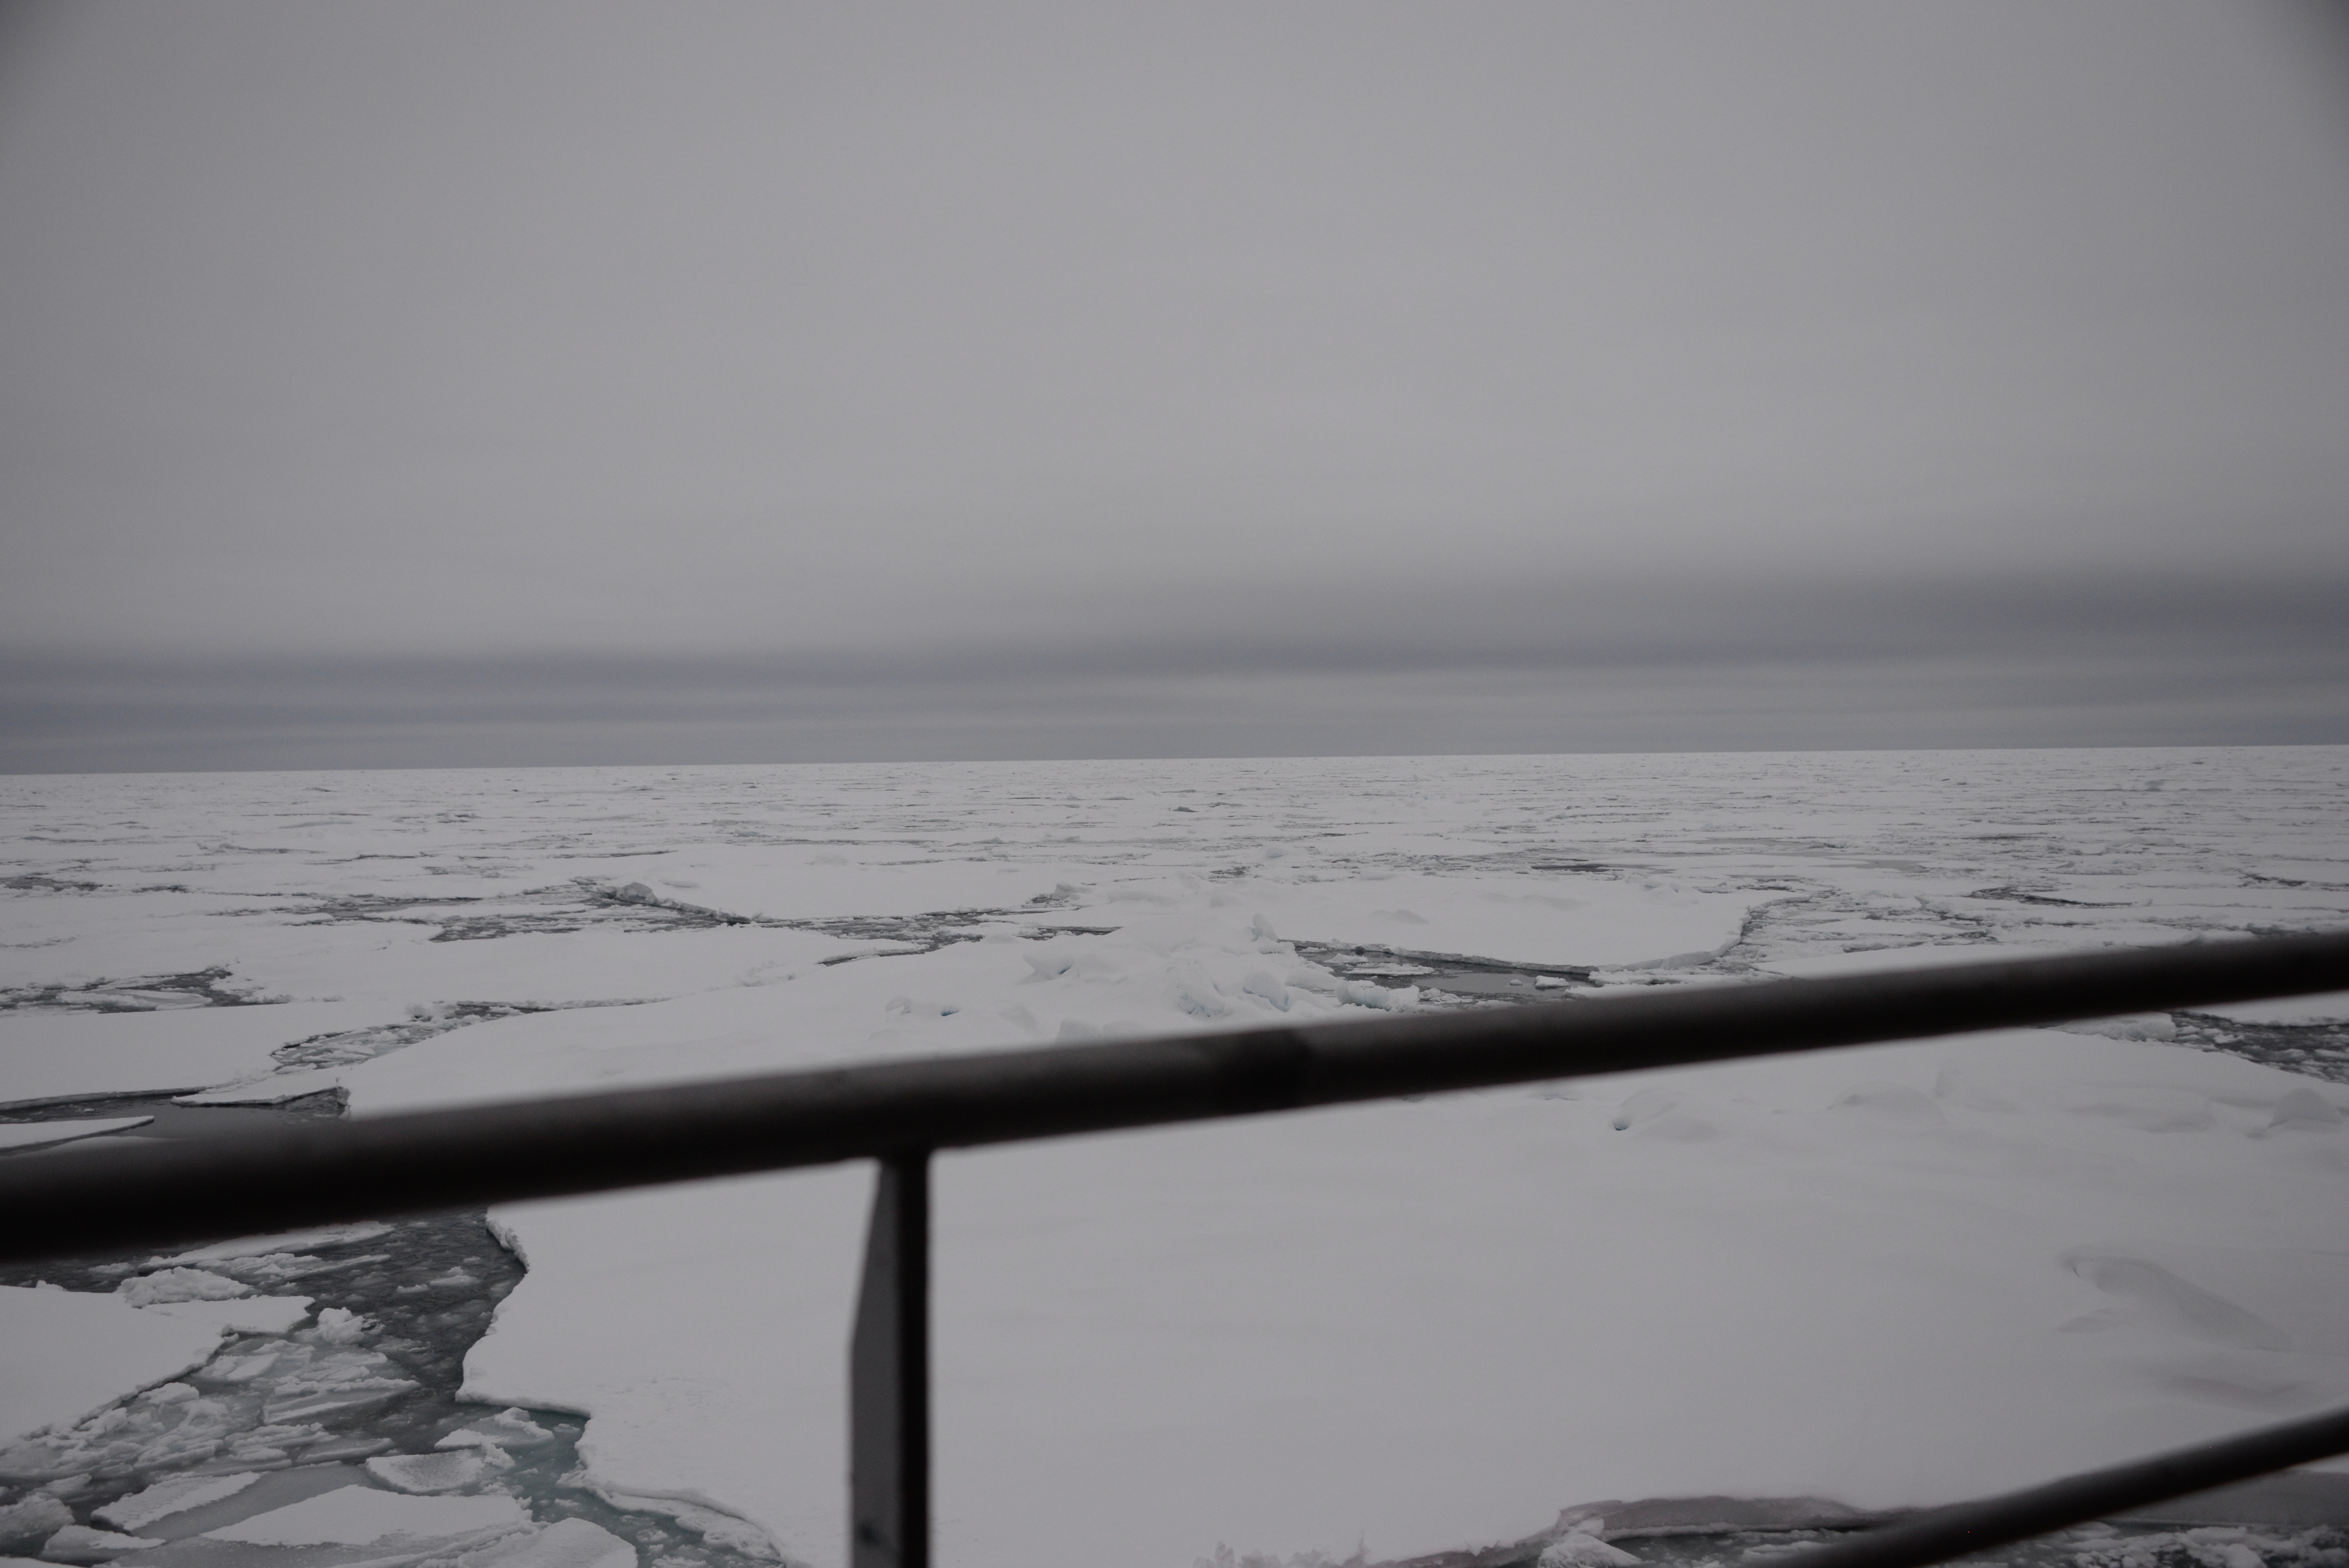
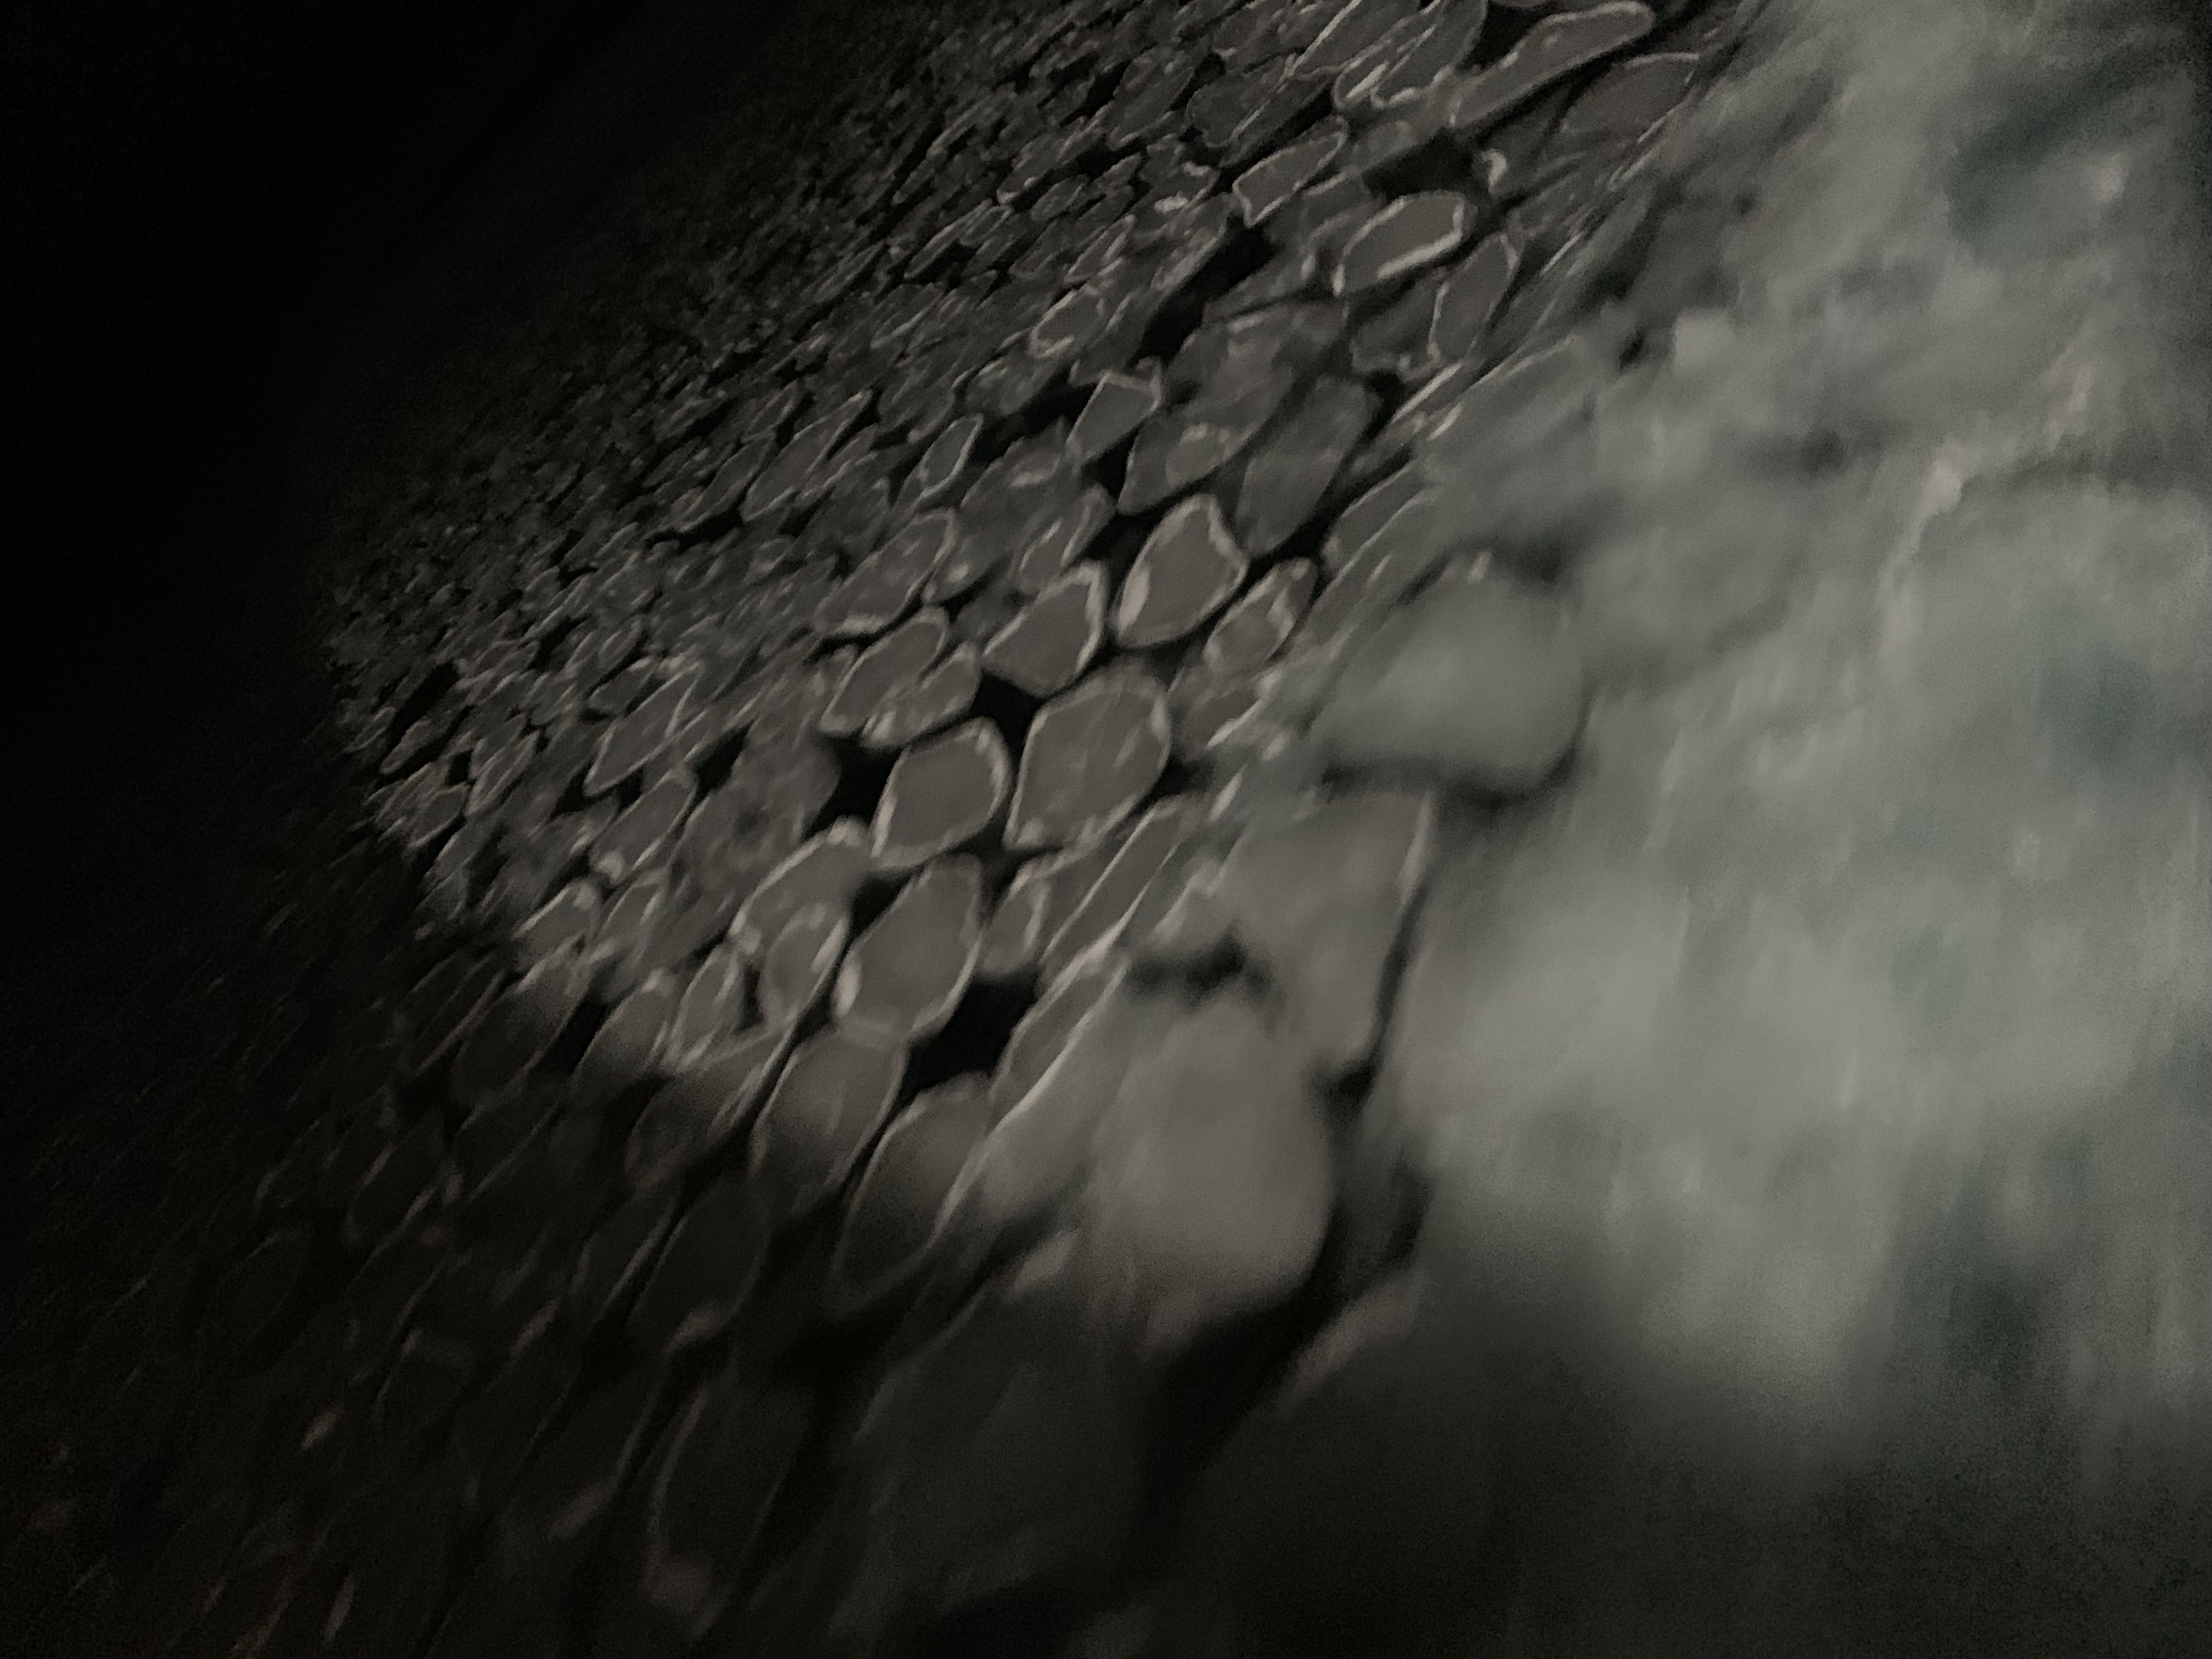
Take a look at the series of photos below taken by a MOSAiC team member who was on board the Akademik Fedorov, the Russian supply ship that went out with the Polarstern on Leg 1 of the expedition to help set up the Distributed Network. The photos were taken at various points in the Fedorov's journey from Tromsø, Norway out to the edge of the Arctic sea ice, but they are not shown in chronological order. Imagine you are the MOSAiC team member who took these photos. Write a series of short journal entries (one for each photo) describing your voyage out into the Arctic. What is the order in which you took each of these photos? What were the sea conditions like when you took each of these photos? What kind of ice do you see? How warm or cold is the air temperature? What other things might you be seeing (wildlife, etc.)? (Hint: Check out the Sea Ice Life Cycle Gallery linked to above for photos of ice in its various stages of formation.) Photo credits: Anne Gold
Additional Classroom Resource: Ice Floe Identification Lesson
In addition to going through life cycles of formation, sea ice goes through cycles of growth and melt throughout the year with the seasons. The MOSAiC expedition intentionally began during the seasonal sea ice minimum in 2019. This allowed the Polarstern to find an initial ice floe that would become surrounded by more sea ice as the Arctic winter approached. How exactly did the MOSAiC team identify a suitable ice floe in this early weeks of the expedition? In this lesson, students will use real data to work through a very similar process to what the MOSAiC team did to identify a suitable ice floe for a similar Arctic research expedition.
Lesson: Ice Floe Identification (grades 6-12)
Check out the full unit: Exploring the New & Old Arctic
Want to know more about how sea ice forms?
Watch MOSAiC sea ice scientist Melinda Webster explain in this video, How Sea Ice is Made:
 MOSAiC Weekly Tracking
Plot the Polarstern
Each week we will provide you with the latitude and longitude coordinates of the Polarstern so that you can track its journey across the Arctic.
Download the map to plot coordinates
Download a larger map of the Arctic for a bigger picture view of the expedition area
Location of the Polarstern
| Date | Latitude | Longitude |
| September 16, 2019 | 69.68 N | 18.99 E |
| September 23, 2019 | 72.31 N | 26.93 E |
| September 30, 2019 | 85.12 N | 138.05 E |
| October 4, 2019** | 85.08 N | 134.43 E |
| October 7, 2019 | 85.10 N | 133.82 E |
| October 14, 2019 | 84.85 N | 135.03 E |
| October 21, 2019 | 84.97 N | 132.73 E |
| October 28, 2019 | 85.47 N | 127.07 E |
| November 4, 2019 | 85.88 N | 121.70 E |
| November 11, 2019 | 85.82 N | 116.00 E |
| November 18, 2019 | 86.05 N | 122.43 E |
| November 25, 2019 | 85.85 N | 121.35 E |
| December 2, 2019 | 85.97 N | 112.95 E |
| December 9, 2019 | 86.25 N | 121.40 E |
| December 16, 2019 | 86.62 N | 118.12 E |
| December 23, 2019 | 86.63 N | 113.20 E |
| December 30, 2019 | 86.58 N | 117.13 E |
| January 6, 2020 | 87.10 N | 115.10 E |
| January 13, 2020 | 87.35 N | 106.63 E |
| January 20, 2020 | 87.42 N | 97.77 E |
| January 27, 2020 | 87.43 N | 95.82 E |
| February 3, 2020 | 87.42 N | 93.65 E |
| February 10, 2020 | 87.78 N | 91.52 E |
| February 17, 2020 | 88.07 N | 78.52 E |
| February 24, 2020 | 88.58 N | 52.87 E |
| March 2, 2020 | 88.17 N | 31.02 E |
| March 9, 2020 | 87.93 N | 24.20 E |
| March 16, 2020 | 86.87 N | 12.70 E |
| March 23, 2020 | 86.20 N | 15.78 E |
| March 30, 2020 | 85.37 N | 13.27 E |
| April 6, 2020 | 84.52 N | 14.38 E |
| April 13, 2020 | 84.28 N | 14.97 E |
| April 20, 2020 | 84.52 N | 14.57 E |
| April 27, 2020 | 83.93 N | 15.65 E |
| May 4, 2020 | 83.92 N | 18.03 E |
| May 11, 2020 | 83.47 N | 13.08 E |
| May 18+, 2020 | 83.32 N | 8.68 E |
| May 25+, 2020 | 82.43 N | 8.28 E |
| June 1+, 2020 | 81.33 N | 9.93 E |
| June 8+, 2020 | 78.10 N | 12.73 E |
| June 15+, 2020 | 82.20 N | 8.18 E |
| June 22, 2020 | 81.95 N | 9.27 E |
| June 29, 2020 | 82.03 N | 9.88 E |
| July 6, 2020 | 81.67 N | 5.22 E |
| July 13, 2020 | 81.40 N | 0.28 E |
| July 20, 2020 | 80.78 N | 0.42 W |
| July 27, 2020 | 79.55 N | 2.37 W |
| August 3, 2020 | 78.60 N | 4.37 W |
| August 10, 2020 | 79.90 N | 5.52 W |
| August 17+, 2020 | 88.28 N | 34.63 W |
| August 24, 2020 | 87.77 N | 105.67 E |
| August 31, 2020 | 88.30 N | 114.23 E |
| September 7, 2020 | 88.68 N | 111.57 E |
| September 14, 2020 | 89.03 N | 103.10 E |
| September 21+, 2020 | 88.37 N | 106.17 E |
| September 28+, 2020 | 83.05 N | 23.78 E |
| October 5+, 2020 | 77.65 N | 8.42 E |
**Day when MOSAiC reached the ice floe that the Polarstern will become frozen in and drift with for the next year.
+ Indicates when the Polarstern traveled under its own engine power (no drifting)
Log MOSAiC Data
Keep track of Arctic conditions over the course of the expedition:
**Note to students: If you are trying to access these documents in Google Drive and are unable to, it is likely because your school has blocked access. Try using a personal account to access them, or contact your teacher.
Download Data Logbook for Sept. 2019 - Dec. 2019
Download Data Logbook for Dec. 2019 - Mar. 2020
Download Data Logbook for Mar. 2020 - June 2020
Download Data Logbook for July 2020 - Oct. 2020
| Date | Length of day (hrs) | Air temperature (deg C) at location of Polarstern | Arctic Sea Ice Extent (million km2) |
| September 16, 2019 | 13.25 | High: 10 Low: 4.4 | 3.9 |
| September 23, 2019 | 12.35 | High: 6 Low: -1 | 4.1 |
| September 30, 2019 | 9.1 | -4.7 | 4.4 |
| October 4, 2019** | 6.27 | -13.0 | 4.5 |
| October 7, 2019 | 3.05 | -8.2 | 4.6 |
| October 14, 2019 | 0 | -14.7 | 4.8 |
| October 21, 2019 | 0 | -12.8 | 5.4 |
| October 28, 2019 | 0 | -18.3 | 6.8 |
| November 4, 2019 | 0 | -18.9 | 8.0 |
| November 11, 2019 | 0 | -25.5 | 8.7 |
| November 18, 2019 | 0 | -10.7 | 9.3 |
| November 25, 2019 | 0 | -18.4 | 10.0 |
| December 2, 2019 | 0 | -26.6 | 10.4 |
| December 9, 2019 | 0 | -23.1 | 11.2 |
| December 16, 2019 | 0 | -19.2 | 11.8 |
| December 23, 2019 | 0 | -26.9 | 12.2 |
| December 30, 2019 | 0 | -26.4 | 12.6 |
| January 6, 2020 | 0 | -28.0 | 13.0 |
| January 13, 2020 | 0 | -30.7 | 13.1 |
| January 20, 2020 | 0 | -27.1 | 13.6 |
| January 27, 2020 | 0 | -22.5 | 13.8 |
| February 3, 2020 | 0 | -28.8 | 14.1 |
| February 10, 2020 | 0 | -26.2 | 14.5 |
| February 17, 2020 | 0 | -31.9 | 14.4 |
| February 24, 2020 | 0 | -24.0 | 14.6 |
| March 2, 2020 | 0 | -35.5 | 14.8 |
| March 9, 2020 | 0 | -37.9 | 14.7 |
| March 16, 2020 | 10.5 | -27.5 | 14.7 |
| March 23, 2020 | 16.5 | -28.7 | 14.4 |
| March 30, 2020 | 24 | -28.6 | 14.0 |
| April 6, 2020 | 24 | -18.2 | 13.7 |
| April 13, 2020 | 24 | -25.8 | 13.6 |
| April 20, 2020 | 24 | -10.2 | 13.3 |
| April 27, 2020 | 24 | -11.7 | 12.8 |
| May 4, 2020 | 24 | -16.2 | 12.8 |
| May 11, 2020 | 24 | -10.4 | 12.4 |
| May 18, 2020 | 24 | -5.1 | 11.7 |
| May 25, 2020 | 24 | 0.4 | 11.5 |
| June 1, 2020 | 24 | 0.0 | 11.1 |
| June 8+, 2020 | 24 | -0.1 | 10.6 |
| June 15+, 2020 | 24 | -0.4 | 10.1 |
| June 22, 2020 | 24 | -0.4 | 9.6 |
| June 29, 2020 | 24 | 0.5 | 9.2 |
| July 6, 2020 | 24 | 0.6 | 8.2 |
| July 13, 2020 | 24 | 0.2 | 7.2 |
| July 20, 2020 | 24 | -0.1 | 6.2 |
| July 27, 2020 | 24 | 1.9 | 5.8 |
| August 3, 2020 | 24 | 1.2 | 5.5 |
| August 10, 2020 | 24 | 0.9 | 5.1 |
| August 17, 2020 | 24 | 0.7 | 4.6 |
| August 24, 2020 | 24 | -0.9 | 3.9 |
| August 31, 2020 | 24 | -0.9 | 3.7 |
| September 7, 2020 | 24 | -5.9 | 3.4 |
| September 14, 2020 | 24 | -0.5 | 3.8 |
| September 21, 2020 | 19.7 | -10.8 | 4.0 |
| September 28, 2020 | 10.4 | -9.2 | 4.4 |
| October 5, 2020 | 9.4 | 5.1 | 4.7 |
*Note: We expect data to fall within the following ranges: Length of day, 0-24 hours; Temperature, -40 to 14 degrees C; Sea ice extent, 3-15 million km2
**Day when MOSAiC reached the ice floe that the Polarstern will become frozen in and drift with for the next year.
Is there something you'd like to see in MOSAiC Monday? Let us know!
Send us your feedback
New to MOSAiC Monday? Check out past editions!
Browse more expedition-related educational resources, videos, and blogs
Email us! mosaic@colorado.edu