Can you solve these MOSAiC expedition math problems?
Check your answers here!
Race to the North
On February 24th, the Polarstern was 97 miles (156 km) from the North Pole. If you jumped on a snowmobile and headed out from the Polarstern straight towards the North Pole going 35 miles/hour, how long would it take you to get there? How much time would you save if you traveled at 55 miles/hour?
Cracks in the Ice
On March 9th, MOSAiC participants reported that a large crack, or lead, in the ice opened up about a mile from the Polarstern. The lead was about 3 miles (~5 km) long and about 545 yards (~500 m) wide. How much of the ocean's surface area was exposed by the opening of this lead? Remember that there are 1,760 yards in 1 mile.
BONUS: Ocean water absorbs more of the sun's heat than ice, which is very reflective. Why might we care about the size of leads and areas where the ocean is exposed in the Arctic? (Hint: Think about the Arctic climate system.)
Spuds on a Ship
It was reported that MOSAiC Leg II participants ate nearly 3,000 lbs (~1,360 kg) of potatoes! If an average potato weighs ~0.5 lbs, how many potatoes did Leg II participants eat?
On Thin (or Thick) Ice
How thick must sea ice be to support a small airplane?
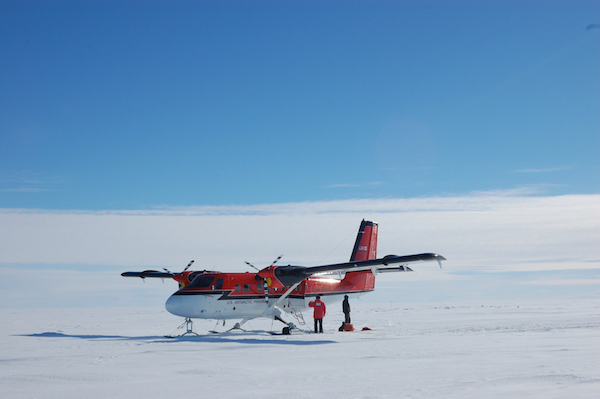
h=√(P/A) is a basic formula (sometimes called 'Gold's Formula') that can be used to calculate the ice thickness (h) that is needed to support a specific load (P), or weight of something. A in this equation is a constant that is related to assumptions about the nature of the ice (is it very cold and hard, is it thawing and weak, or is it somewhere in between)? We recommend using a value of 50 psi (pounds per square inch) for A, which is a conservative value for thawing (and thus the least strong) ice.
First, make a guess as to what you think the minimum thickness the sea ice underneath the runway must be to support the plane.
Then, calculate the actual minimum thickness the sea ice underneath the runway must be, assuming that the MOSAiC team wants it to be able to support a Twin Otter plane that weighs ~8,000 lbs. Does the answer surprise you? Is it similar to or different from what you guessed?
Find out how thick the ice under the runway actually is
Analyzing the Arctic
Can you use the MOSAiC weekly tracking numbers in the data tables below to answer the following questions? Challenge Levels: I (Low) - V (High)
MOSAiC Weekly Tracking Numbers
Location of the Polarstern:
| Date | Latitude | Longitude |
| September 16, 2019 | 69.68 N | 18.99 E |
| September 23, 2019 | 72.31 N | 26.93 E |
| September 30, 2019 | 85.12 N | 138.05 E |
| October 4, 2019** | 85.08 N | 134.43 E |
| October 7, 2019 | 85.10 N | 133.82 E |
| October 14, 2019 | 84.85 N | 135.03 E |
| October 21, 2019 | 84.97 N | 132.73 E |
| October 28, 2019 | 85.47 N | 127.07 E |
| November 4, 2019 | 85.88 N | 121.70 E |
| November 11, 2019 | 85.82 N | 116.00 E |
| November 18, 2019 | 86.05 N | 122.43 E |
| November 25, 2019 | 85.85 N | 121.35 E |
| December 2, 2019 | 85.97 N | 112.95 E |
| December 9, 2019 | 86.25 N | 121.40 E |
| December 16, 2019 | 86.62 N | 118.12 E |
| December 23, 2019 | 86.63 N | 113.20 E |
| December 30, 2019 | 86.58 N | 117.13 E |
| January 6, 2020 | 87.10 N | 115.10 E |
| January 13, 2020 | 87.35 N | 106.63 E |
| January 20, 2020 | 87.42 N | 97.77 E |
| January 27, 2020 | 87.43 N | 95.82 E |
| February 3, 2020 | 87.42 N | 93.65 E |
| February 10, 2020 | 87.78 N | 91.52 E |
| February 17, 2020 | 88.07 N | 78.52 E |
| February 24, 2020 | 88.58 N | 52.87 E |
| March 2, 2020 | 88.17 N | 31.02 E |
| March 9, 2020 | 87.93 N | 24.20 E |
| March 16, 2020 | 86.87 N | 12.70 E |
**Day when MOSAiC reached the ice floe that the Polarstern will become frozen in and drift with for the next year.
Oceanographic and Meteorologic Data:
| Date | Length of day (hrs) | Air temperature (deg C) at location of Polarstern | Arctic Sea Ice Extent (million km2) |
| September 16, 2019 | 13.25 | High: 10 Low: 4.4 | 3.9 |
| September 23, 2019 | 12.35 | High: 6 Low: -1 | 4.1 |
| September 30, 2019 | 9.1 | -4.7 | 4.4 |
| October 4, 2019** | 6.27 | -13.0 | 4.5 |
| October 7, 2019 | 3.05 | -8.2 | 4.6 |
| October 14, 2019 | 0 | -14.7 | 4.8 |
| October 21, 2019 | 0 | -12.8 | 5.4 |
| October 28, 2019 | 0 | -18.3 | 6.8 |
| November 4, 2019 | 0 | -18.9 | 8.0 |
| November 11, 2019 | 0 | -25.5 | 8.7 |
| November 18, 2019 | 0 | -10.7 | 9.3 |
| November 25, 2019 | 0 | -18.4 | 10.0 |
| December 2, 2019 | 0 | -26.6 | 10.4 |
| December 9, 2019 | 0 | -23.1 | 11.2 |
| December 16, 2019 | 0 | -19.2 | 11.8 |
| December 23, 2019 | 0 | -26.9 | 12.2 |
| December 30, 2019 | 0 | -26.4 | 12.6 |
| January 6, 2020 | 0 | -28.0 | 13.0 |
| January 13, 2020 | 0 | -30.7 | 13.1 |
| January 20, 2020 | 0 | -27.1 | 13.6 |
| January 27, 2020 | 0 | -22.5 | 13.8 |
| February 3, 2020 | 0 | -28.8 | 14.1 |
| February 10, 2020 | 0 | -26.2 | 14.5 |
| February 17, 2020 | 0 | -31.9 | 14.4 |
| February 24, 2020 | 0 | -24.0 | 14.6 |
| March 2, 2020 | 0 | -35.5 | 14.8 |
| March 9, 2020 | 0 | -37.9 | 14.7 |
| March 16, 2020 | 10.5 | -27.5 | 14.7 |
*Note: We expect data to fall within the following ranges: Length of day, 0-24 hours; Temperature, -40 to 14 degrees C; Sea ice extent, 3-15 million km2
**Day when MOSAiC reached the ice floe that the Polarstern will become frozen in and drift with for the next year.
Challenge Questions
Level I: How far (linear distance) did the Polarstern drift between November 11, 2019 and March 9, 2020? To determine this, use an online lat/long distance calculator, such as NOAA's Latitude/Longitude Distance Calculator tool. For an EXTRA challenge (Level V+), explore calculating this by hand using trigonometry.
Level II: How much did the sea ice extent increase between September 16 and November 25? BONUS Challenge (Level IV): If the mean sea ice thickness during this time was 3.64 meters, what was in the increase in ice volume? What about if the mean ice thickness was 1.89 meters? Note: 3.64 m was the mean Arctic sea ice thickness in 1980 and 1.89 m was the mean Arctic sea ice thickness in 2008; Source: Kwok & Rothrock, 2009
Level III: What is the average temperature that participants on the Polarstern have experienced thus far?
Level IV: Do you notice any relationships or correlations between length of day, air temperature, and sea ice extent? If so, what do you notice?
Level V: What has been the average rate of change of sea ice growth in the Arctic from sea ice minimum to sea ice maximum?