Studying Arctic Clouds - Frozen in the ice over 20 years ago!
What did we know about Arctic clouds before the 2019-2020 MOSAiC Arctic research expedition? Let's go back in time to October of 1997....the Canadian icebreaker Des Groseilliers attaches itself to an ice floe about 350 miles (~570 km) northeast of Prudhoe Bay, Alaska and spends a year frozen in the ice. Like MOSAiC, researchers on this expedition known as SHEBA (Surface Heat Budget of the Arctic Ocean) set up a suite of instruments on the sea ice around the ship to collect data specifically about how heat is exchanged between the Arctic Ocean and atmosphere. They made some new and important discoveries about the Arctic atmosphere, especially about how Arctic clouds are connected to Arctic temperatures.
 Quick Bite: Correlation, Causation, and Clouds
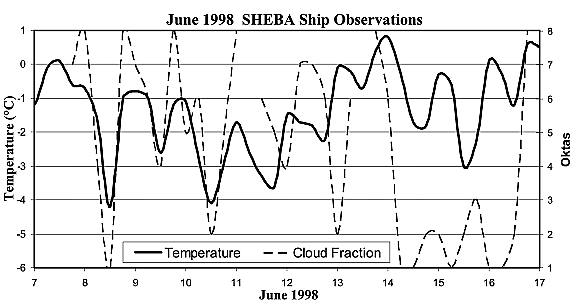
Check out the graph to the left, which shows June air temperature from the SHEBA expedition plotted with 'cloud fraction,' or how much of the sky is filled with clouds. An 'okta' is a unit of measurement we use to describe cloud cover at a particular place, where 0 oktas = completely clear sky with no clouds, and 8 oktas = sky completely filled with clouds. Do you see any patterns, or any correlation between surface temperature in the Arctic and cloud cover? If so, can you draw any conclusions about cause and effect from this data? Does one thing (e.g., clouds) affect the other (e.g., temperature) or can you tell? What is the difference between correlation and causation? Figure credit: Bromwich et al., 2009)