 Quick Bite: Weathering the Storms
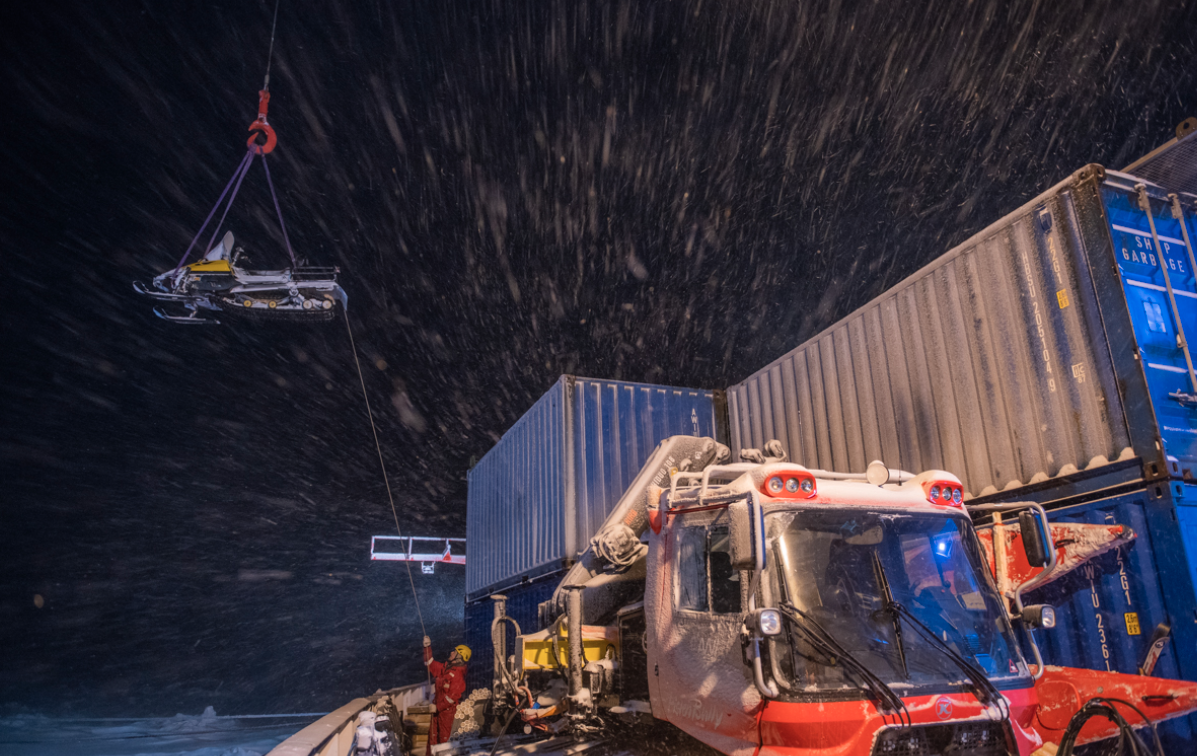
Atmospheric scientists who participated in the 2019-2020 MOSAiC Arctic research expedition were particularly interested in air pressure because changes in air pressure can mean big changes in weather, and changes in weather affected scientific activities on the ice, the resilience of the equipment on the ice, and whether or not the expedition helicopters could fly. The Polarstern weathered (pun intended) a couple of serious storms that caused the ice to move around the ship, cracking and ridging and wreaking havoc on some of the science cities. Photo: MOSAiC crew hoist skidoos off of the sea ice as a storm rolls in; Photo credit: Esther Horvath
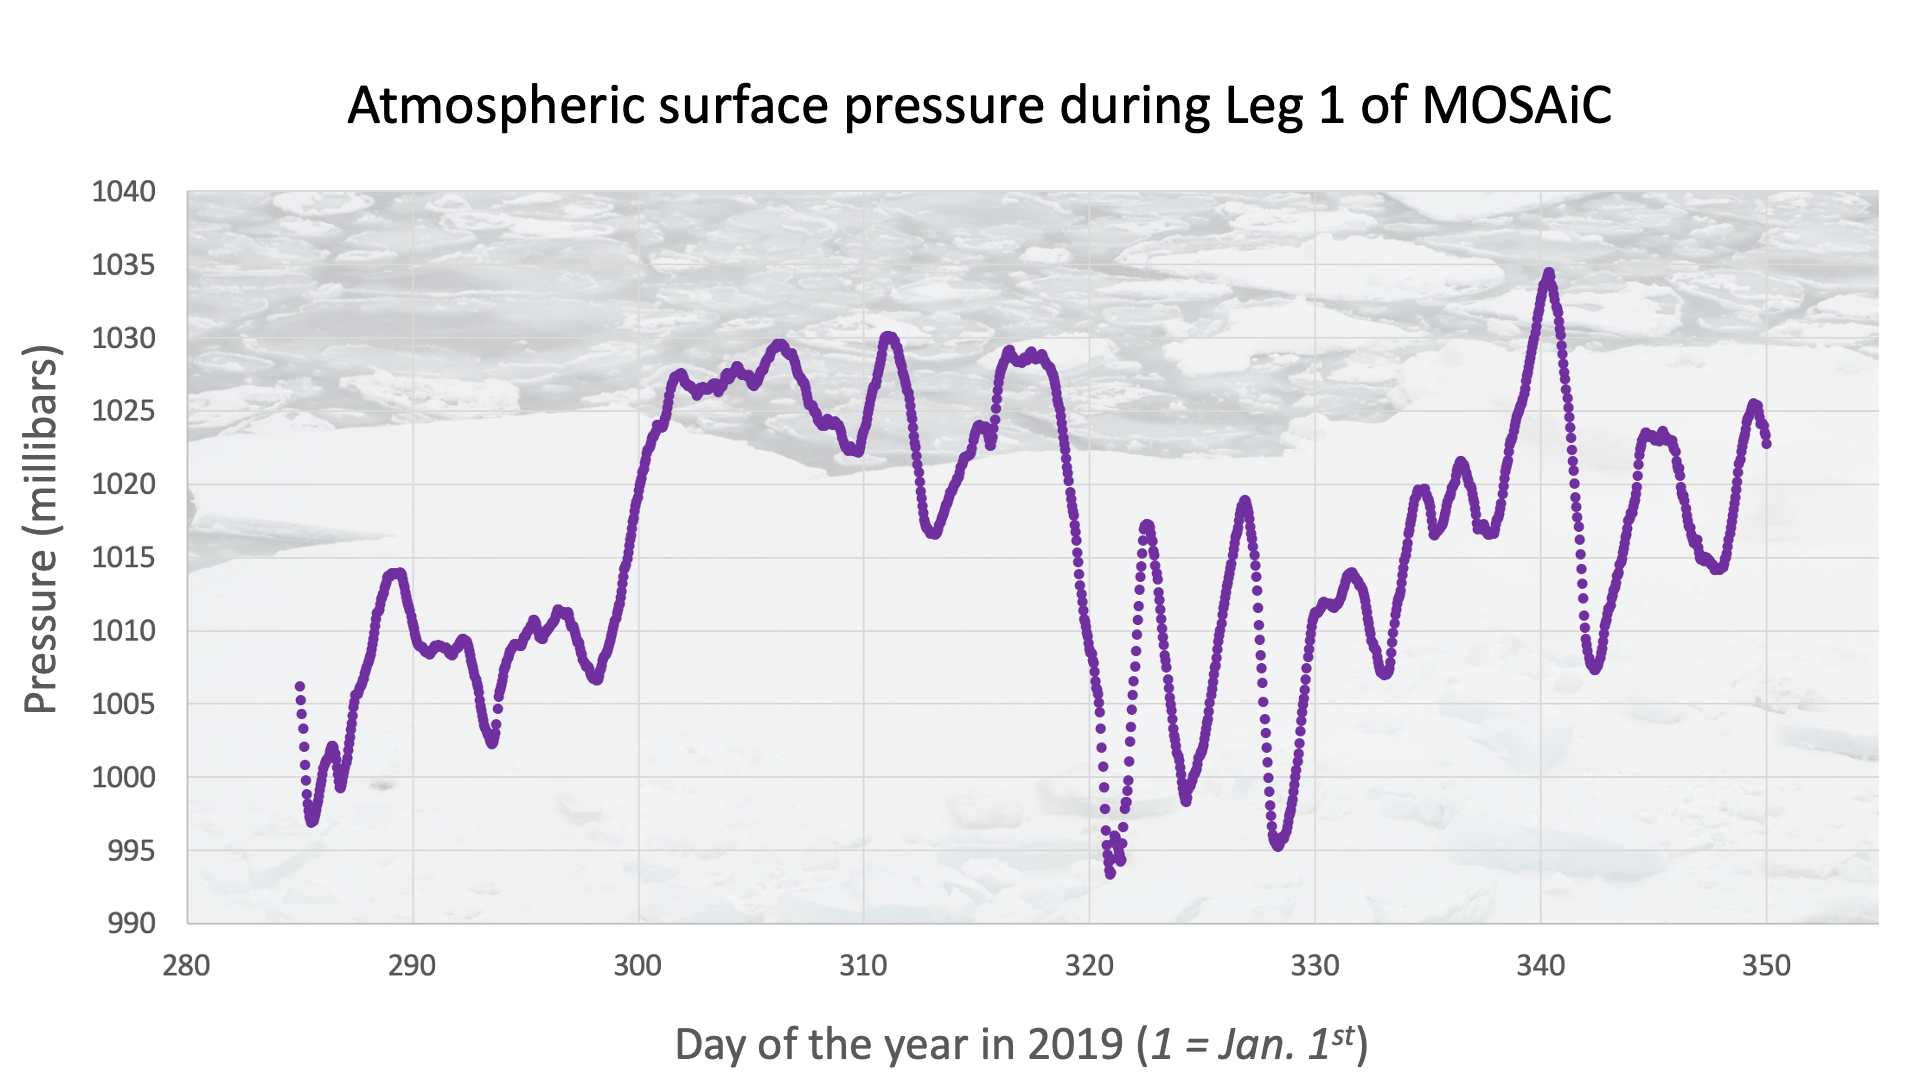
Below is a graph showing the preliminary (surface) atmospheric pressure data near the Polarstern from MOSAiC Leg I. Preliminary means that this data hasn't yet been put through a rigorous quality assurance check, but we've gotten the initial ok to share it with you. Watch the short video above about how atmospheric pressure is connected to weather. Can you identify when storms might have happened at the location of Polarstern from this graph? You might notice that the x-axis of this graph is in units of 'day of the year,' where January 1st = 1 (and January 31st = 31, and February 28th = 59, and so on...). Can you figure out the dates of the possible storms you identified? The MOSAiC web app reported on one major storm that hit the Polarstern during Leg I - scroll back in time through the web app blog to see if you identified a storm correctly in the pressure data. Data courtesy of expedition co-coordinator Matt Shupe