*NEW* MOSAiC Expedition Office Hours - Mondays and Wednesdays from 12-1 pm MT
Are you interested in MOSAiC-related educational resources but don’t know how to get started? Join MOSAiC curriculum developer Jon Griffith for “MOSAiC office hours”. Starting Monday, April 13th, Jon will be available via Zoom Mondays and Wednesdays from 12 pm – 1 pm MT to discuss implementation strategies, answer questions, and point you to the latest MOSAiC curriculum, virtual field trips, real-time datasets, videos, and other Arctic resources. Please note that this is an informal event and that you are encouraged to come and go as you wish!
Zoom Room link: https://cuboulder.zoom.us/j/
 This week's Museum of MOSAiC Art Challenge
We challenge YOU to create a piece of art (drawing, sculpture, poem, etc.) that reflects your feelings about sea ice.
Submit a photo of your artwork here to be featured in the Museum of MOSAiC Art!
Browse the Museum of MOSAiC Art virtual galleries
The Ocean: Part 3
Up, Down, and All Around
Did you miss Parts 1 and 2? Check out Part 1 here and Part 2 here!

Have you ever noticed that things like salad dressing, if you let them sit for a bit, separate out into different layers? If this doesn't sound familiar to you, you can recreate it by pouring a bit of cooking oil and water into a clear glass and seeing what happens, or follow the link below to make your own rainbow in a jar. Photo credit: Steve Spangler Science
Hands-on Science at Home: Create your own 7-layer rainbow in a jar
How can one liquid 'float' on top of another? The story here is all about density - just as solid objects that are less dense than water will float in it, less dense liquids will float on top of more dense liquids. This simple law of physics turns out to be the driver of a global ocean conveyor belt that has a big impact on global climate.
The Ocean's Propensity for Density
The two things that have the biggest influence on ocean water density are temperature (amount of heat in the water) and salinity (how salty the water is, or how much stuff is dissolved in it). What do you think is more dense: cold water or warm water? What about salty water vs. fresh water?
The density of sea water is often different as you move from the surface to depth, and these differences can determine how ocean water behaves. If less dense layers are already sitting on top of more dense layers (a stable situation), nothing will really happen or change - in other words, the layers won't really mix with one another. But if more dense water suddenly ends up on top of less dense water, the denser water will sink, which will start the flow of a current in the ocean. In fact, this phenomenon of water flowing up and down and all around because of differences in density occurs on a global scale and is called thermohaline circulation, or the global ocean conveyor belt. More on this below...
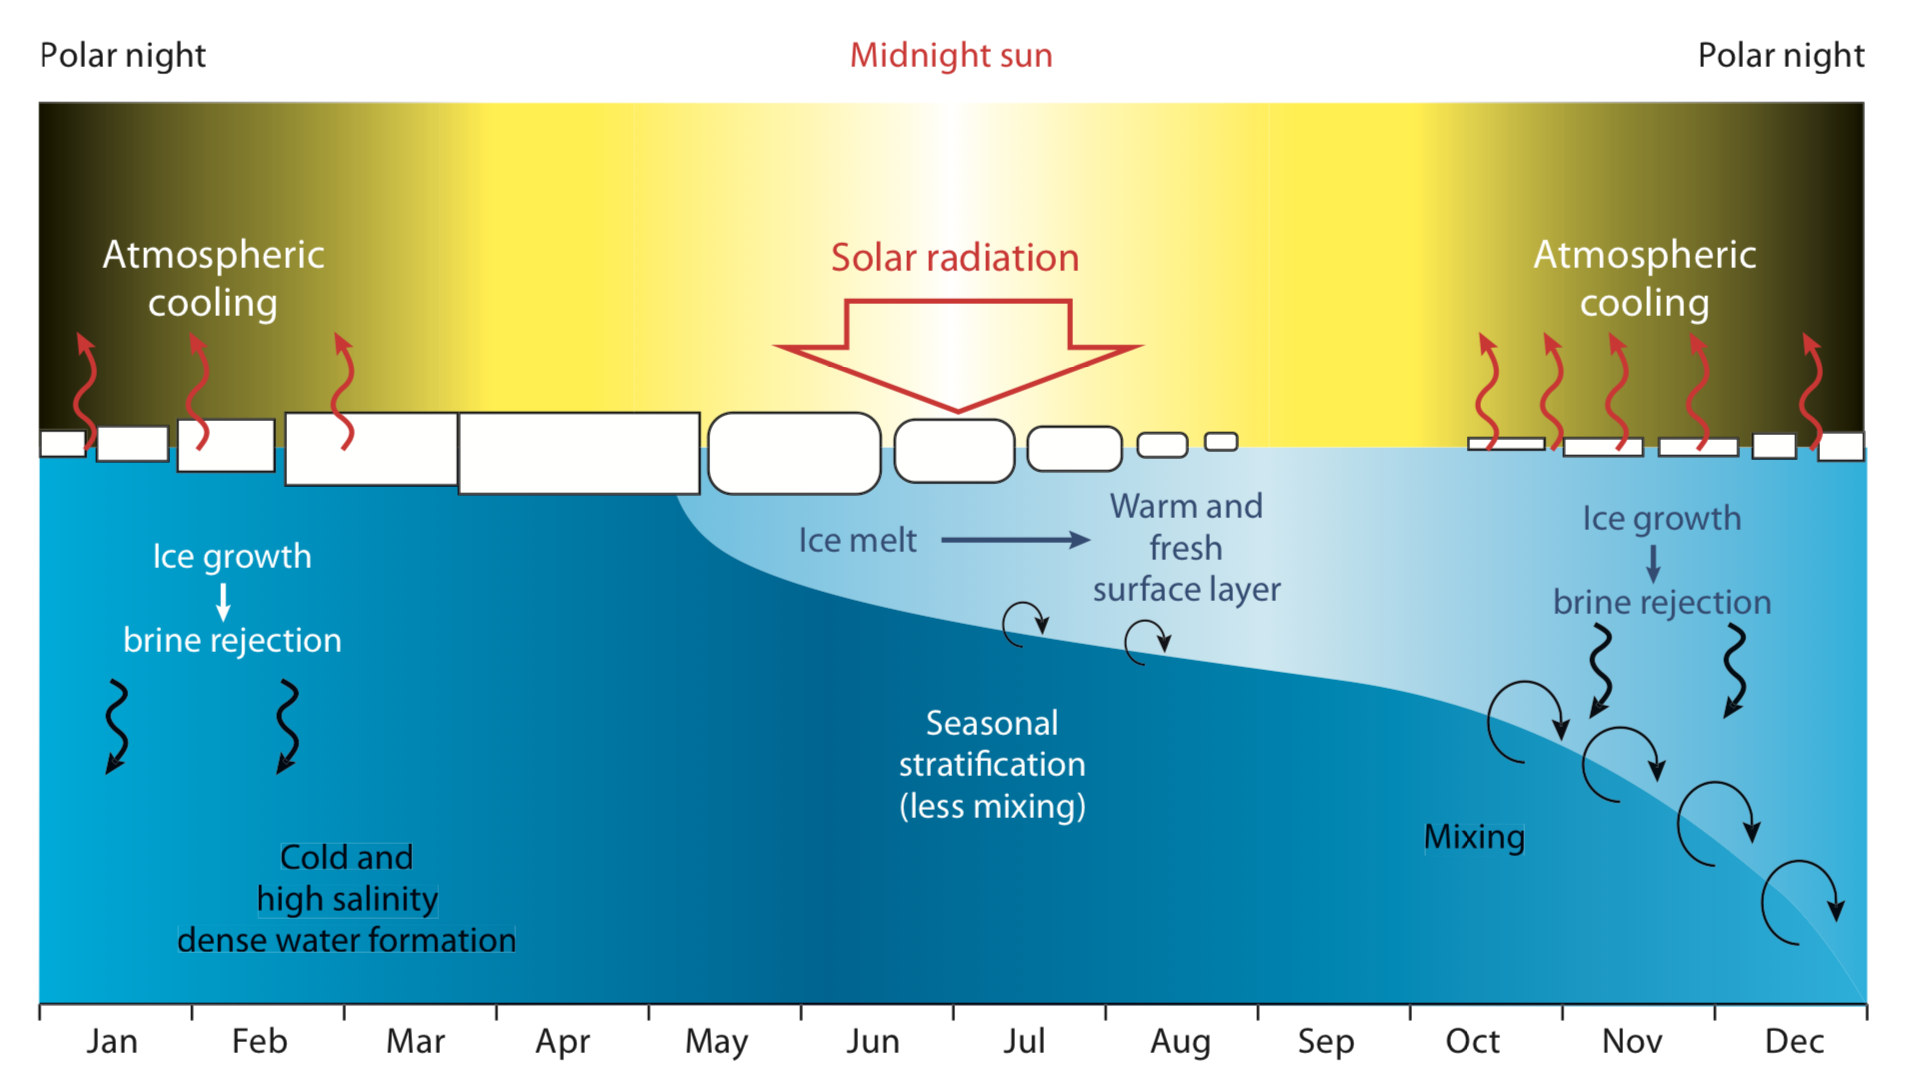
Figure (L): What happens at the ocean's surface in the Beaufort and Chukchi Seas seasonally influences what happens below. In the winter, sea ice formation results in cold, salty water forming at the surface and sinking. In summer, ice melt results in a warmer, fresher, less dense layer of water at the surface which keeps the ocean pretty stratified (not a lot of vertical flow or mixing of water). Figure credit: Peralta-Ferriz and Woodgate, 2015
What Happens in the Arctic Travels the Globe
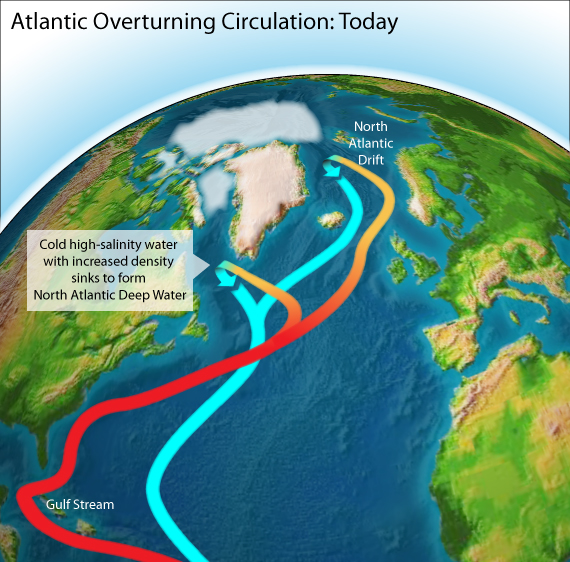
The Arctic plays an important role in driving thermohaline circulation - when winter rolls around in the Arctic, the water at the surface freezes into sea ice, but it leaves the salt behind. The ocean water underneath this sea ice becomes denser because it is more saline, so it sinks and draws surface waters in to replace it. Two key places where this happens is in the Labrador Sea and off the southeast coast of Greenland. Figure (R) credit: Illustration by jg. Source for Earth's topology: NASA/JPL-Caltech
Watch the video below to see how cold, dense water sinking in the Arctic drives the flow of water around the globe. Thermohaline circulation is often called the 'global ocean conveyor belt' because it carries with it various things, like heat, and distributes them around the globe. If this didn't happen, Northern Europe's climate would actually be several degrees colder on average than it is. What do you think could happen to global ocean circulation and the climate of places like Northern Europe if sea ice were to disappear in the Arctic?
Read more in Yale Climate Connections
 The Arctic and global ocean circulation
As you watch this video, keep a look out for places where water moves up and down in the ocean. When you see it happen, pause the video and write down your hypothesis for why you think this is happening. If water is moving up towards the surface ocean, what must be happening to its density, and what might be a reason for this?
Video credit: NASA/Goddard Space Flight Center/UMBC
Printable map and infographic of the global ocean conveyor belt from National Geographic
 #askmosaic: Packing for the Arctic
Billy from Seneca Falls Middle School wants to know: What type of stuff/supplies do you bring on board the ship?
I brought personal items, just like I'd take on a trip anywhere else - clothes, bath products, my computer and an iPad loaded with lots of books, movies and music. I brought exercise clothes so I can use the gym on the ship. I also brought cold weather clothes - long underwear tops and bottoms, insulated socks and glove liners, although the Alfred Wagner Institute, that is organizing the expedition, provided us with most of the cold weather gear we need. I also brought a stash of candy as a treat for myself when I'm feeling down about being so far away from home.
-John Cassano, University of Colorado Boulder, MOSAiC Team Atmosphere
Send us your #askmosaic questions!
Send words of encouragement to MOSAiC team members on board the Polarstern
 This week's featured remote learning resources
WHOI Polar Discovery: Arctic Ocean Circulation Interactive
The Arctic Ocean isn't a stagnant body of water cut off from all other oceans. Explore what happens to ocean water when it enters the Arctic Ocean through the Bering Strait - track it as it moves up and down and all around in this interactive from Woods Hole Oceanographic Institution.
Go to Arctic Ocean Circulation Interactive
Reach the World At-Home Learning
Reach the World is a MOSAiC partner and fantastic program that aims to help kids become globally conscious by connecting classrooms virtually with travelers and explorers around the globe. In light of recent events, RTW has launched an at-home learning site where they will share free virtual learning lesson plans, host video conferencing tutorials, and share curated lists of resources for educators and parents. Check it out, and keep following MOSAiC with RTW's Explorer Program!
Go to Reach the World At-Home Learning
Check out RTW's MOSAiC program page
Check out our full list of virtual and at-home polar learning resources here!
 MOSAiC Weekly Tracking
Plot the Polarstern
Each week we will provide you with the latitude and longitude coordinates of the Polarstern so that your students can track its journey across the Arctic in your classroom.
Download the map to plot coordinates
Download a larger map of the Arctic for a bigger picture view of the expedition area
Location of the Polarstern
| Date | Latitude | Longitude |
| September 16, 2019 | 69.68 N | 18.99 E |
| September 23, 2019 | 72.31 N | 26.93 E |
| September 30, 2019 | 85.12 N | 138.05 E |
| October 4, 2019** | 85.08 N | 134.43 E |
| October 7, 2019 | 85.10 N | 133.82 E |
| October 14, 2019 | 84.85 N | 135.03 E |
| October 21, 2019 | 84.97 N | 132.73 E |
| October 28, 2019 | 85.47 N | 127.07 E |
| November 4, 2019 | 85.88 N | 121.70 E |
| November 11, 2019 | 85.82 N | 116.00 E |
| November 18, 2019 | 86.05 N | 122.43 E |
| November 25, 2019 | 85.85 N | 121.35 E |
| December 2, 2019 | 85.97 N | 112.95 E |
| December 9, 2019 | 86.25 N | 121.40 E |
| December 16, 2019 | 86.62 N | 118.12 E |
| December 23, 2019 | 86.63 N | 113.20 E |
| December 30, 2019 | 86.58 N | 117.13 E |
| January 6, 2020 | 87.10 N | 115.10 E |
| January 13, 2020 | 87.35 N | 106.63 E |
| January 20, 2020 | 87.42 N | 97.77 E |
| January 27, 2020 | 87.43 N | 95.82 E |
| February 3, 2020 | 87.42 N | 93.65 E |
| February 10, 2020 | 87.78 N | 91.52 E |
| February 17, 2020 | 88.07 N | 78.52 E |
| February 24, 2020 | 88.58 N | 52.87 E |
| March 2, 2020 | 88.17 N | 31.02 E |
| March 9, 2020 | 87.93 N | 24.20 E |
| March 16, 2020 | 86.87 N | 12.70 E |
| March 23, 2020 | 86.20 N | 15.78 E |
| March 30, 2020 | 85.37 N | 13.27 E |
| April 6, 2020 | 84.52 N | 14.38 E |
| April 13, 2020 | 84.28 N | 14.97 E |
**Day when MOSAiC reached the ice floe that the Polarstern will become frozen in and drift with for the next year.
Log MOSAiC Data
Keep track of Arctic conditions over the course of the expedition:
Download Data Logbook for Sept. 2019 - Dec. 2019
Download Data Logbook for Dec. 2019 - Mar. 2020
*NEW* Download Data Logbook for Mar. 2020 - June 2020
Having trouble accessing these data logbooks? Email us at mosaic@colorado.edu
| Date | Length of day (hrs) | Air temperature (deg C) at location of Polarstern | Arctic Sea Ice Extent (million km2) |
| September 16, 2019 | 13.25 | High: 10 Low: 4.4 | 3.9 |
| September 23, 2019 | 12.35 | High: 6 Low: -1 | 4.1 |
| September 30, 2019 | 9.1 | -4.7 | 4.4 |
| October 4, 2019** | 6.27 | -13.0 | 4.5 |
| October 7, 2019 | 3.05 | -8.2 | 4.6 |
| October 14, 2019 | 0 | -14.7 | 4.8 |
| October 21, 2019 | 0 | -12.8 | 5.4 |
| October 28, 2019 | 0 | -18.3 | 6.8 |
| November 4, 2019 | 0 | -18.9 | 8.0 |
| November 11, 2019 | 0 | -25.5 | 8.7 |
| November 18, 2019 | 0 | -10.7 | 9.3 |
| November 25, 2019 | 0 | -18.4 | 10.0 |
| December 2, 2019 | 0 | -26.6 | 10.4 |
| December 9, 2019 | 0 | -23.1 | 11.2 |
| December 16, 2019 | 0 | -19.2 | 11.8 |
| December 23, 2019 | 0 | -26.9 | 12.2 |
| December 30, 2019 | 0 | -26.4 | 12.6 |
| January 6, 2020 | 0 | -28.0 | 13.0 |
| January 13, 2020 | 0 | -30.7 | 13.1 |
| January 20, 2020 | 0 | -27.1 | 13.6 |
| January 27, 2020 | 0 | -22.5 | 13.8 |
| February 3, 2020 | 0 | -28.8 | 14.1 |
| February 10, 2020 | 0 | -26.2 | 14.5 |
| February 17, 2020 | 0 | -31.9 | 14.4 |
| February 24, 2020 | 0 | -24.0 | 14.6 |
| March 2, 2020 | 0 | -35.5 | 14.8 |
| March 9, 2020 | 0 | -37.9 | 14.7 |
| March 16, 2020 | 10.5 | -27.5 | 14.7 |
| March 23, 2020 | 16.5 | -28.7 | 14.4 |
| March 30, 2020 | 24 | -28.6 | 14.0 |
| April 6, 2020 | 24 | -18.2 | 13.7 |
| April 13, 2020 | 24 | -25.8 | 13.6 |
*Note: We expect data to fall within the following ranges: Length of day, 0-24 hours; Temperature, -40 to 14 degrees C; Sea ice extent, 3-15 million km2
**Day when MOSAiC reached the ice floe that the Polarstern will become frozen in and drift with for the next year.
Is there something you'd like to see in MOSAiC Monday? Let us know!
Send us your feedback
New to MOSAiC Monday? Check out past editions!
Browse more expedition-related educational resources, videos, and blogs
Email us! mosaic@colorado.edu