Immerse Yourself in the 1893 Fram Expedition
Explore the Arctic Aboard the Fram
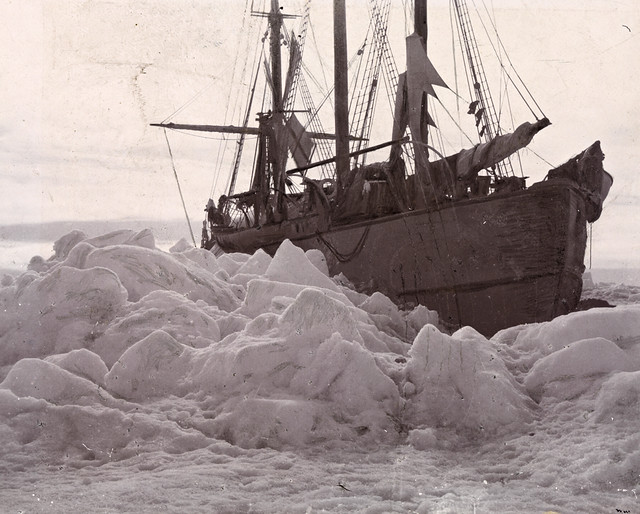
If you've been following MOSAiC Monday since the MOSAiC expedition began, you'll remember that MOSAiC is following in the footsteps of the Fram expedition more than 125 years ago. In 1893, Norwegian explorer Fridtjof Nansen and his crew set sail for the Arctic in their wooden ship, the Fram. Their goal was to freeze the specially-designed ship into sea ice and drift along with the ice to the North Pole (sound familiar?). Although they never did reach the North Pole, the 3-year Fram expedition contributed to new and exciting discoveries in oceanography and Arctic geography.
After the 1893-1896 Arctic expedition, the Fram would go on to do two more polar expeditions: a Canadian Arctic islands expedition led by Otto Sverdrup in 1898, and the first expedition to reach the South Pole in 1910, led by Roald Amundsen. Today, the Fram ship is preserved in the Fram Museum in Norway, but you can visit it virtually and learn more about the expedition in this 360-degree immersive Google Expedition (above)!
How to Use this Virtual Expedition
Click and drag to move around the current scene or click the arrows at the bottom to check out other scenes. Within each scene you'll see white circles with a picture symbol inside. Click on these to learn more about various aspects of the expedition. This expedition is also available as a virtual reality experience using Google Cardboard glasses (or similar virtual reality viewers) and the Google Expeditions app. Download the app on your smartphone and search for "Explore the Arctic Aboard the Fram." Students can view the Expedition on their own or be teacher-guided. Instructions on how to facilitate a teacher-guided Google Expedition can be found here.
We'd like to thank the Fram museum and photographer/videographer extraordinaire Amy Richman for the 360-degree images that you can explore in this Google Expedition.
Learn more about the Fram museum
Download the Google Expeditions app
Tour the Polarstern in 360 degrees!
 Fram Expedition Scavenger Hunt
Your students can freely explore the Fram virtual expedition on their own, or you can challenge them to complete a scavenger hunt! Create your own, or use one that we've created for you. Photo credit: National Library of Norway
Explore the Arctic Aboard the Fram virtual scavenger hunt
![]()
![]()
 Attention Teachers: Pilot Arctic Curriculum in Your Classroom!
The education and outreach team for the MOSAiC Arctic research expedition is developing several units for middle and high school classrooms centered on the expedition and Arctic climate science. Units will be connected to the Next Generation Science Standards and will cover topics like the nature of science and scientific discovery, oceanography, Arctic marine ecosystems, climatology, and more. We are looking for middle and high school teachers willing to either review or pilot-test the units in their classroom. Teachers who pilot the units and provide feedback will receive up to $50 in Amazon gift cards. Interested teachers should fill out this short (<5 minutes) survey. Teachers can preview one of the units to be piloted here, which includes the virtual Fram expedition above.
Interested in piloting or reviewing curriculum? Fill out this survey!
 Quick Bite: Arctic Temperature Comparisons
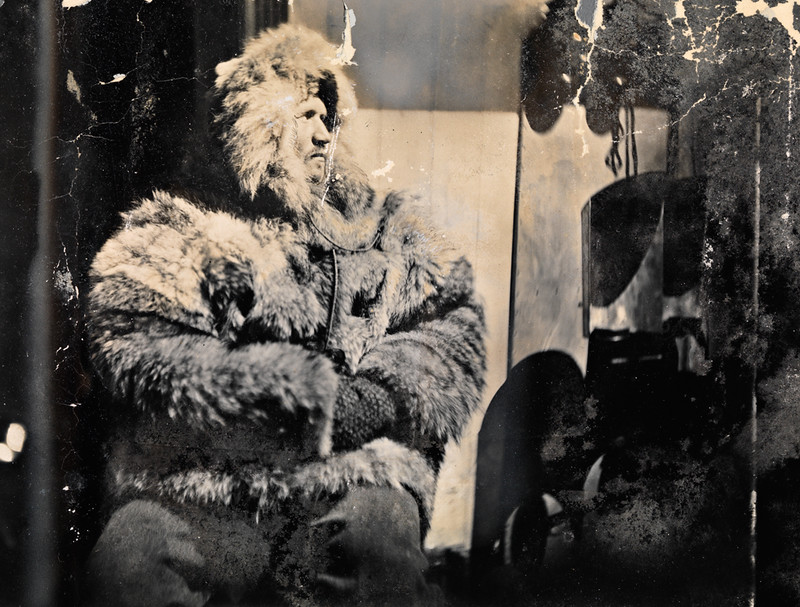
The 1893 Fram expedition crew members collected a variety of oceanographic and meteorological data over the course of the three years they drifted across the Arctic frozen in ice. Below is a table showing the average monthly temperatures at the location of the Fram in the Arctic between 1893-1896. Compare these numbers to the average monthly temperatures in the MOSAiC Data Log below under MOSAiC Weekly Tracking (you'll need to do some calculations). Keep in mind that the numbers in the MOSAiC Data Log represent snapshots in time and not the full range of temperatures experienced at the Polarstern so far over the course of the MOSAiC expedition. Photo (Courtesy of the National Library of Norway): Frederik Hjalmar Johansen, officer, meteorological assistant, and firefighter aboard the Fram.
| Month | Average Temperature (deg C) |
|---|---|
| October | -21.44 |
| November | -28.72 |
| December | -32.23 |
| January | -35.59 |
| February | -35.83 |
| March | -30.33 |
| April | -22.78 |
| May | -11.02 |
| June | -1.83 |
| July | 0.05 |
| August | -1.76 |
| September | -8.99 |
Note: This and other Fram expedition datasets can be found in the various volumes of The Norwegian North Polar Expedition, 1893-1896; Scientific Results by Fridtjof Nansen or on the National Snow and Ice Data Center's website.
1. How do the average monthly temperatures from the Fram expedition compare to the average monthly temperatures from the MOSAiC expedition so far?
2. How do the locations of the Fram and Polarstern compare at various months? You can find this information on the MOSAiC web app by clicking on this symbol in the bottom left corner of the map: ![]()
![]()
![]()
![]()
![]()
 #askmosaic: Staying Safe and Healthy in the Arctic
This week's question was submitted by Alan from Seneca Falls Middle School: Has anyone been hurt or needed medical attention?
"It can be very slippery on snow covered decks. A colleague slipped on icy steps and broke his leg. Out on the sea ice the biggest danger is falling through thin, snow covered ice into the water. We have to wear a flotation suit to make sure we don’t sink. No one has fallen all the way in yet, but some people have gotten wet feet.”
-Ian Brooks, Professor of Boundary Layer Processes at the University of Leeds and member of MOSAIC Team Atmosphere. Ian just returned from Leg I of the MOSAiC expedition.
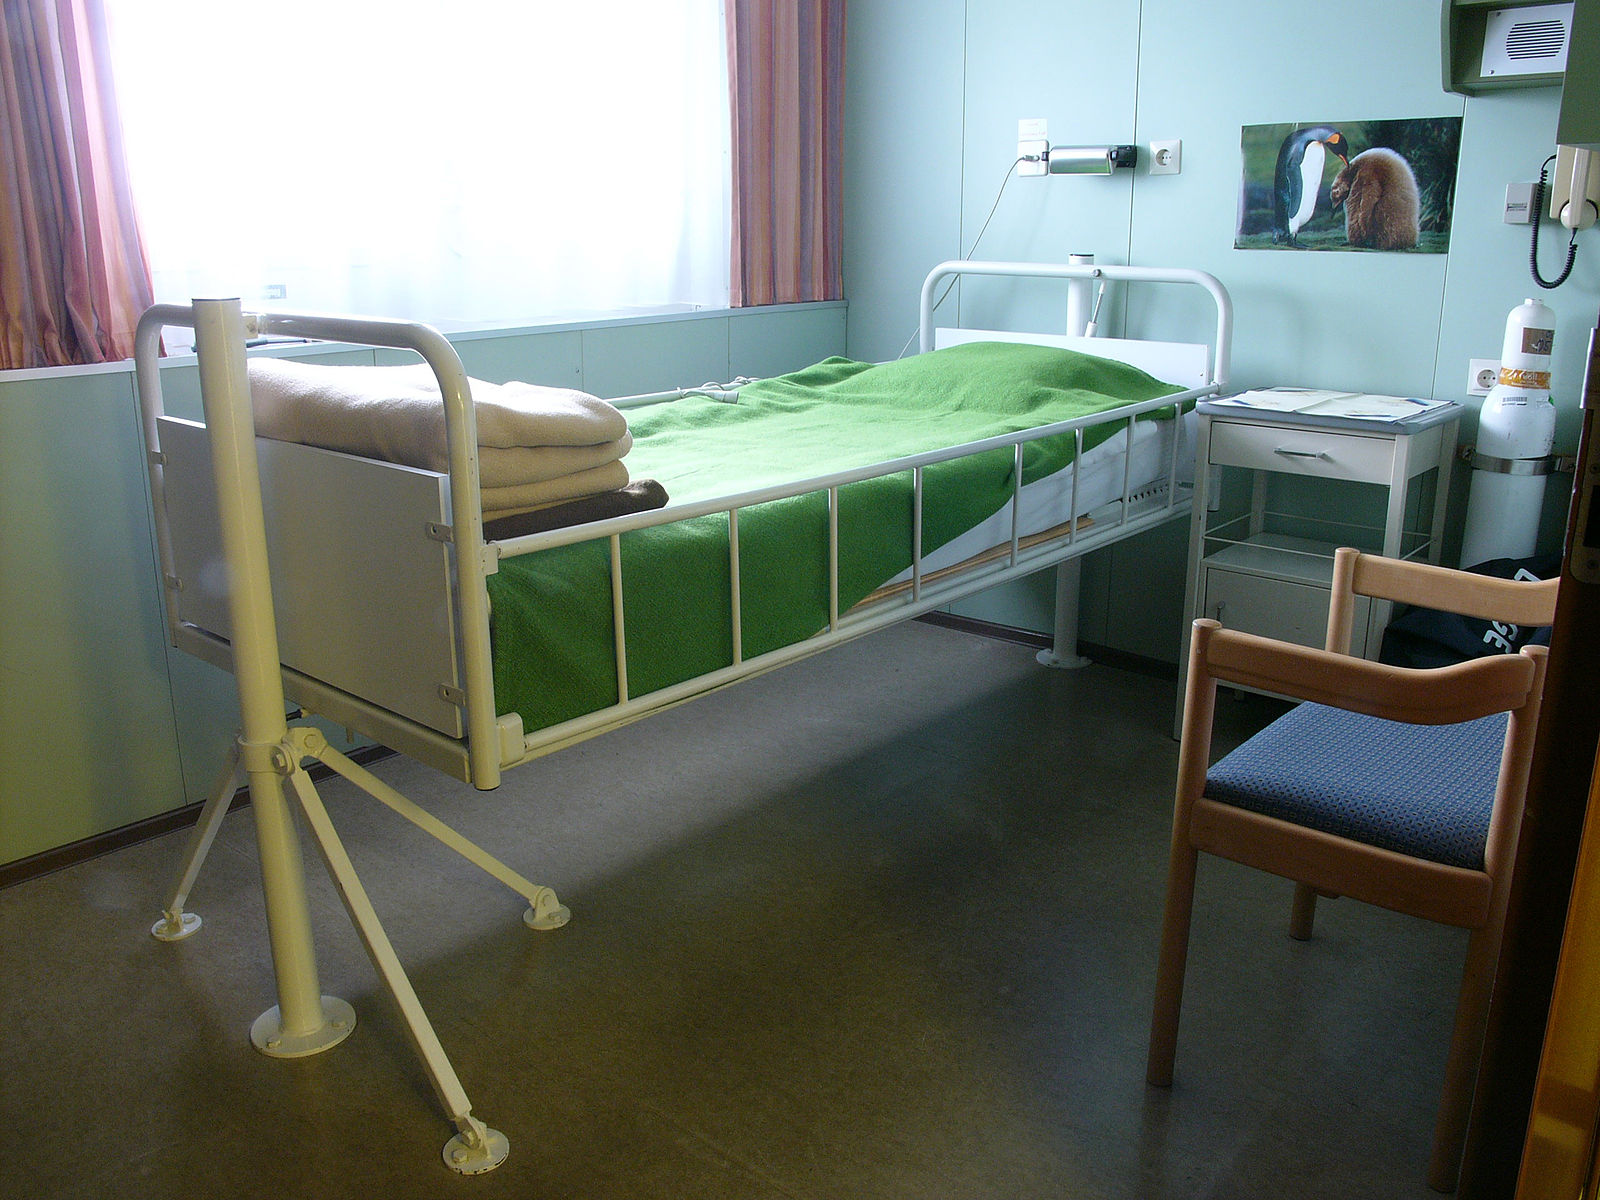
Photo: The Polarstern has a hospital and doctor on board for anyone who might need medical attention. Photo credit: Hannes Grobe, AWI
Submit your questions to #askmosaic!
MOSAiC Weekly Tracking
Plot the Polarstern
Each week we will provide you with the latitude and longitude coordinates of the Polarstern so that your students can track its journey across the Arctic in your classroom.
Download the map to plot coordinates
Download a larger map of the Arctic for a bigger picture view of the expedition area
Location of the Polarstern
| Date | Latitude | Longitude |
| September 16, 2019 | 69.68 N | 18.99 E |
| September 23, 2019 | 72.31 N | 26.93 E |
| September 30, 2019 | 85.12 N | 138.05 E |
| October 4, 2019** | 85.08 N | 134.43 E |
| October 7, 2019 | 85.10 N | 133.82 E |
| October 14, 2019 | 84.85 N | 135.03 E |
| October 21, 2019 | 84.97 N | 132.73 E |
| October 28, 2019 | 85.47 N | 127.07 E |
| November 4, 2019 | 85.88 N | 121.70 E |
| November 11, 2019 | 85.82 N | 116.00 E |
| November 18, 2019 | 86.05 N | 122.43 E |
| November 25, 2019 | 85.85 N | 121.35 E |
| December 2, 2019 | 85.97 N | 112.95 E |
| December 9, 2019 | 86.25 N | 121.40 E |
| December 16, 2019 | 86.62 N | 118.12 E |
| December 23, 2019 | 86.63 N | 113.20 E |
| December 30, 2019 | 86.58 N | 117.13 E |
| January 6, 2020 | 87.10 N | 115.10 N |
**Day when MOSAiC reached the ice floe that the Polarstern will become frozen in and drift with for the next year.
Log MOSAiC Data
Download a MOSAiC Data Logbook to keep track of Arctic conditions over the course of the expedition
**The Data Logbook has been updated for 2020!
| Date | Length of day (hrs) | Air temperature (deg C) at location of Polarstern | Arctic Sea Ice Extent (million km2) |
| September 16, 2019 | 13.25 | High: 10 Low: 4.4 | 3.9 |
| September 23, 2019 | 12.35 | High: 6 Low: -1 | 4.1 |
| September 30, 2019 | 9.1 | -4.7 | 4.4 |
| October 4, 2019** | 6.27 | -13.0 | 4.5 |
| October 7, 2019 | 3.05 | -8.2 | 4.6 |
| October 14, 2019 | 0 | -14.7 | 4.8 |
| October 21, 2019 | 0 | -12.8 | 5.4 |
| October 28, 2019 | 0 | -18.3 | 6.8 |
| November 4, 2019 | 0 | -18.9 | 8.0 |
| November 11, 2019 | 0 | -25.5 | 8.7 |
| November 18, 2019 | 0 | -10.7 | 9.3 |
| November 25, 2019 | 0 | -18.4 | 10.0 |
| December 2, 2019 | 0 | -26.6 | 10.4 |
| December 9, 2019 | 0 | -23.1 | 11.2 |
| December 16, 2019 | 0 | -19.2 | 11.8 |
| December 23, 2019 | 0 | -26.9 | 12.2 |
| December 30, 2019 | 0 | -26.4 | 12.6 |
| January 6, 2020 | 0 | -28.0 | 13.0 |
*Note: We expect data to fall within the following ranges: Length of day, 0-24 hours; Temperature, -40 to 14 degrees C; Sea ice extent, 3-15 million km2
**Day when MOSAiC reached the ice floe that the Polarstern will become frozen in and drift with for the next year.
 MOSAiC Monday and the NGSS
What do those funny symbols below some engagements mean?
Good news for educators in the U.S. teaching with the Next Generation Science Standards (NGSS) or similar! We will now be tagging MOSAiC Monday engagements with the NGSS Disciplinary Core Idea subject(s), Science and Engineering Practice(s), and Crosscutting Concept(s) that they most closely connect to. Look for these symbols listed below each engagement:
Disciplinary Core Idea Subjects
Science and Engineering Practices (adopted from the San Diego County Office of Education Science Resource Center)
Crosscutting Concepts (adopted from the San Diego County Office of Education Science Resource Center)
Is there something you'd like to see in MOSAiC Monday? Let us know!
Send us your feedback
New to MOSAiC Monday? Check out past editions!
Browse more expedition-related educational resources, videos, and blogs