Check out these upcoming events!
 Tune in weekly from now through December for the CIRES/NOAA Science at Home Webinar Series!
Join us every Tuesday at 1:00 pm from now through December for the CIRES/NOAA Science at Home webinar series! Each webinar features a 10-15 minute presentation by a scientist about how they got into science and what they do as a scientist, followed by 10-15 minutes of live Q&A.
Next Up:
September 29th – PhD Candidate Mel Zhang will present on: Seismology: What it is and how I got into it
See the full speaker line-up on the Science at Home website
Register to receive weekly Science at Home email reminders
 Connect with MOSAiC scientists with Reach the World
Join us as we partner again this fall with our friends at Reach the World and Exploring by the Seat of Your Pants to help you connect your students virtually to MOSAiC team members and crew!
Next featured MOSAiC team member: Dr. Matthew Shupe
Dr. Matthew Shupe is a research scientist who studies cloud and atmospheric processes at the Cooperative Institute for Research in Environmental Sciences and the NOAA Earth System Research Laboratories. Matthew is also the co-leader of the MOSAiC expedition. As the Polarstern makes her way back to port marking the end of the expedition, Matthew will reflect back on his experience in the Arctic and the importance of this yearlong endeavor. Check out the Reach the World MOSAiC program page to read Matthew's upcoming article and mark your calendar with Matthew's live video chat on October 1st at 1:00 pm ET (11 am MT) hosted by Exploring by the Seat of Your Pants.
Learn more about Matthew Shupe's live video call on October 1st
Go to the Reach the World MOSAiC program page
 MOSAiC Weekly Webinar Series for Educators
Teachers, join us every Wednesday (3:30 - 4:00 pm MT) during the month of September for short (30 minute) webinars to learn more about MOSAiC virtual educational resources and how you can integrate them into your teaching. Register for each webinar by clicking on the events below. Please contact jonathan.griffith@
Events:
Week 5 (9/30, 3:30-4:00 pm MT): “Arctic Feedbacks” curriculum (MS/HS unit)
The Journey Home
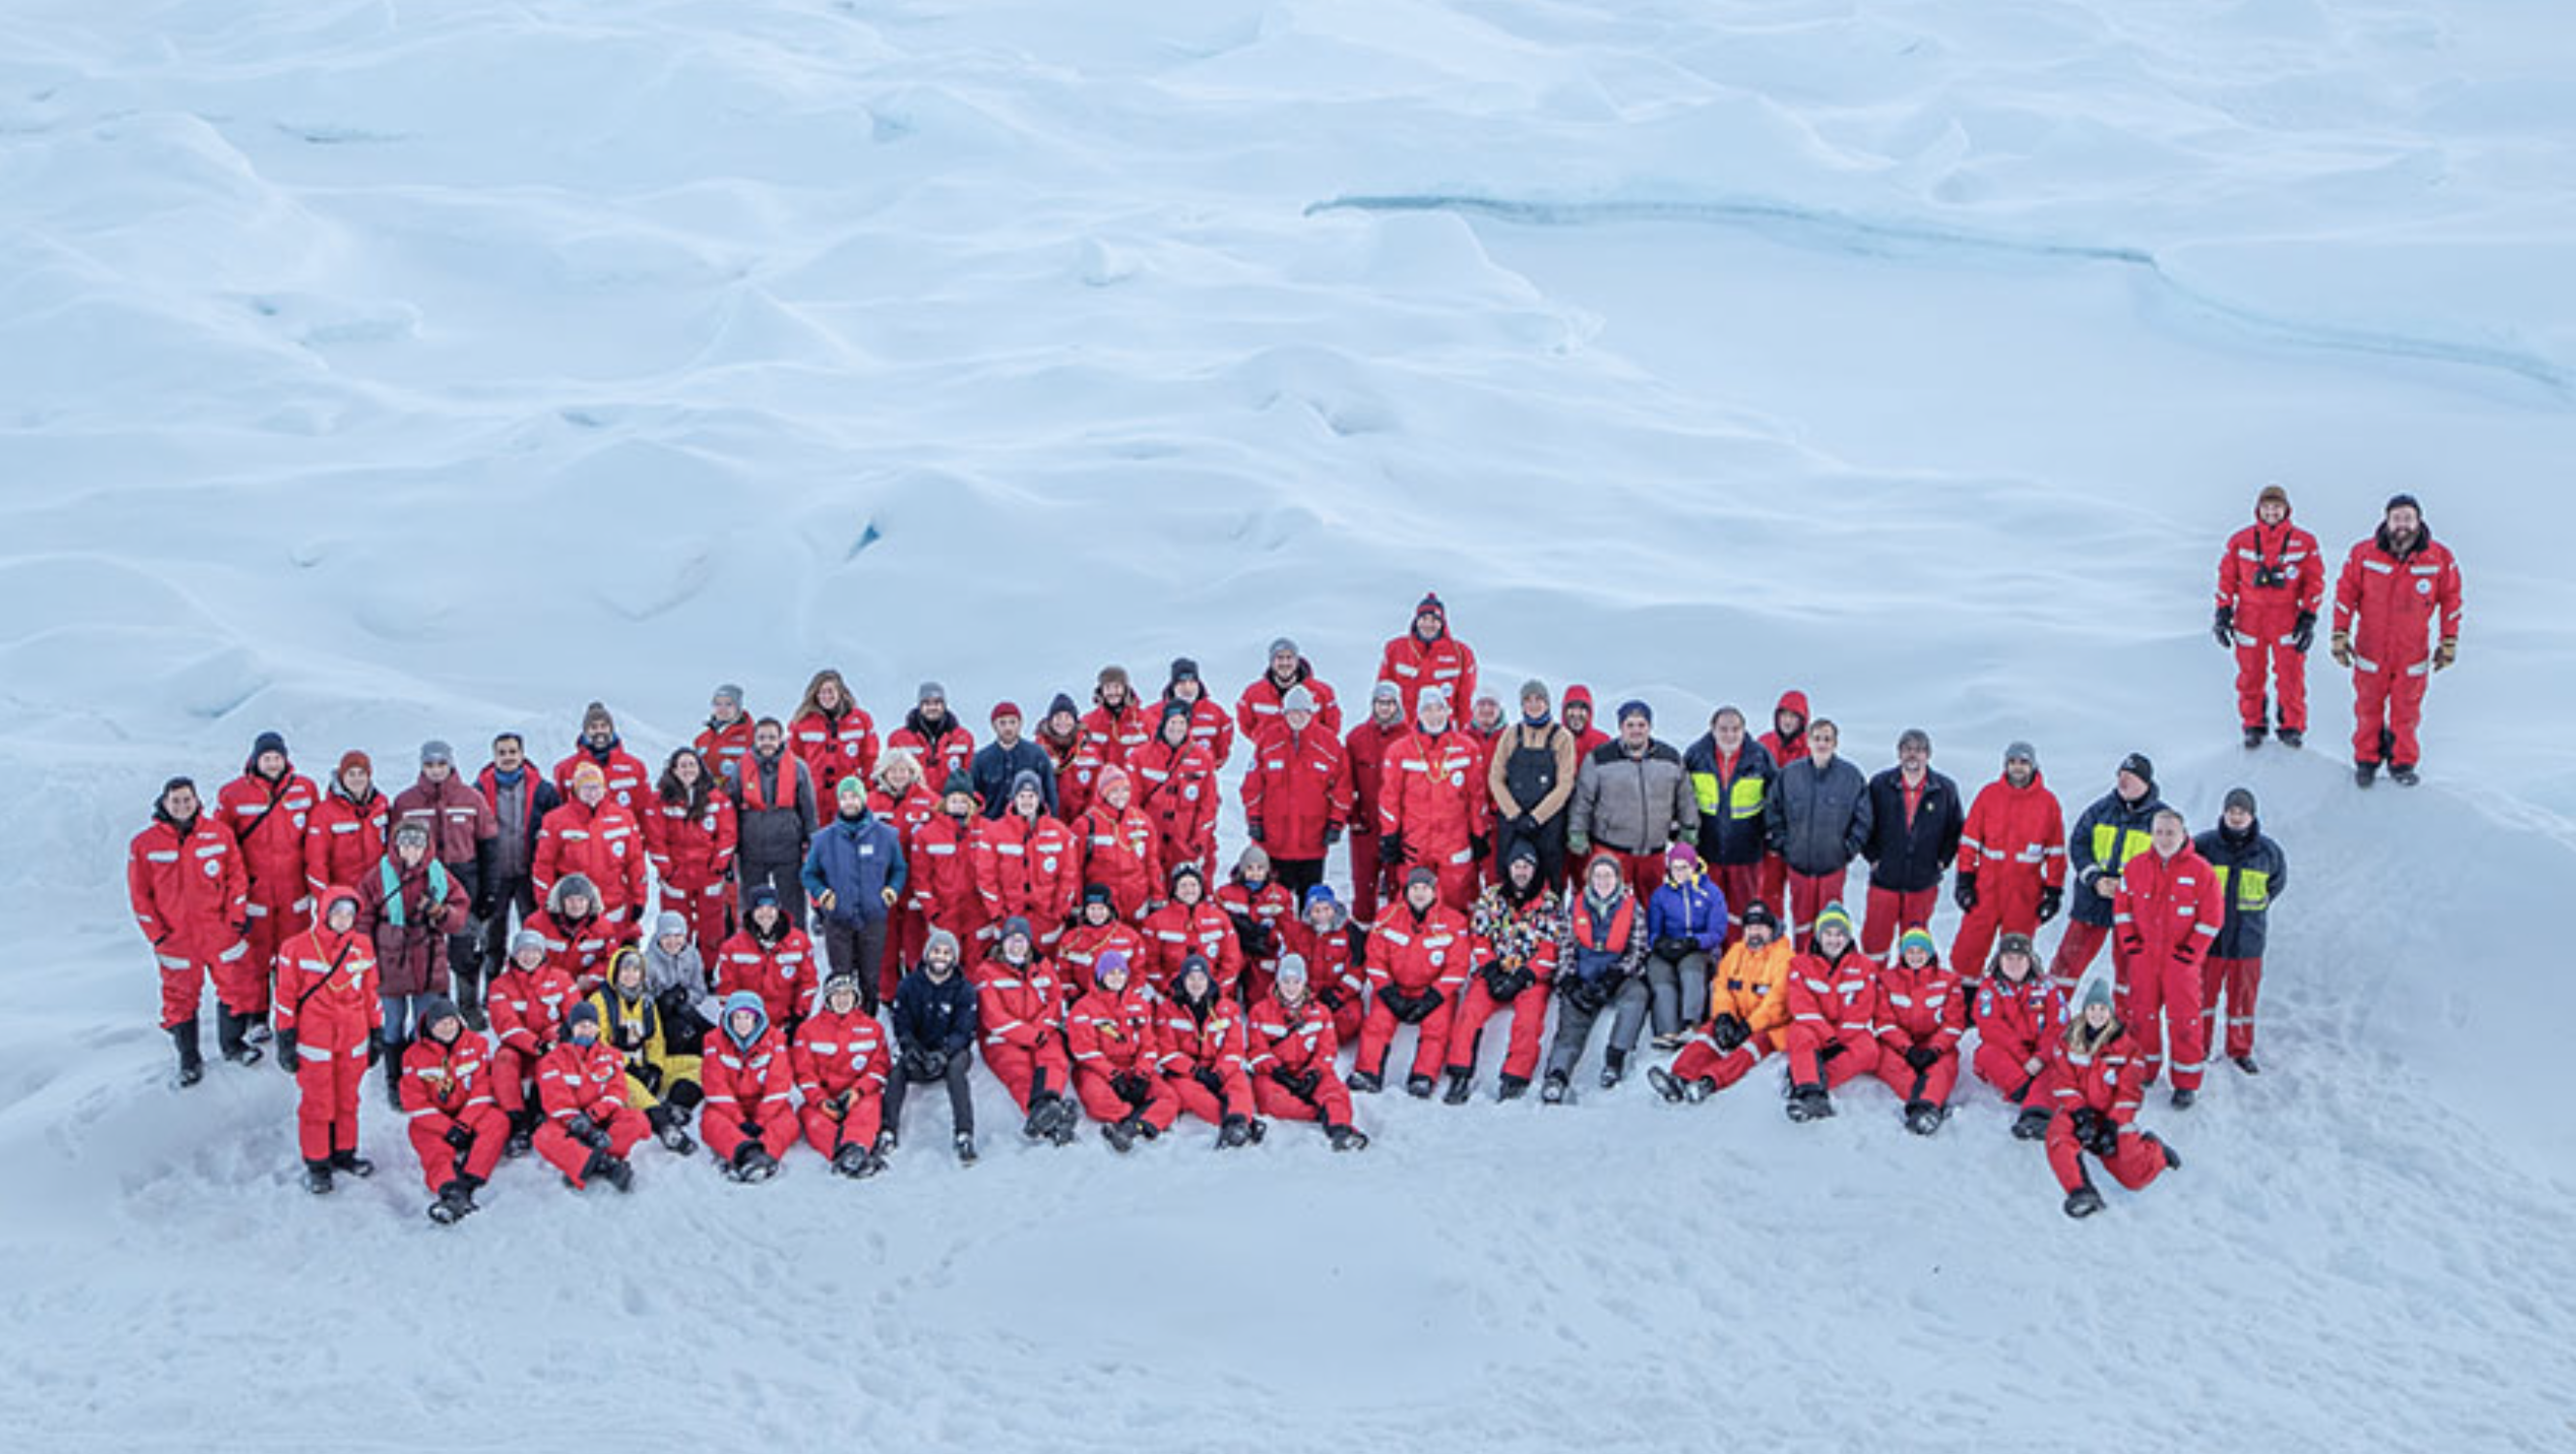
As the sun begins to set again in the Arctic marking the end of the Arctic summer and endless daylight, the Polarstern is making its way south under its own engine power. On the 1-year anniversary of MOSAiC exactly, the scientists and crew finished packing up all of their equipment, had one last celebration on the floe, and began the journey back home.
"In one sense it seems like only yesterday we were in Tromsø preparing the ship for departure, and in another sense it seems like a very long time ago indeed."
-Byron Blomquist, CIRES/NOAA
Photo: Leg 5 group photo; Photo credit: Lianna Nixon, CIRES/CU Boulder
What and Where is the Arctic?
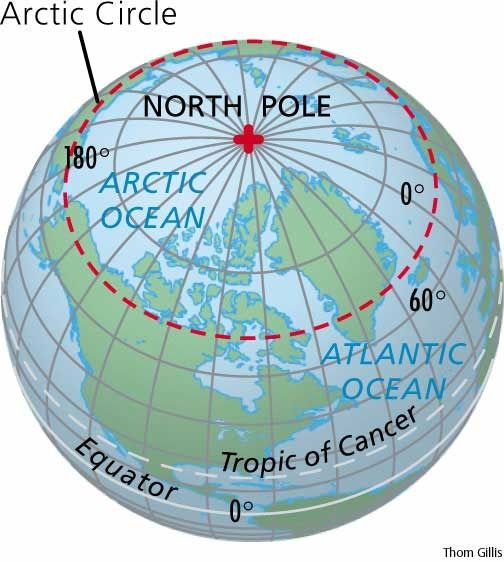
Did you know that there isn't one specific way in which we define the Arctic region geographically? It turns out there are at least 6 different ways you could draw boundaries on the Arctic, depending on which parameters you use to define it. We often think about the Arctic Circle as defining the Arctic region. The Arctic Circle is the imaginary line of latitude that circles the globe at about 66° 34' N. More significantly, it marks the latitude above which the sun can remain above or below the horizon for 24 hours a day at some duration throughout the year. At the Arctic Circle, 24 hours of daylight and darkness both happen one day each year, and at the North Pole they each happen for 6 months of the year!
 Quick Bite: Defining the Arctic
Provide your students with a map of Definitions of the Arctic from Nordregio. Then, do a ~10-minute Think-Pair-Share in which students analyze the various definitions of the Arctic and discuss how they all compare. Why do you think there is no one way in which we define the Arctic?
Download the Definitions of the Arctic map
 Extension: Arctic Geography and Geopolitics
Refer to this Defining the Arctic slide deck to facilitate the following:
Step 1: Students record three definitions (10°C July isotherm, treeline, and Arctic Circle) for the Arctic on these Arctic Map worksheets.
Step 2: Students label the eight countries surrounding the Arctic Ocean (see example)
Discussion Prompts:
What country do you think has the greatest influence over the Arctic region? Why?
Who owns the rights to the land/resources at the bottom of the Arctic Ocean?
To learn more about the geography and geopolitics of the Arctic, check out our Introduction to the Arctic lesson. This lesson can be facilitated alone or as part of the larger Exploring the New and Old Arctic curriculum.


This Week's Featured Media
 MOSAiC 360-Degree Videos
Are you curious what it is like for MOSAiC scientists working in the Arctic? You can feel like you are standing right next to them in these immersive 360-degree videos created from footage collected during the expedition. Watch a helicopter land near a research camp, help a scientist repair a meteorological tower, or join a soccer game on the sea ice!
Check out the 360-degree videos and other MOSAiC VR experiences
Browse photos, videos, podcasts, and more in the MOSAiC Media Library
 Learn About Contemporary Native Life in Alaska: Coffee and Quaq
Coffee and Quaq is a podcast created and hosted by Alice Qannik Glenn, a young Alaska Native Iñupiaq. In this podcast, Alice discusses a variety of topics related to Native life in Anchorage, Alaska's biggest village.
 Send Us Your Arctic Artwork!
Do you have a favorite moment from the MOSAiC expedition? Sketch it, sculpt it, or write a poem about it and submit your creative work to be showcased in the Museum of MOSAiC Art!
Virtually browse the MoMOA galleries
 #askmosaic: Out of Reach
This week's question was submitted by Steve from Costa Mesa, California: What are the challenges with collecting data in the oceans vs. the atmosphere?
"Hmm. This is a deep question (pun intended?). The challenges depend on the kind of data or sample you want to collect. On a ship, or out on the sea ice, we are at the surface of the ocean - the interface between the ocean and atmosphere - so most of our studies focus on this thin interface. This would be, for example, the top 20 meters of the ocean and the lowest 20 meters of the atmosphere. Making measurements near the surface takes a lot of work, but we can do it. And the challenges of dealing with the weather and with cold fingers are about the same for atmosphere and ocean.
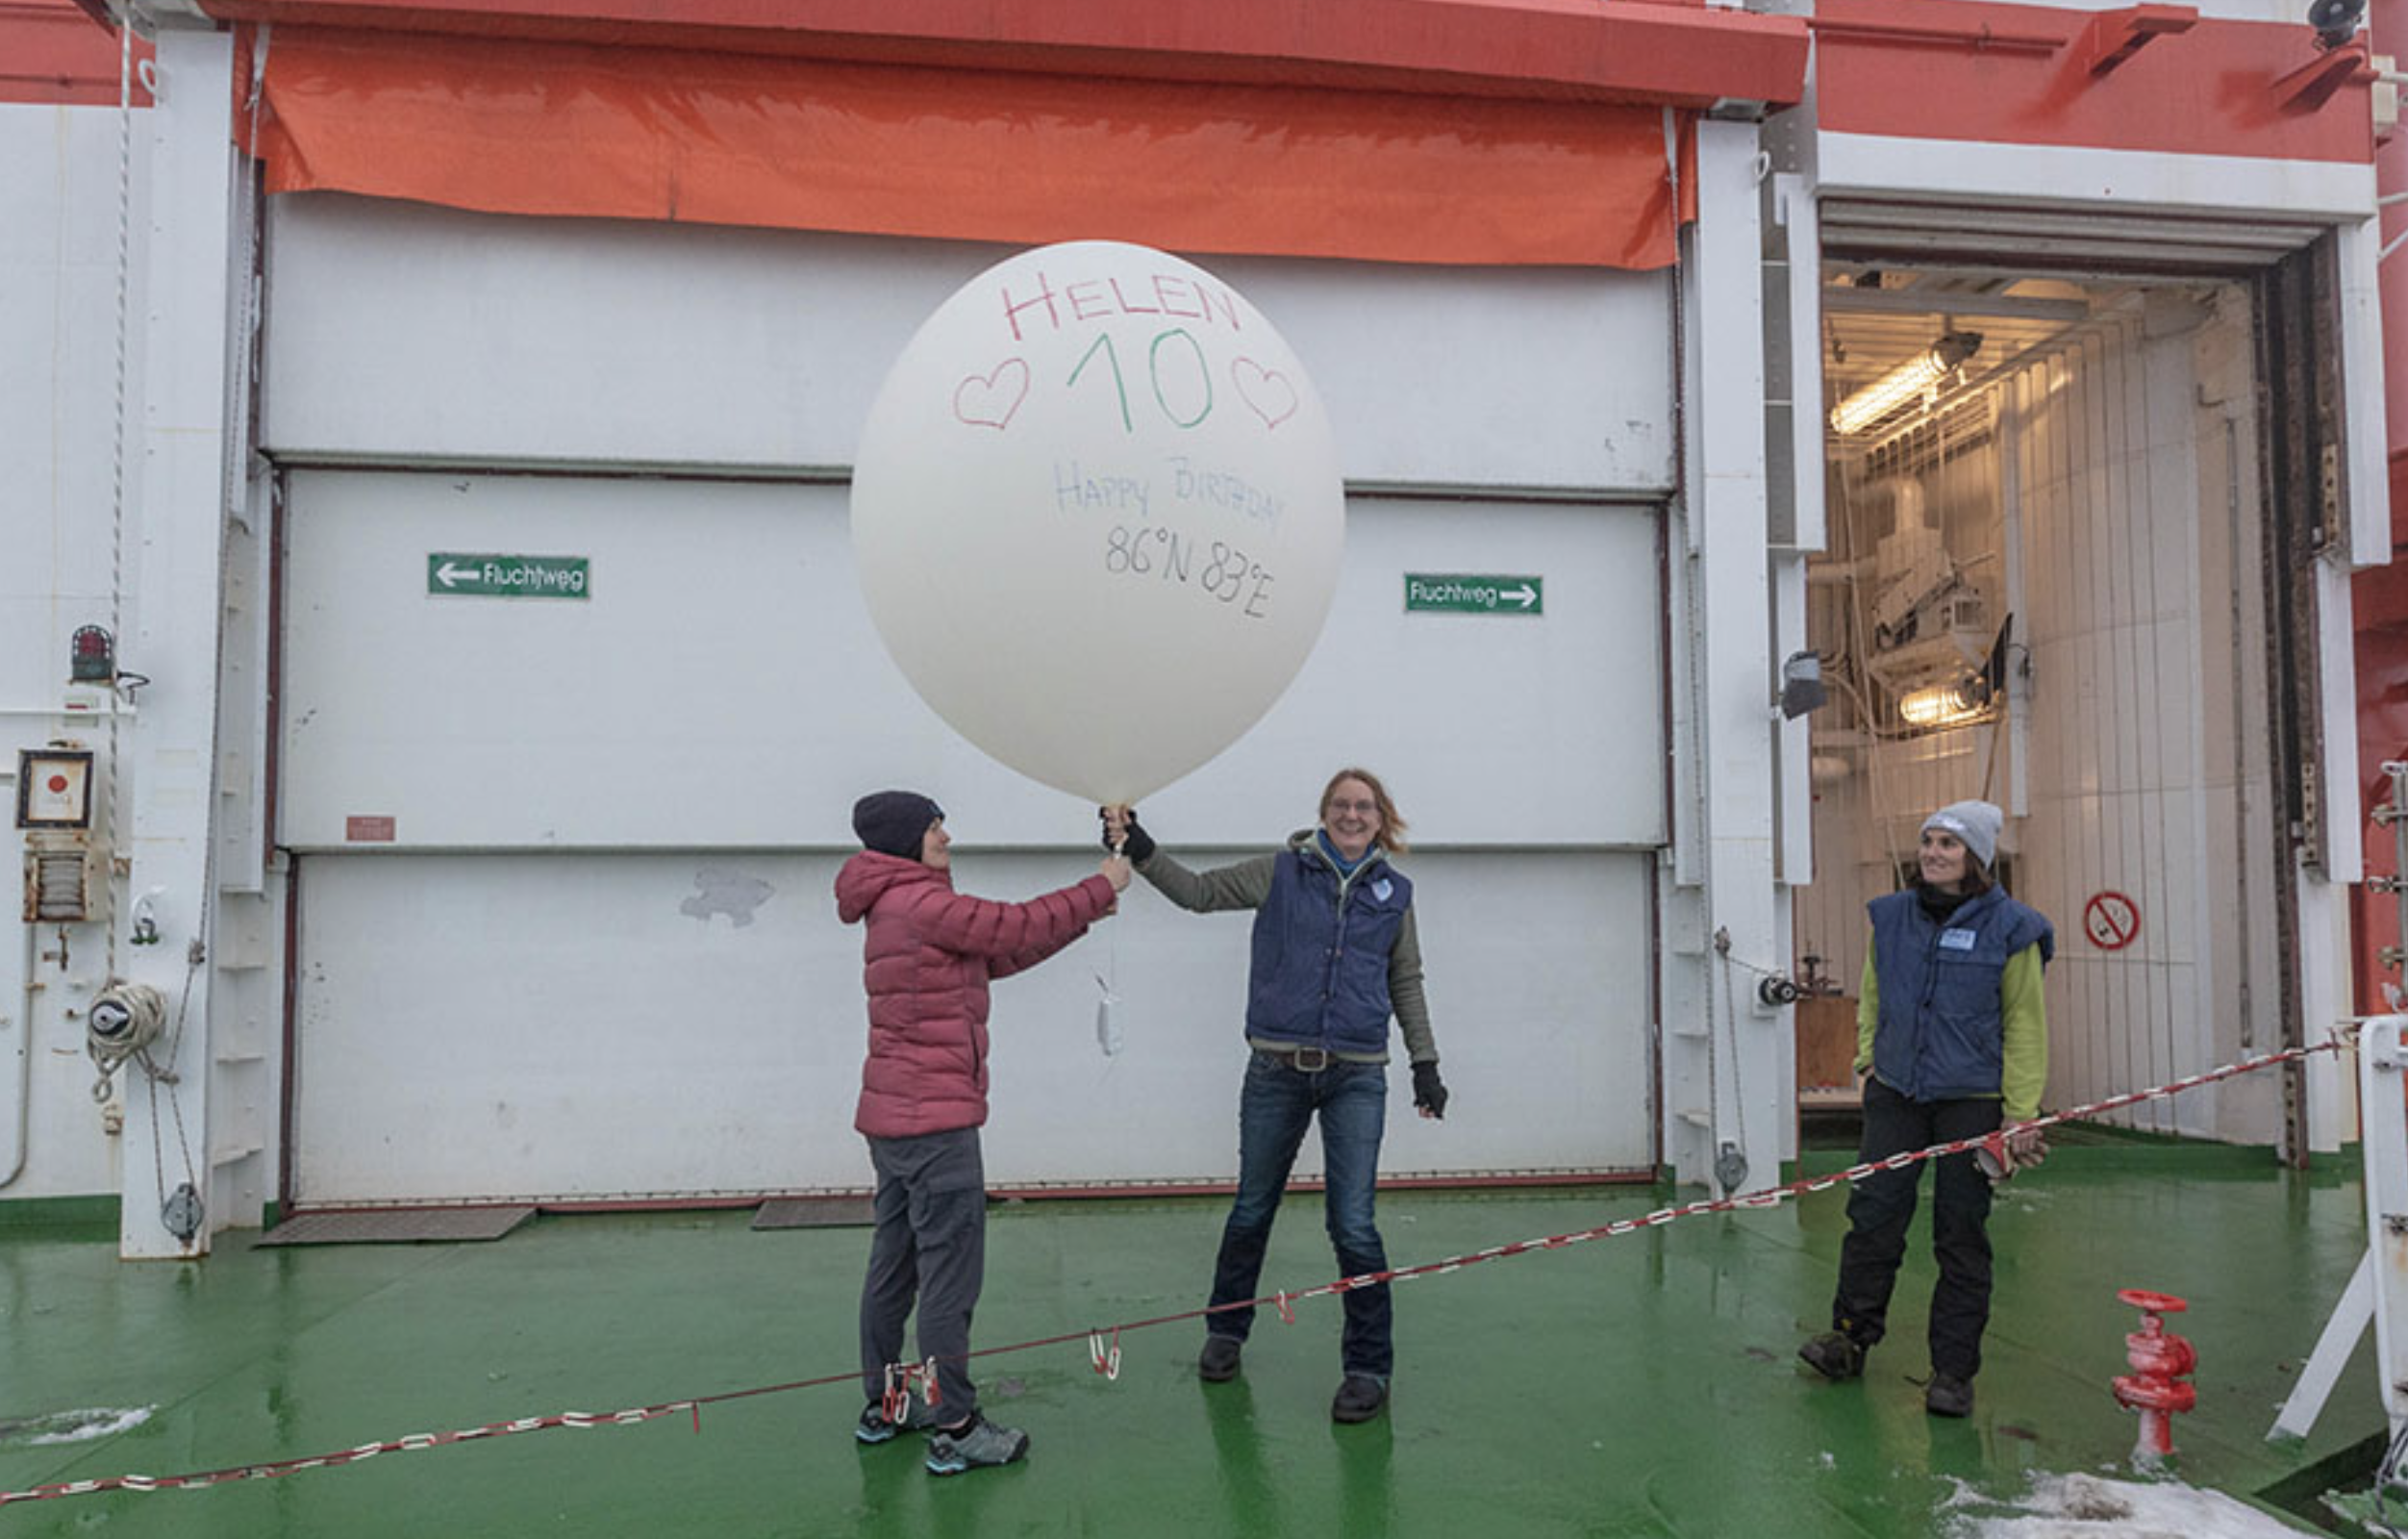
If you want samples from high in the atmosphere or deep in the ocean it takes special equipment. For example, we launch weather balloons every 6 hours to measure temperature, humidity and winds in the upper atmosphere. The balloons are fairly easy to launch. But, in general, we can't directly measure or collect air samples high in the atmosphere without an airplane, which unfortunately we don't have for MOSAiC.
Photo: MOSAiC scientists prepare to launch a weather balloon that will ascend ~35 km up into the atmosphere and send back information about the atmospheric temperature, wind speed, humidity, and more. Photo credit: Lianna Nixon, CIRES/CU Boulder
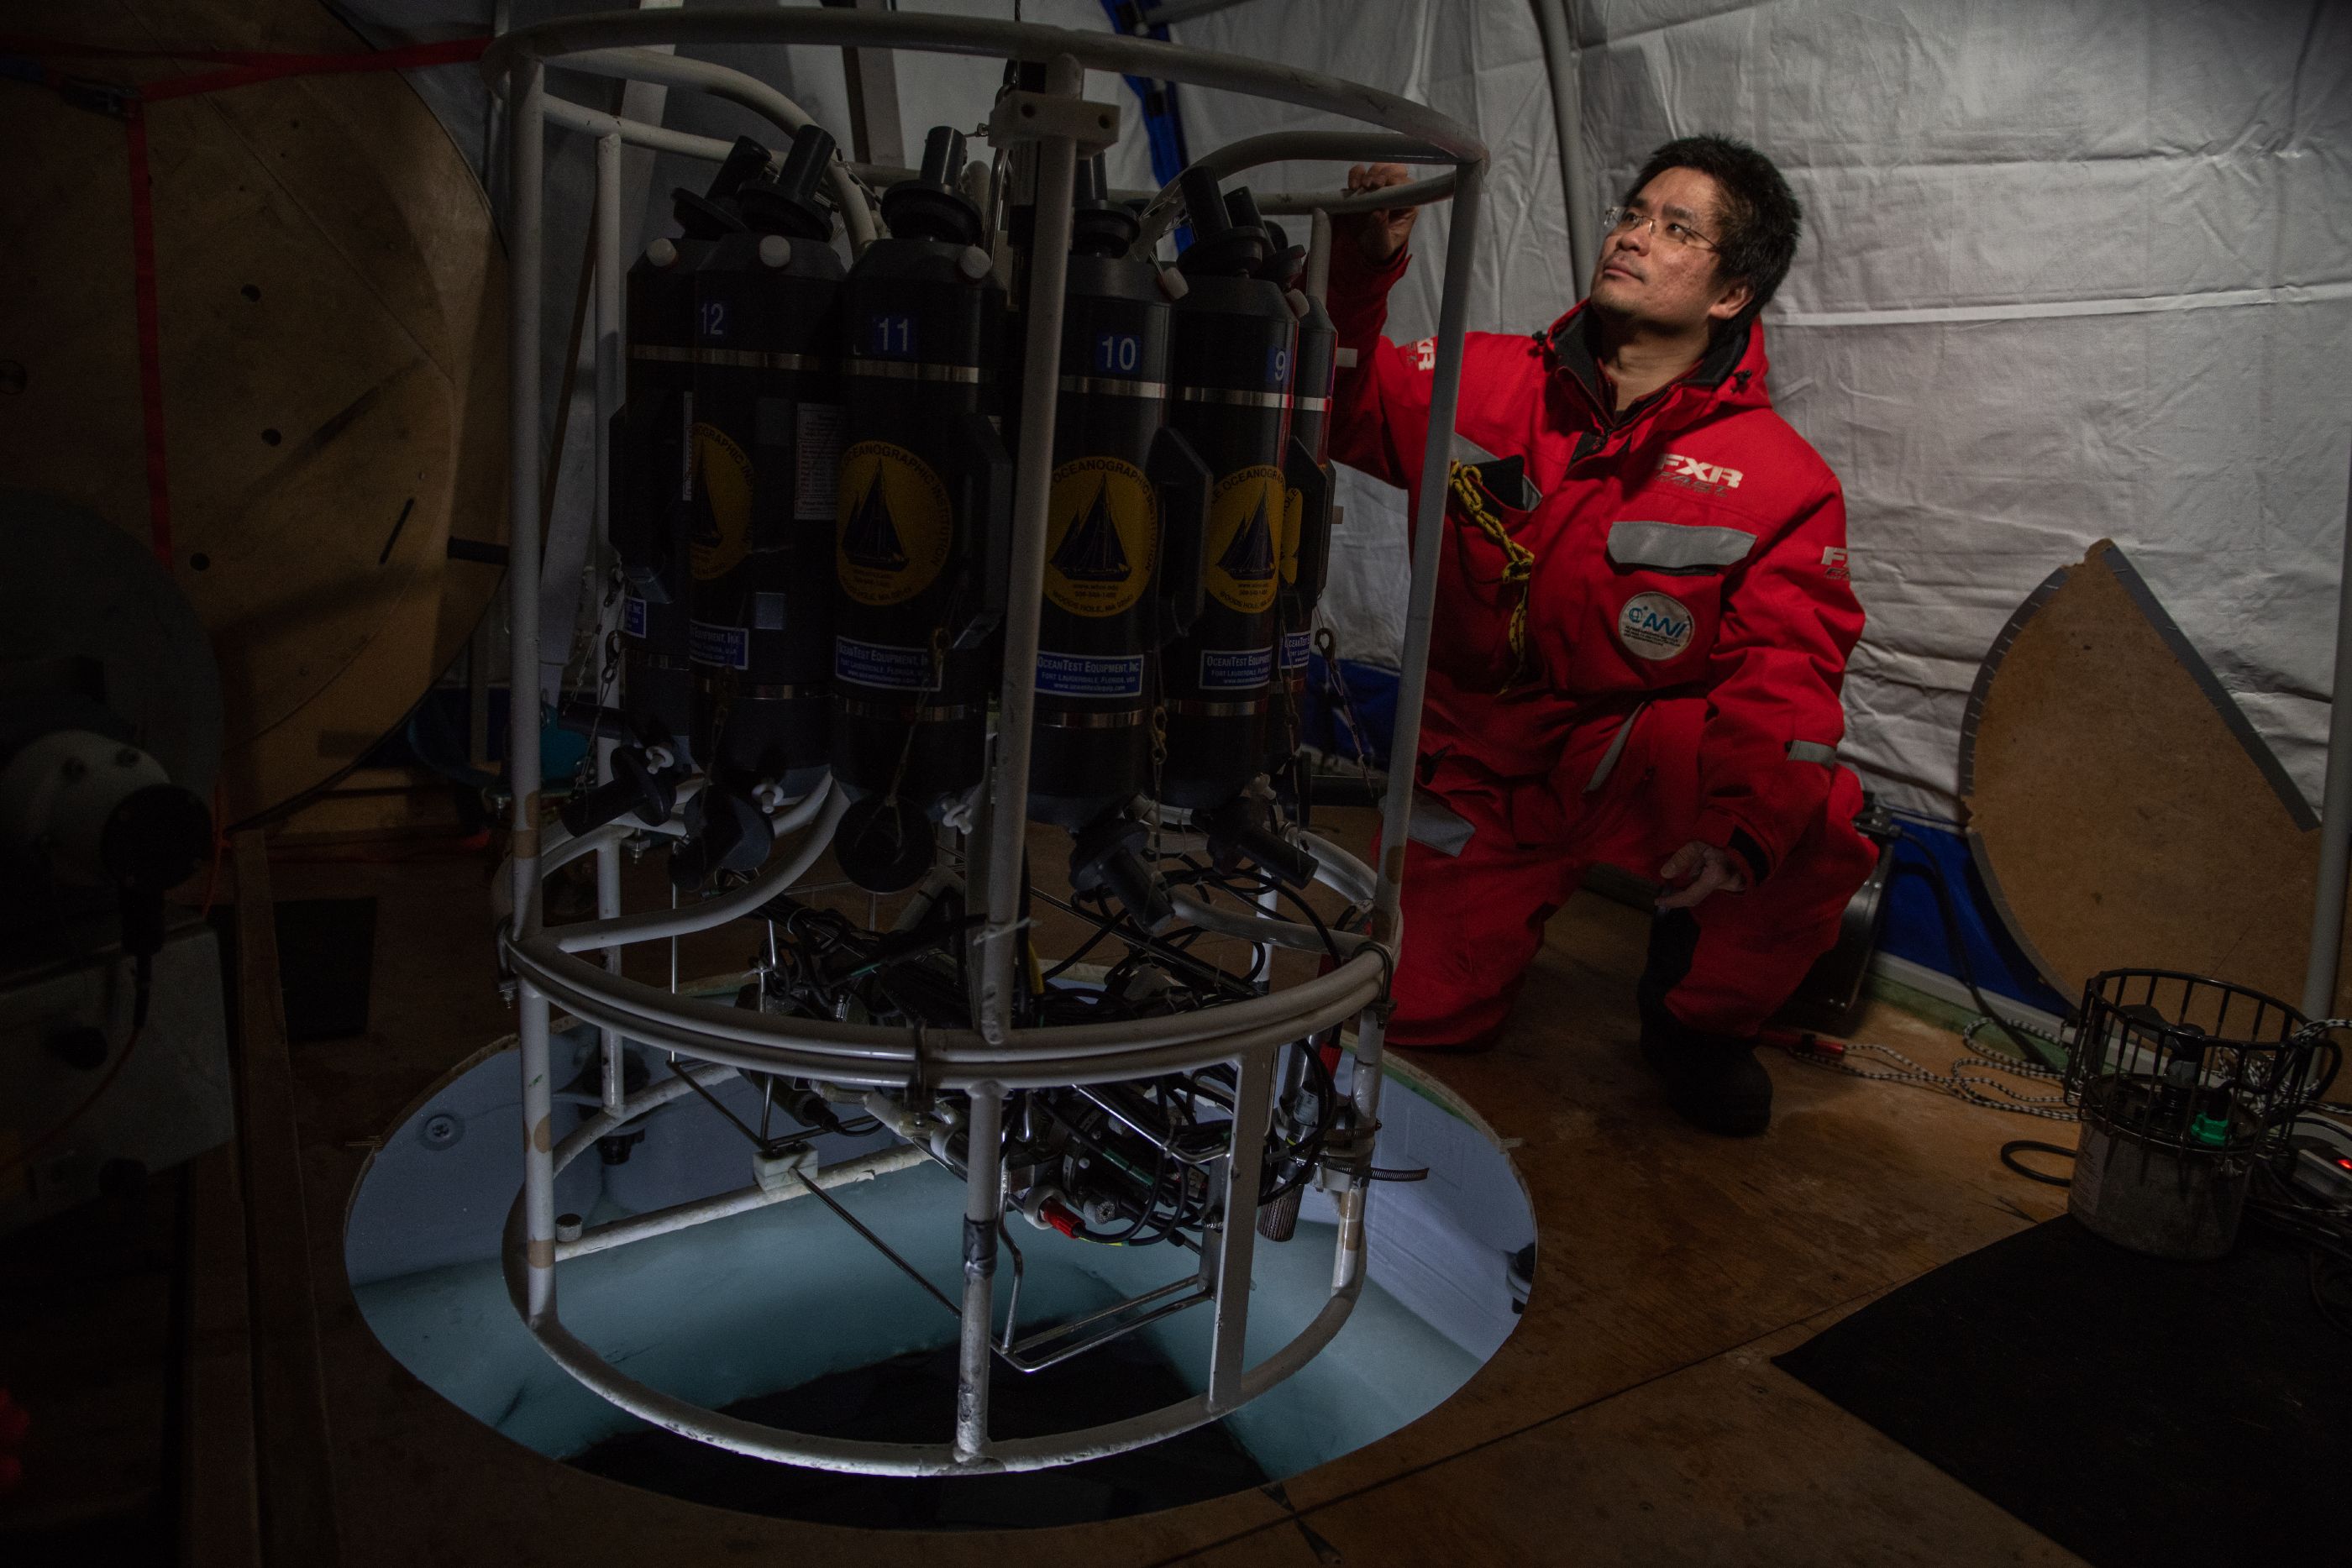
The oceanographers use a water sampling system on a cable (the CTD rosette) to make measurements and collect water samples over the entire depth of the ocean. One CTD cast can take several hours and may involve 6-8 people to run the CTD and process all the samples. So, the CTD takes much more work, but you get a lot of information from all the water samples. So, when it comes to direct sampling I'd say the oceanographers have a better situation. And the oceanographers have made great progress in recent years with autonomous gliders and buoys to extend their observational capabilities.
Photo: MOSAiC scientist Ying Chih-Fang checks the CTD before lowering it down through the ice; Photo credit: Esther Horvath/AWI
Remote sensing systems collect the greatest amount of data over the height of the atmosphere and depth of the ocean because they run continuously and don't generally require much attention from people. These are things like weather RADAR and LIDAR systems for the atmosphere, or acoustic SONAR systems in the ocean. The RADAR/LIDAR systems allow us to measure wind speeds, cloud properties and small particles (aerosols) up to several kilometers above the surface. On the ocean side, the acoustic instruments measure currents to several hundred meters below the ship and can reveal the presence of fish or other particles in the water column. The atmosphere is transparent to a wide spectrum of visible light and microwaves, so the variety of remote sensing systems on the air side is much greater than for the ocean, where they can only use sound pulses. And for the atmosphere we also have satellites looking down from space measuring a very wide variety of atmospheric and surface properties over the entire earth. So, I'd say the atmosphere team has a better situation when it comes to collecting data by remote sensing."
-Byron Blomquist, CIRES/NOAA, member of MOSAiC teams ATMOS, BGC, ECO
Read more in Byron's blogs from the Polarstern
Curious about the Arctic and MOSAiC expedition? Here are three ways you can send us your #askmosaic questions:
1. Submit them
2. Email them: mosaic@colorado.edu with subject line "#askmosaic"
3. Tag us on social media: #askmosaic
 MOSAiC Weekly Tracking
Plot the Polarstern
Each week we will provide you with the latitude and longitude coordinates of the Polarstern so that you can track its journey across the Arctic.
Download the map to plot coordinates
Download a larger map of the Arctic for a bigger picture view of the expedition area
Location of the Polarstern
| Date | Latitude | Longitude |
| September 16, 2019 | 69.68 N | 18.99 E |
| September 23, 2019 | 72.31 N | 26.93 E |
| September 30, 2019 | 85.12 N | 138.05 E |
| October 4, 2019** | 85.08 N | 134.43 E |
| October 7, 2019 | 85.10 N | 133.82 E |
| October 14, 2019 | 84.85 N | 135.03 E |
| October 21, 2019 | 84.97 N | 132.73 E |
| October 28, 2019 | 85.47 N | 127.07 E |
| November 4, 2019 | 85.88 N | 121.70 E |
| November 11, 2019 | 85.82 N | 116.00 E |
| November 18, 2019 | 86.05 N | 122.43 E |
| November 25, 2019 | 85.85 N | 121.35 E |
| December 2, 2019 | 85.97 N | 112.95 E |
| December 9, 2019 | 86.25 N | 121.40 E |
| December 16, 2019 | 86.62 N | 118.12 E |
| December 23, 2019 | 86.63 N | 113.20 E |
| December 30, 2019 | 86.58 N | 117.13 E |
| January 6, 2020 | 87.10 N | 115.10 E |
| January 13, 2020 | 87.35 N | 106.63 E |
| January 20, 2020 | 87.42 N | 97.77 E |
| January 27, 2020 | 87.43 N | 95.82 E |
| February 3, 2020 | 87.42 N | 93.65 E |
| February 10, 2020 | 87.78 N | 91.52 E |
| February 17, 2020 | 88.07 N | 78.52 E |
| February 24, 2020 | 88.58 N | 52.87 E |
| March 2, 2020 | 88.17 N | 31.02 E |
| March 9, 2020 | 87.93 N | 24.20 E |
| March 16, 2020 | 86.87 N | 12.70 E |
| March 23, 2020 | 86.20 N | 15.78 E |
| March 30, 2020 | 85.37 N | 13.27 E |
| April 6, 2020 | 84.52 N | 14.38 E |
| April 13, 2020 | 84.28 N | 14.97 E |
| April 20, 2020 | 84.52 N | 14.57 E |
| April 27, 2020 | 83.93 N | 15.65 E |
| May 4, 2020 | 83.92 N | 18.03 E |
| May 11, 2020 | 83.47 N | 13.08 E |
| May 18+, 2020 | 83.32 N | 8.68 E |
| May 25+, 2020 | 82.43 N | 8.28 E |
| June 1+, 2020 | 81.33 N | 9.93 E |
| June 8+, 2020 | 78.10 N | 12.73 E |
| June 15+, 2020 | 82.20 N | 8.18 E |
| June 22, 2020 | 81.95 N | 9.27 E |
| June 29, 2020 | 82.03 N | 9.88 E |
| July 6, 2020 | 81.67 N | 5.22 E |
| July 13, 2020 | 81.40 N | 0.28 E |
| July 20, 2020 | 80.78 N | 0.42 W |
| July 27, 2020 | 79.55 N | 2.37 W |
| August 3, 2020 | 78.60 N | 4.37 W |
| August 10, 2020 | 79.90 N | 5.52 W |
| August 17+, 2020 | 88.28 N | 34.63 W |
| August 24, 2020 | 87.77 N | 105.67 E |
| August 31, 2020 | 88.30 N | 114.23 E |
| September 7, 2020 | 88.68 N | 111.57 E |
| September 14, 2020 | 89.03 N | 103.10 E |
| September 21+, 2020 | 88.37 N | 106.17 E |
| September 28+, 2020 | 83.05 N | 23.78 E |
**Day when MOSAiC reached the ice floe that the Polarstern will become frozen in and drift with for the next year.
+ Indicates when the Polarstern traveled under its own engine power (no drifting)
Log MOSAiC Data
Keep track of Arctic conditions over the course of the expedition:
**Note to students: If you are trying to access these documents in Google Drive and are unable to, it is likely because your school has blocked access. Try using a personal account to access them, or contact your teacher.
Download Data Logbook for Sept. 2019 - Dec. 2019
Download Data Logbook for Dec. 2019 - Mar. 2020
Download Data Logbook for Mar. 2020 - June 2020
Download Data Logbook for July 2020 - Oct. 2020
| Date | Length of day (hrs) | Air temperature (deg C) at location of Polarstern | Arctic Sea Ice Extent (million km2) |
| September 16, 2019 | 13.25 | High: 10 Low: 4.4 | 3.9 |
| September 23, 2019 | 12.35 | High: 6 Low: -1 | 4.1 |
| September 30, 2019 | 9.1 | -4.7 | 4.4 |
| October 4, 2019** | 6.27 | -13.0 | 4.5 |
| October 7, 2019 | 3.05 | -8.2 | 4.6 |
| October 14, 2019 | 0 | -14.7 | 4.8 |
| October 21, 2019 | 0 | -12.8 | 5.4 |
| October 28, 2019 | 0 | -18.3 | 6.8 |
| November 4, 2019 | 0 | -18.9 | 8.0 |
| November 11, 2019 | 0 | -25.5 | 8.7 |
| November 18, 2019 | 0 | -10.7 | 9.3 |
| November 25, 2019 | 0 | -18.4 | 10.0 |
| December 2, 2019 | 0 | -26.6 | 10.4 |
| December 9, 2019 | 0 | -23.1 | 11.2 |
| December 16, 2019 | 0 | -19.2 | 11.8 |
| December 23, 2019 | 0 | -26.9 | 12.2 |
| December 30, 2019 | 0 | -26.4 | 12.6 |
| January 6, 2020 | 0 | -28.0 | 13.0 |
| January 13, 2020 | 0 | -30.7 | 13.1 |
| January 20, 2020 | 0 | -27.1 | 13.6 |
| January 27, 2020 | 0 | -22.5 | 13.8 |
| February 3, 2020 | 0 | -28.8 | 14.1 |
| February 10, 2020 | 0 | -26.2 | 14.5 |
| February 17, 2020 | 0 | -31.9 | 14.4 |
| February 24, 2020 | 0 | -24.0 | 14.6 |
| March 2, 2020 | 0 | -35.5 | 14.8 |
| March 9, 2020 | 0 | -37.9 | 14.7 |
| March 16, 2020 | 10.5 | -27.5 | 14.7 |
| March 23, 2020 | 16.5 | -28.7 | 14.4 |
| March 30, 2020 | 24 | -28.6 | 14.0 |
| April 6, 2020 | 24 | -18.2 | 13.7 |
| April 13, 2020 | 24 | -25.8 | 13.6 |
| April 20, 2020 | 24 | -10.2 | 13.3 |
| April 27, 2020 | 24 | -11.7 | 12.8 |
| May 4, 2020 | 24 | -16.2 | 12.8 |
| May 11, 2020 | 24 | -10.4 | 12.4 |
| May 18, 2020 | 24 | -5.1 | 11.7 |
| May 25, 2020 | 24 | 0.4 | 11.5 |
| June 1, 2020 | 24 | 0.0 | 11.1 |
| June 8+, 2020 | 24 | -0.1 | 10.6 |
| June 15+, 2020 | 24 | -0.4 | 10.1 |
| June 22, 2020 | 24 | -0.4 | 9.6 |
| June 29, 2020 | 24 | 0.5 | 9.2 |
| July 6, 2020 | 24 | 0.6 | 8.2 |
| July 13, 2020 | 24 | 0.2 | 7.2 |
| July 20, 2020 | 24 | -0.1 | 6.2 |
| July 27, 2020 | 24 | 1.9 | 5.8 |
| August 3, 2020 | 24 | 1.2 | 5.5 |
| August 10, 2020 | 24 | 0.9 | 5.1 |
| August 17, 2020 | 24 | 0.7 | 4.6 |
| August 24, 2020 | 24 | -0.9 | 3.9 |
| August 31, 2020 | 24 | -0.9 | 3.7 |
| September 7, 2020 | 24 | -5.9 | 3.4 |
| September 14, 2020 | 24 | -0.5 | 3.8 |
| September 21, 2020 | 19.7 | -10.8 | 4.0 |
| September 28, 2020 | 10.4 | -9.2 | 4.4 |
*Note: We expect data to fall within the following ranges: Length of day, 0-24 hours; Temperature, -40 to 14 degrees C; Sea ice extent, 3-15 million km2
**Day when MOSAiC reached the ice floe that the Polarstern will become frozen in and drift with for the next year.
Is there something you'd like to see in MOSAiC Monday? Let us know!
Send us your feedback
New to MOSAiC Monday? Check out past editions!
Browse more expedition-related educational resources, videos, and blogs
Email us! mosaic@colorado.edu
 MOSAiC Monday and the NGSS
What do those funny symbols below some engagements mean?
Good news for educators in the U.S. teaching with the Next Generation Science Standards (NGSS) or similar! We will now be tagging MOSAiC Monday engagements with the NGSS Disciplinary Core Idea subject(s), Science and Engineering Practice(s), and Crosscutting Concept(s) that they most closely connect to. Look for these symbols listed below each engagement:
Disciplinary Core Idea Subjects
Science and Engineering Practices (adopted from the San Diego County Office of Education Science Resource Center)
Crosscutting Concepts (adopted from the San Diego County Office of Education Science Resource Center)