 Note to Educators: Bring MOSAiC into your virtual classroom with Reach the World
We're thrilled to announce that we will be partnering again this fall with our friends at Reach the World and Exploring by the Seat of Your Pants to help you connect your students virtually to MOSAiC team members and crew! Kicking things off in honor of 'BackyardBio Month' will be MOSAiC atmospheric scientist Dr. Jessie Creamean, who will enlighten us on who lives in the Arctic's 'backyard' and how this relates to her interest in atmospheric aerosols. Keep an eye out for Jessie's article and live video call in a couple of weeks, TBD!
Learn more about Reach the World
Go to the Reach the World MOSAiC expedition homepage
Climate Science on Ice
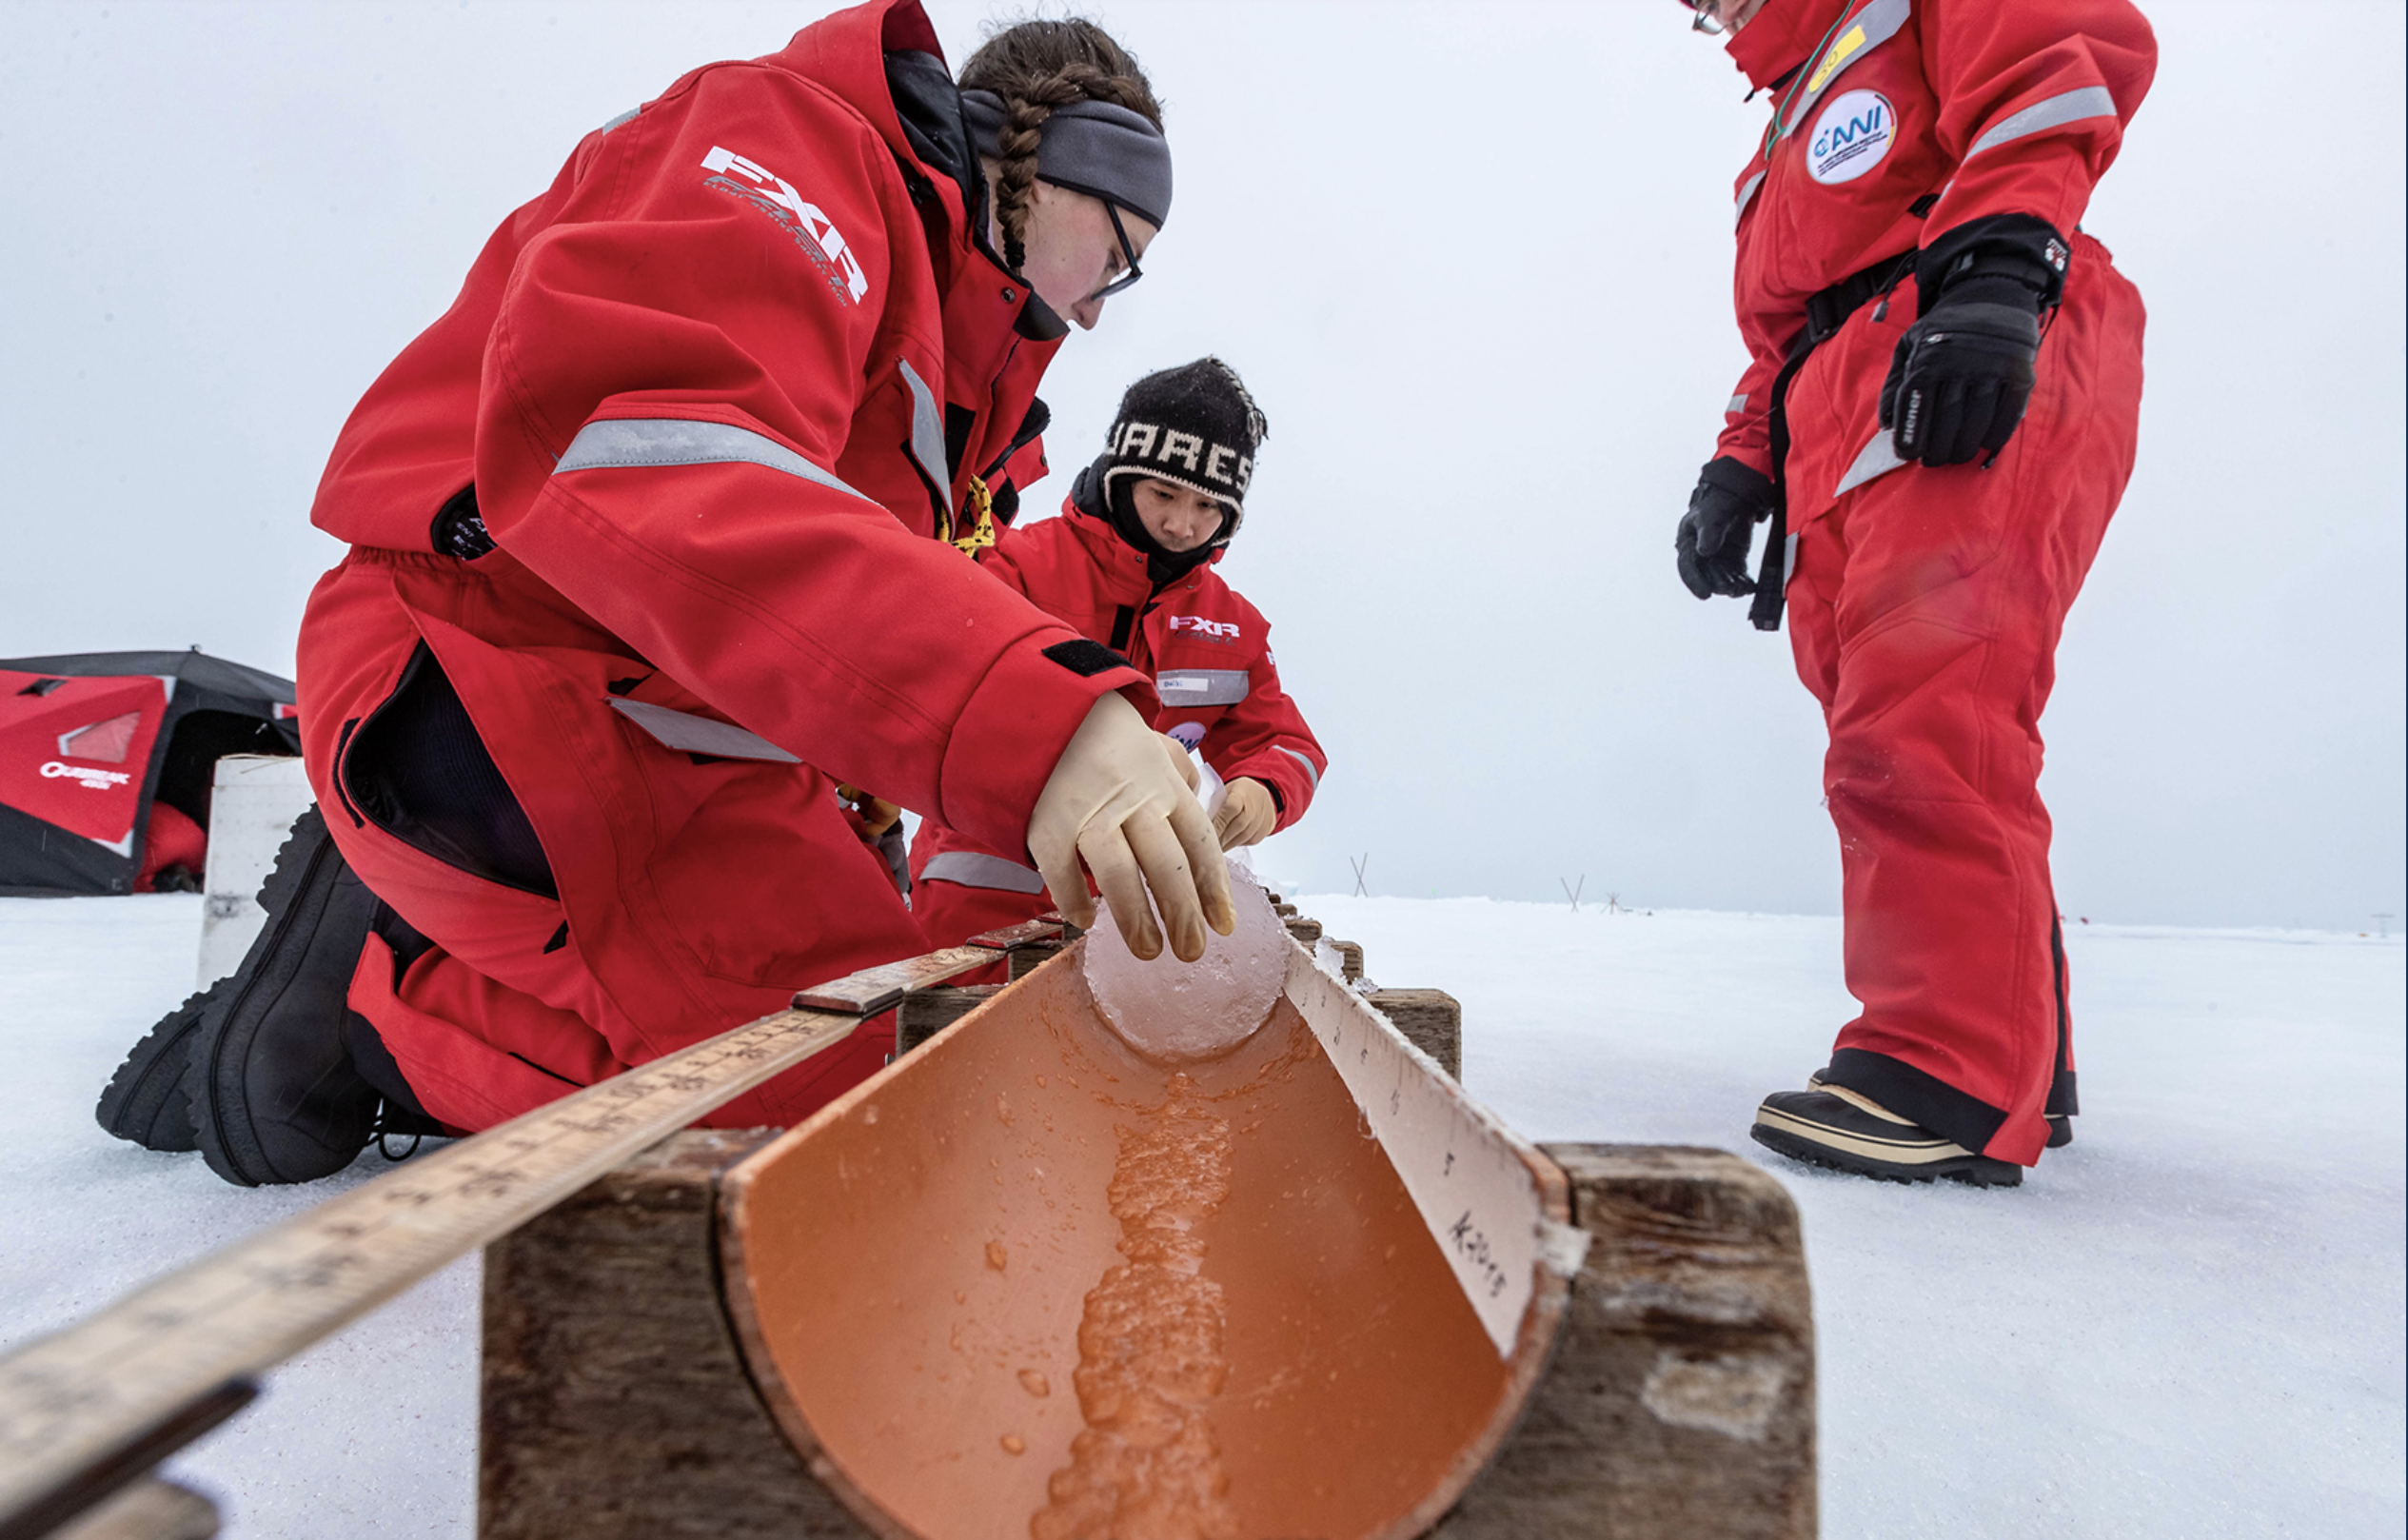
Last week, MOSAiC scientists were able to take their first ice core samples from the new floe. Ice cores are just one way that scientists try to better understand the Arctic environment and climate system--researchers are also sampling the Arctic atmosphere using weather balloons and drones and the Arctic Ocean using remotely operated vehicles (ROVs) and underwater sensors. Spending a year in the Arctic will allow scientists to better understand how the Arctic weather changes seasonally with changes in sunlight and temperature. But scientists are really interested in understanding the long term weather patterns averaged over 30 years or more--this is what we call climate, and the Arctic climate story is a compelling one. The Arctic is warming twice as fast as the global average, and in upcoming MOSAiC Mondays, we'll explore more about why this might be.
National Snow & Ice Data Center: Arctic Weather and Climate
Photo credit: Lianna Nixon, CIRES/CU Boulder
Experience MOSAiC in 360 Degrees
Helicopter on Ice
What is it like to be standing on sea ice in the Arctic? How do researchers get to and from their research sites? Watch as a helicopter lands on the ice in this 360-degree video taken by MOSAiC scientist Chris Cox during his time on the Polarstern. Click and drag for the full VR experience!
Check out other MOSAiC VR experiences
 Quick Bite: What is Climate?
To answer this question, it is helpful to contrast climate with weather. Have your students observe this map showing climate zones around the globe. Then, let them play around with this interactive map of today's weather all around the world. Ask them to share what they notice about these two maps. How do they compare or contrast? Based on what you noticed, how would you define climate and differentiate it from weather?
Video: The Climate is Changing, but How's the Weather?
![]()
![]()
![]()
Quick Bite: Climate in the Arctic
Why is the Arctic so much colder than the equator? What is the role of sunlight in the Arctic climate system?
Have your students look at two different figures that both illustrate important components of the Arctic climate system. As a class, discuss what each of the figures is showing and how these figures relate to the two questions above.
Learn more about Arctic weather and climate
![]()
![]()
![]()
![]()
![]()
![]()
 #askmosaic: Light and Dark
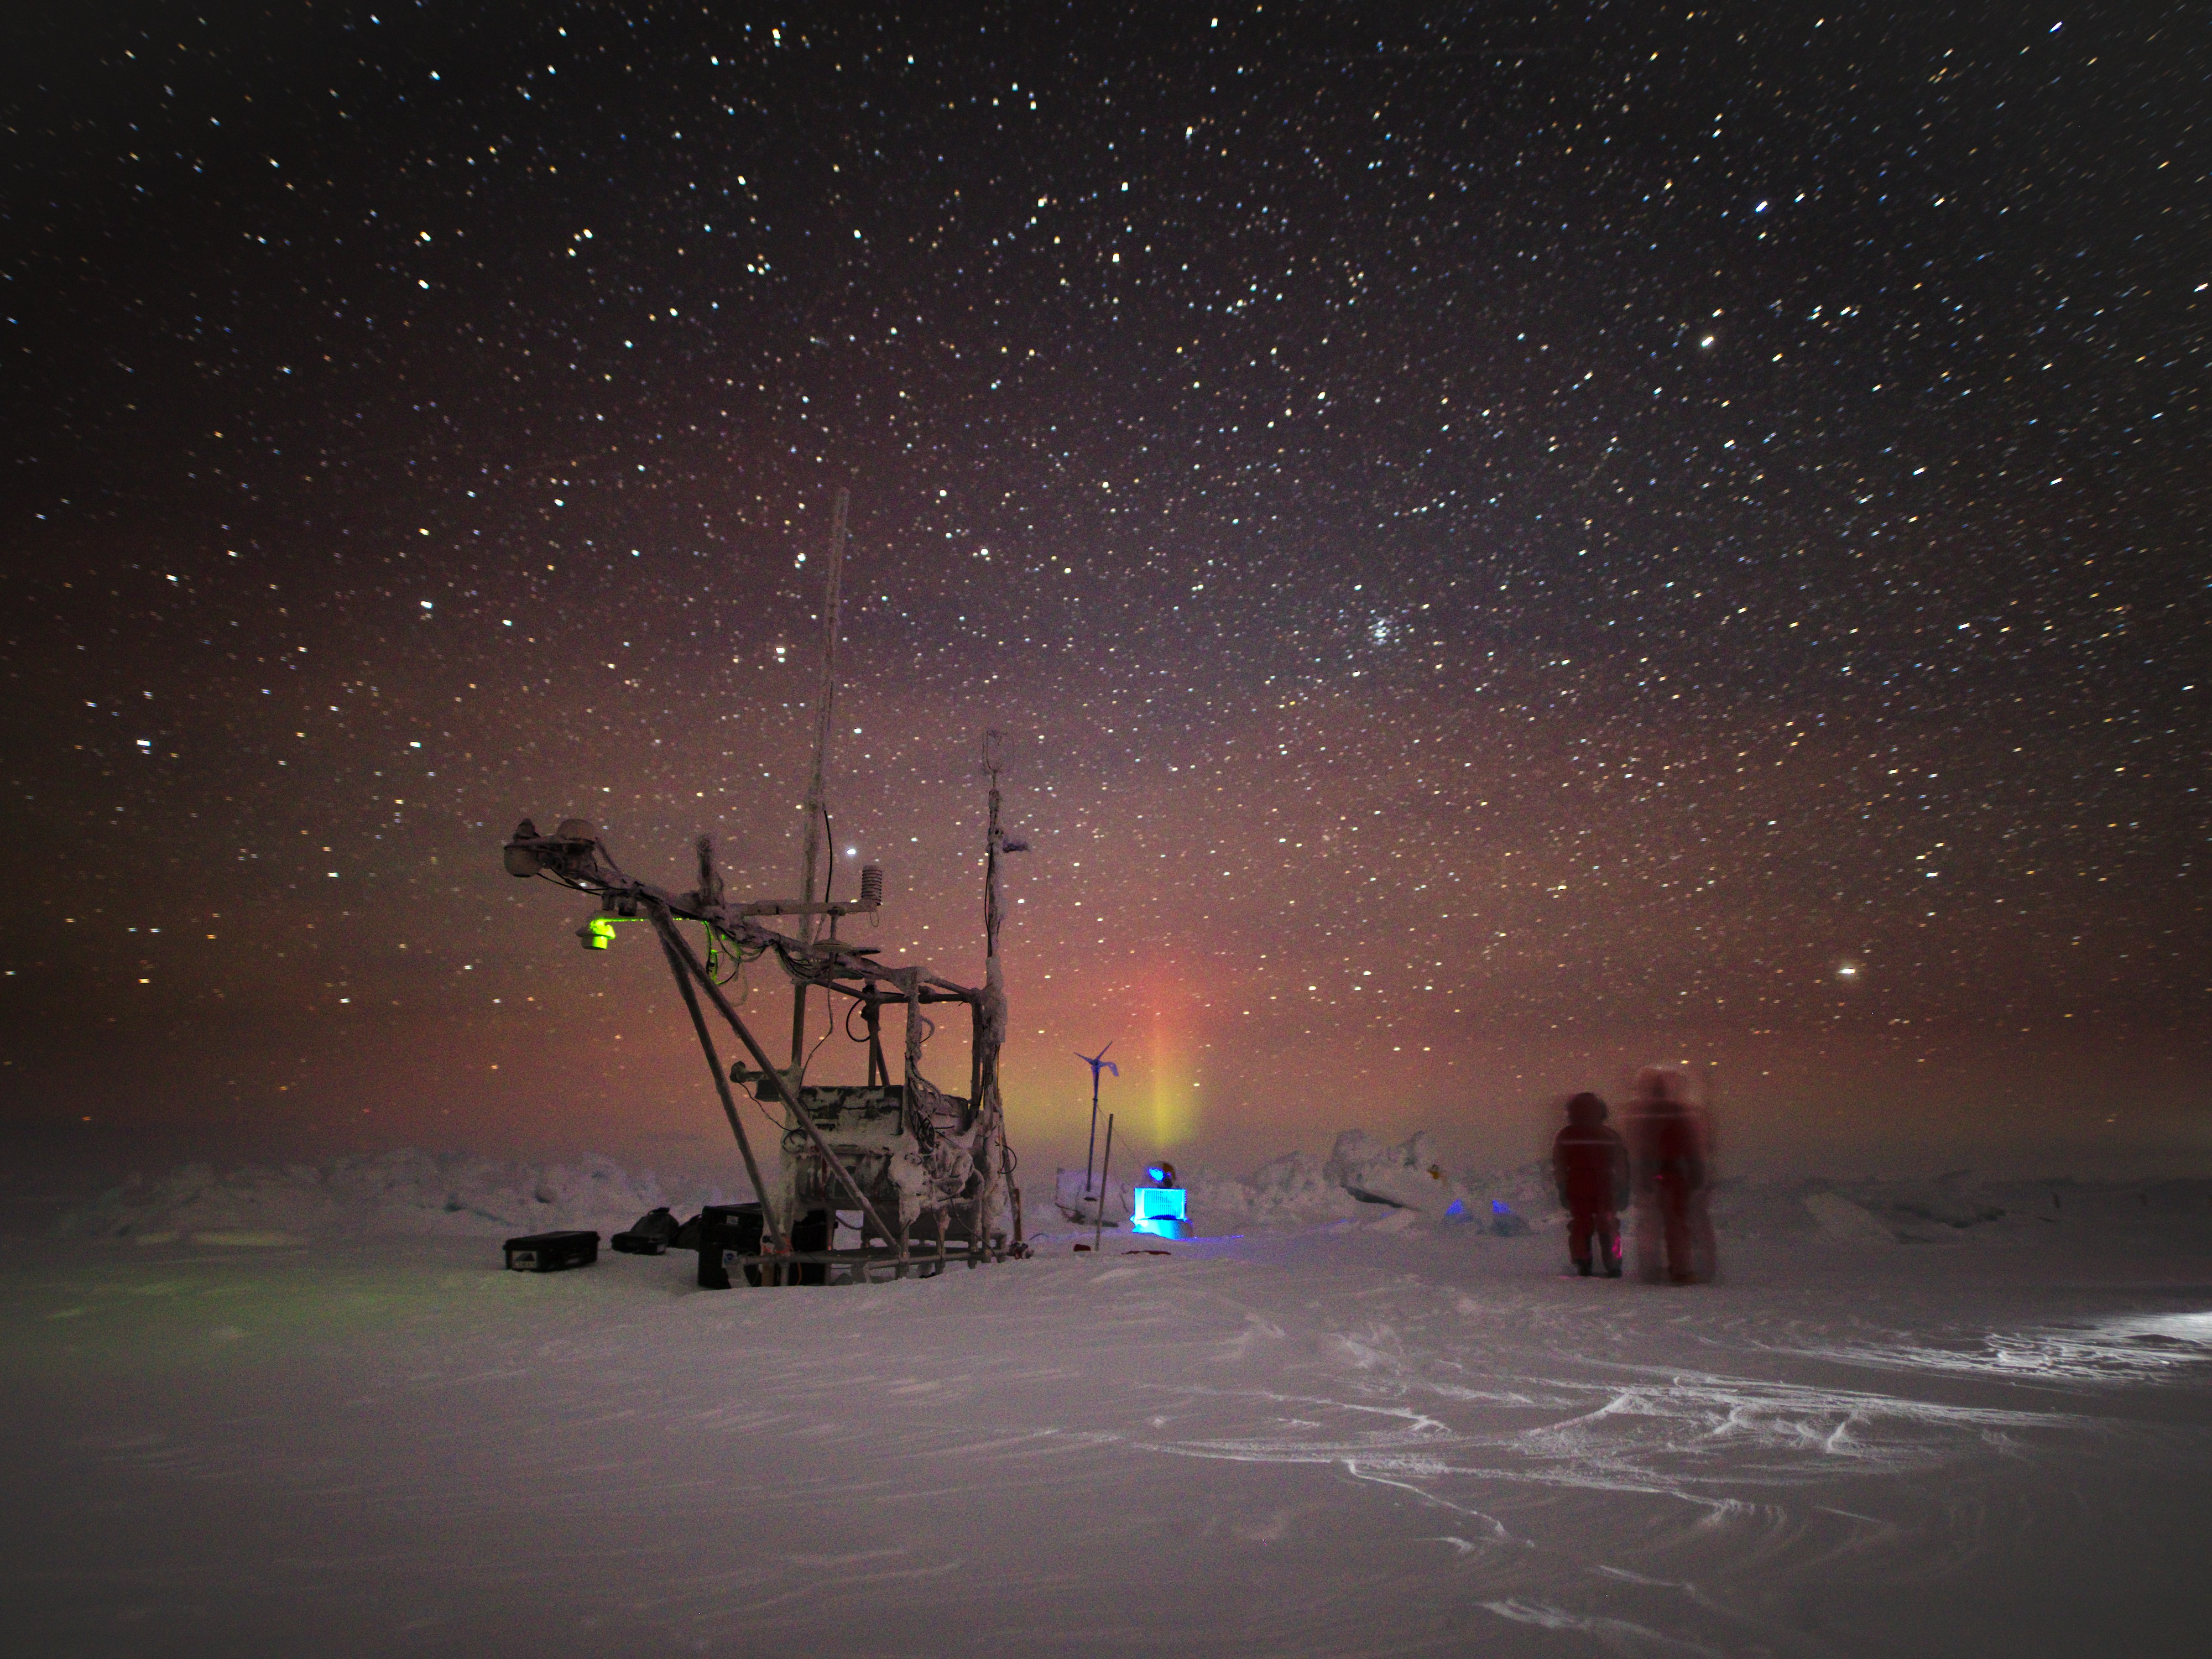
This question was sent by Charlotte from Saratoga Springs High School: I live in area with light pollution. Since you are pretty remote, how is the night sky? Is it a lot different from what you experienced in your hometown?
"The polar night seems like a long time ago. We are currently in full daylight, but this will switch over very quickly to polar night in the coming month. It happens over just a few days this far north. But of course there will still be some light until the sun descends even lower below the horizon.
I am from southern New England and even though I am don’t live near a city there is a lot of light pollution and the sky is not very dark compared to say some remote areas in northern New Hampshire. During Leg 2 when we were in the middle of the polar night there was plenty of light pollution near the ship, but if you were able to get a few kilometers away from the ship the sky was quite amazing. The background was as black as I have ever seen and stars were bright and crisp. It made them seem so much closer. When the moon was out it stood out as well. It appeared as though I could see a lot more detail than I could see back at home.
If you can’t make it to the high Arctic, try making a trip to a remote area to view the night sky. It is well worth it."
-Bob Campbell, University of Rhode Island, MOSAiC Team Eco; Bob is currently on board the Polarstern for leg 5.
Photo: MOSAiC researchers stand next to the Meteorological Sled during the polar night of leg 2; Photo credit: Dr. Michael Gallagher, michael.r.gallagher@noaa.gov
Curious about the Arctic and MOSAiC expedition? Here are three ways you can send us your #askmosaic questions:
1. Submit them
2. Email them: mosaic@colorado.edu with subject line "#askmosaic"
3. Tag us on social media: #askmosaic
 MOSAiC Weekly Tracking
Plot the Polarstern
Each week we will provide you with the latitude and longitude coordinates of the Polarstern so that you can track its journey across the Arctic.
Download the map to plot coordinates
Download a larger map of the Arctic for a bigger picture view of the expedition area
Location of the Polarstern
| Date | Latitude | Longitude |
| September 16, 2019 | 69.68 N | 18.99 E |
| September 23, 2019 | 72.31 N | 26.93 E |
| September 30, 2019 | 85.12 N | 138.05 E |
| October 4, 2019** | 85.08 N | 134.43 E |
| October 7, 2019 | 85.10 N | 133.82 E |
| October 14, 2019 | 84.85 N | 135.03 E |
| October 21, 2019 | 84.97 N | 132.73 E |
| October 28, 2019 | 85.47 N | 127.07 E |
| November 4, 2019 | 85.88 N | 121.70 E |
| November 11, 2019 | 85.82 N | 116.00 E |
| November 18, 2019 | 86.05 N | 122.43 E |
| November 25, 2019 | 85.85 N | 121.35 E |
| December 2, 2019 | 85.97 N | 112.95 E |
| December 9, 2019 | 86.25 N | 121.40 E |
| December 16, 2019 | 86.62 N | 118.12 E |
| December 23, 2019 | 86.63 N | 113.20 E |
| December 30, 2019 | 86.58 N | 117.13 E |
| January 6, 2020 | 87.10 N | 115.10 E |
| January 13, 2020 | 87.35 N | 106.63 E |
| January 20, 2020 | 87.42 N | 97.77 E |
| January 27, 2020 | 87.43 N | 95.82 E |
| February 3, 2020 | 87.42 N | 93.65 E |
| February 10, 2020 | 87.78 N | 91.52 E |
| February 17, 2020 | 88.07 N | 78.52 E |
| February 24, 2020 | 88.58 N | 52.87 E |
| March 2, 2020 | 88.17 N | 31.02 E |
| March 9, 2020 | 87.93 N | 24.20 E |
| March 16, 2020 | 86.87 N | 12.70 E |
| March 23, 2020 | 86.20 N | 15.78 E |
| March 30, 2020 | 85.37 N | 13.27 E |
| April 6, 2020 | 84.52 N | 14.38 E |
| April 13, 2020 | 84.28 N | 14.97 E |
| April 20, 2020 | 84.52 N | 14.57 E |
| April 27, 2020 | 83.93 N | 15.65 E |
| May 4, 2020 | 83.92 N | 18.03 E |
| May 11, 2020 | 83.47 N | 13.08 E |
| May 18+, 2020 | 83.32 N | 8.68 E |
| May 25+, 2020 | 82.43 N | 8.28 E |
| June 1+, 2020 | 81.33 N | 9.93 E |
| June 8+, 2020 | 78.10 N | 12.73 E |
| June 15+, 2020 | 82.20 N | 8.18 E |
| June 22, 2020 | 81.95 N | 9.27 E |
| June 29, 2020 | 82.03 N | 9.88 E |
| July 6, 2020 | 81.67 N | 5.22 E |
| July 13, 2020 | 81.40 N | 0.28 E |
| July 20, 2020 | 80.78 N | 0.42 W |
| July 27, 2020 | 79.55 N | 2.37 W |
| August 3, 2020 | 78.60 N | 4.37 W |
| August 10, 2020 | 79.90 N | 5.52 W |
| August 17+, 2020 | 88.28 N | 34.63 W |
| August 24, 2020 | 87.77 N | 105.67 E |
| August 31, 2020 | 88.30 N | 114.23 E |
| September 7, 2020 | 88.68 N | 111.57 E |
**Day when MOSAiC reached the ice floe that the Polarstern will become frozen in and drift with for the next year.
+ Indicates when the Polarstern traveled under its own engine power (no drifting)
Log MOSAiC Data
Keep track of Arctic conditions over the course of the expedition:
**Note to students: If you are trying to access these documents in Google Drive and are unable to, it is likely because your school has blocked access. Try using a personal account to access them, or contact your teacher.
Download Data Logbook for Sept. 2019 - Dec. 2019
Download Data Logbook for Dec. 2019 - Mar. 2020
Download Data Logbook for Mar. 2020 - June 2020
Download Data Logbook for July 2020 - Oct. 2020
| Date | Length of day (hrs) | Air temperature (deg C) at location of Polarstern | Arctic Sea Ice Extent (million km2) |
| September 16, 2019 | 13.25 | High: 10 Low: 4.4 | 3.9 |
| September 23, 2019 | 12.35 | High: 6 Low: -1 | 4.1 |
| September 30, 2019 | 9.1 | -4.7 | 4.4 |
| October 4, 2019** | 6.27 | -13.0 | 4.5 |
| October 7, 2019 | 3.05 | -8.2 | 4.6 |
| October 14, 2019 | 0 | -14.7 | 4.8 |
| October 21, 2019 | 0 | -12.8 | 5.4 |
| October 28, 2019 | 0 | -18.3 | 6.8 |
| November 4, 2019 | 0 | -18.9 | 8.0 |
| November 11, 2019 | 0 | -25.5 | 8.7 |
| November 18, 2019 | 0 | -10.7 | 9.3 |
| November 25, 2019 | 0 | -18.4 | 10.0 |
| December 2, 2019 | 0 | -26.6 | 10.4 |
| December 9, 2019 | 0 | -23.1 | 11.2 |
| December 16, 2019 | 0 | -19.2 | 11.8 |
| December 23, 2019 | 0 | -26.9 | 12.2 |
| December 30, 2019 | 0 | -26.4 | 12.6 |
| January 6, 2020 | 0 | -28.0 | 13.0 |
| January 13, 2020 | 0 | -30.7 | 13.1 |
| January 20, 2020 | 0 | -27.1 | 13.6 |
| January 27, 2020 | 0 | -22.5 | 13.8 |
| February 3, 2020 | 0 | -28.8 | 14.1 |
| February 10, 2020 | 0 | -26.2 | 14.5 |
| February 17, 2020 | 0 | -31.9 | 14.4 |
| February 24, 2020 | 0 | -24.0 | 14.6 |
| March 2, 2020 | 0 | -35.5 | 14.8 |
| March 9, 2020 | 0 | -37.9 | 14.7 |
| March 16, 2020 | 10.5 | -27.5 | 14.7 |
| March 23, 2020 | 16.5 | -28.7 | 14.4 |
| March 30, 2020 | 24 | -28.6 | 14.0 |
| April 6, 2020 | 24 | -18.2 | 13.7 |
| April 13, 2020 | 24 | -25.8 | 13.6 |
| April 20, 2020 | 24 | -10.2 | 13.3 |
| April 27, 2020 | 24 | -11.7 | 12.8 |
| May 4, 2020 | 24 | -16.2 | 12.8 |
| May 11, 2020 | 24 | -10.4 | 12.4 |
| May 18, 2020 | 24 | -5.1 | 11.7 |
| May 25, 2020 | 24 | 0.4 | 11.5 |
| June 1, 2020 | 24 | 0.0 | 11.1 |
| June 8+, 2020 | 24 | -0.1 | 10.6 |
| June 15+, 2020 | 24 | -0.4 | 10.1 |
| June 22, 2020 | 24 | -0.4 | 9.6 |
| June 29, 2020 | 24 | 0.5 | 9.2 |
| July 6, 2020 | 24 | 0.6 | 8.2 |
| July 13, 2020 | 24 | 0.2 | 7.2 |
| July 20, 2020 | 24 | -0.1 | 6.2 |
| July 27, 2020 | 24 | 1.9 | 5.8 |
| August 3, 2020 | 24 | 1.2 | 5.5 |
| August 10, 2020 | 24 | 0.9 | 5.1 |
| August 17, 2020 | 24 | 0.7 | 4.6 |
| August 24, 2020 | 24 | -0.9 | 3.9 |
| August 31, 2020 | 24 | -0.9 | 3.7 |
| September 7, 2020 | 24 | -5.9 | 3.4 |
*Note: We expect data to fall within the following ranges: Length of day, 0-24 hours; Temperature, -40 to 14 degrees C; Sea ice extent, 3-15 million km2
**Day when MOSAiC reached the ice floe that the Polarstern will become frozen in and drift with for the next year.
Opportunities for Students and Educators
CIRES/NOAA Science at Home Webinar Series
Join us every Tuesday at 1:00 pm from now through December for the CIRES/NOAA Science at Home webinar series! Each webinar features a 10-15 minute presentation by a scientist about how they got into science and what they do as a scientist, followed by 10-15 minutes of live Q&A.
Here is the line-up of September speakers:
September 15th - Dr. Michael Koontz will present on: Understanding where wildfires and insects kill trees using drones and satellites
September 22nd - Dr. Joshua “Shuka” Schwarz will present: Fires! Smoke! Airplanes! Action! How we're learning about wildfires and crop burning smoke
September 29th – PhD Candidate Mel Zhang will present on: Seismology: What it is and how I got into it
See the full speaker line-up on the Science at Home website
Register to receive weekly Science at Home email reminders
MOSAiC Weekly Webinar Series
Teachers, join us every Wednesday (3:30 - 4:00 pm MT) during the month of September for short (30 minute) webinars to learn more about MOSAiC virtual educational resources and how you can integrate them into your teaching. How can you introduce your students to the MOSAiC expedition with videos and ArcGIS Storymaps? How do you sign your students up for MOSAiC scientist classroom calls? How do students track the expedition? How can students submit questions directly to the scientists? All of these questions and more will be answered during these weekly webinars! Register for each webinar by clicking on the events below. Please contact jonathan.griffith@
Events:
Week 2 (9/9, 3:30-4:00 pm MT): Experience MOSAiC in virtual reality
Week 3 (9/16, 3:30-4:00 pm MT): Teaching with MOSAiC Media (videos, images, podcasts, and more!)
Week 4 (9/23, 3:30-4:00 pm MT): “Exploring the New and Old Arctic” curriculum (MS/HS unit)
Week 5 (9/30, 3:30-4:00 pm MT): “Arctic Feedbacks” curriculum (MS/HS unit)
 MOSAiC Monday and the NGSS
What do those funny symbols below some engagements mean?
Good news for educators in the U.S. teaching with the Next Generation Science Standards (NGSS) or similar! We will now be tagging MOSAiC Monday engagements with the NGSS Disciplinary Core Idea subject(s), Science and Engineering Practice(s), and Crosscutting Concept(s) that they most closely connect to. Look for these symbols listed below each engagement:
Disciplinary Core Idea Subjects
Science and Engineering Practices (adopted from the San Diego County Office of Education Science Resource Center)
Crosscutting Concepts (adopted from the San Diego County Office of Education Science Resource Center)
Is there something you'd like to see in MOSAiC Monday? Let us know!
Send us your feedback
New to MOSAiC Monday? Check out past editions!
Browse more expedition-related educational resources, videos, and blogs
Email us! mosaic@colorado.edu