Welcome Home Polarstern!
On Monday, October 12th we will welcome the Polarstern back to port after spending a year in the Arctic for the 2019-2020 MOSAiC expedition. The ship will return to Bremerhaven, a port city on Germany's North Sea coast. The ship will have traveled over 15,000 km (>9300 miles) over the course of the past year, much of that time spent passively drifting with the Arctic Ocean currents frozen in sea ice.
In the best of times and with perfect conditions, this expedition would have been a challenging and logistically complex achievement. But this past year brought many additional and some completely unexpected challenges for the expedition which it was still able to successfully continue through, including a global pandemic and unprecedented warming in the Arctic leading to the second lowest sea ice minimum on record. The data collected during this crucial field expedition by scientists who endured harsh and unforgiving working conditions and months away from their loved ones will improve our understanding of the Arctic climate system and our ability to more accurately represent the Arctic in global climate models.
In addition to the dedicated scientists, we also want to acknowledge all of the expedition crew members, logistics experts, polar bear guards, filmmakers, journalists, photographers, and educators who have been a part of this yearlong endeavor. MOSAiC was truly an international collaborative effort, and every person involved was an important piece of the puzzle. And thanks to all of the educators, students, and folks at home who have been following us over the past year!
How to Watch the Polarstern's Arrival Home
You can watch a livestream of the Polarstern's return to port and other events happening to celebrate the end of MOSAiC expedition fieldwork. Check out all of the events being hosted and broadcasted by the Alfred Wegener Institute here. Note to folks not in Europe: Many of the livestreams will be happening between 2-7 AM Eastern Time, so it might not be plausible for you to tune into the livestream, but you can still check out the recorded return during whatever time is convenient for you!
Check out all of the live-streamed events happening on Monday
Recognizing Indigenous Peoples

Monday, October 12th is Indigenous Peoples Day in the United States. It is a day to celebrate and honor Native American peoples, their histories, and their cultures. Of the nearly 4 million people live in the Arctic region, roughly 10% are Indigenous. Indigenous peoples have been practicing their traditional ways of life in the Arctic for thousands of years, but as the Arctic climate and environment is changing, these ways of life and the livelihoods of Indigenous peoples are being threatened. Thawing permafrost, decreasing sea ice, coastal erosion, and invasive species are all phenomena contributing to this threat.
On this Indigenous Peoples Day, we invite you to learn more about the Indigenous peoples of the Arctic, their intimate knowledge of and relationship with the region, and how their ways of life are being threatened by climatic and environmental change.
StoryMap: Indigenous Peoples of the Arctic
Youth Climate Story: Arctic Warming and Coastal Erosion in Alaska
What Can Indigenous People Tell Us About Climate Change?
Map: Indigenous Peoples of the Arctic Countries, Norwegian Polar Institute (click on the map for a larger view)
 Follow MOSAiC with Reach the World through November!
You can continue to connect virtually with MOSAiC team members through November with our friends at Reach the World and Exploring by the Seat of Your Pants!
Did you miss the live video call with Laura Schmidt on Monday October 5th? Not to worry! You can watch a recording of Laura's call on the RTW MOSAiC program page or on the Exploring by the Seat of Your Pants YouTube channel.
Hot off the Press: Take a Virtual Reality Tour of the MOSAiC Expedition!
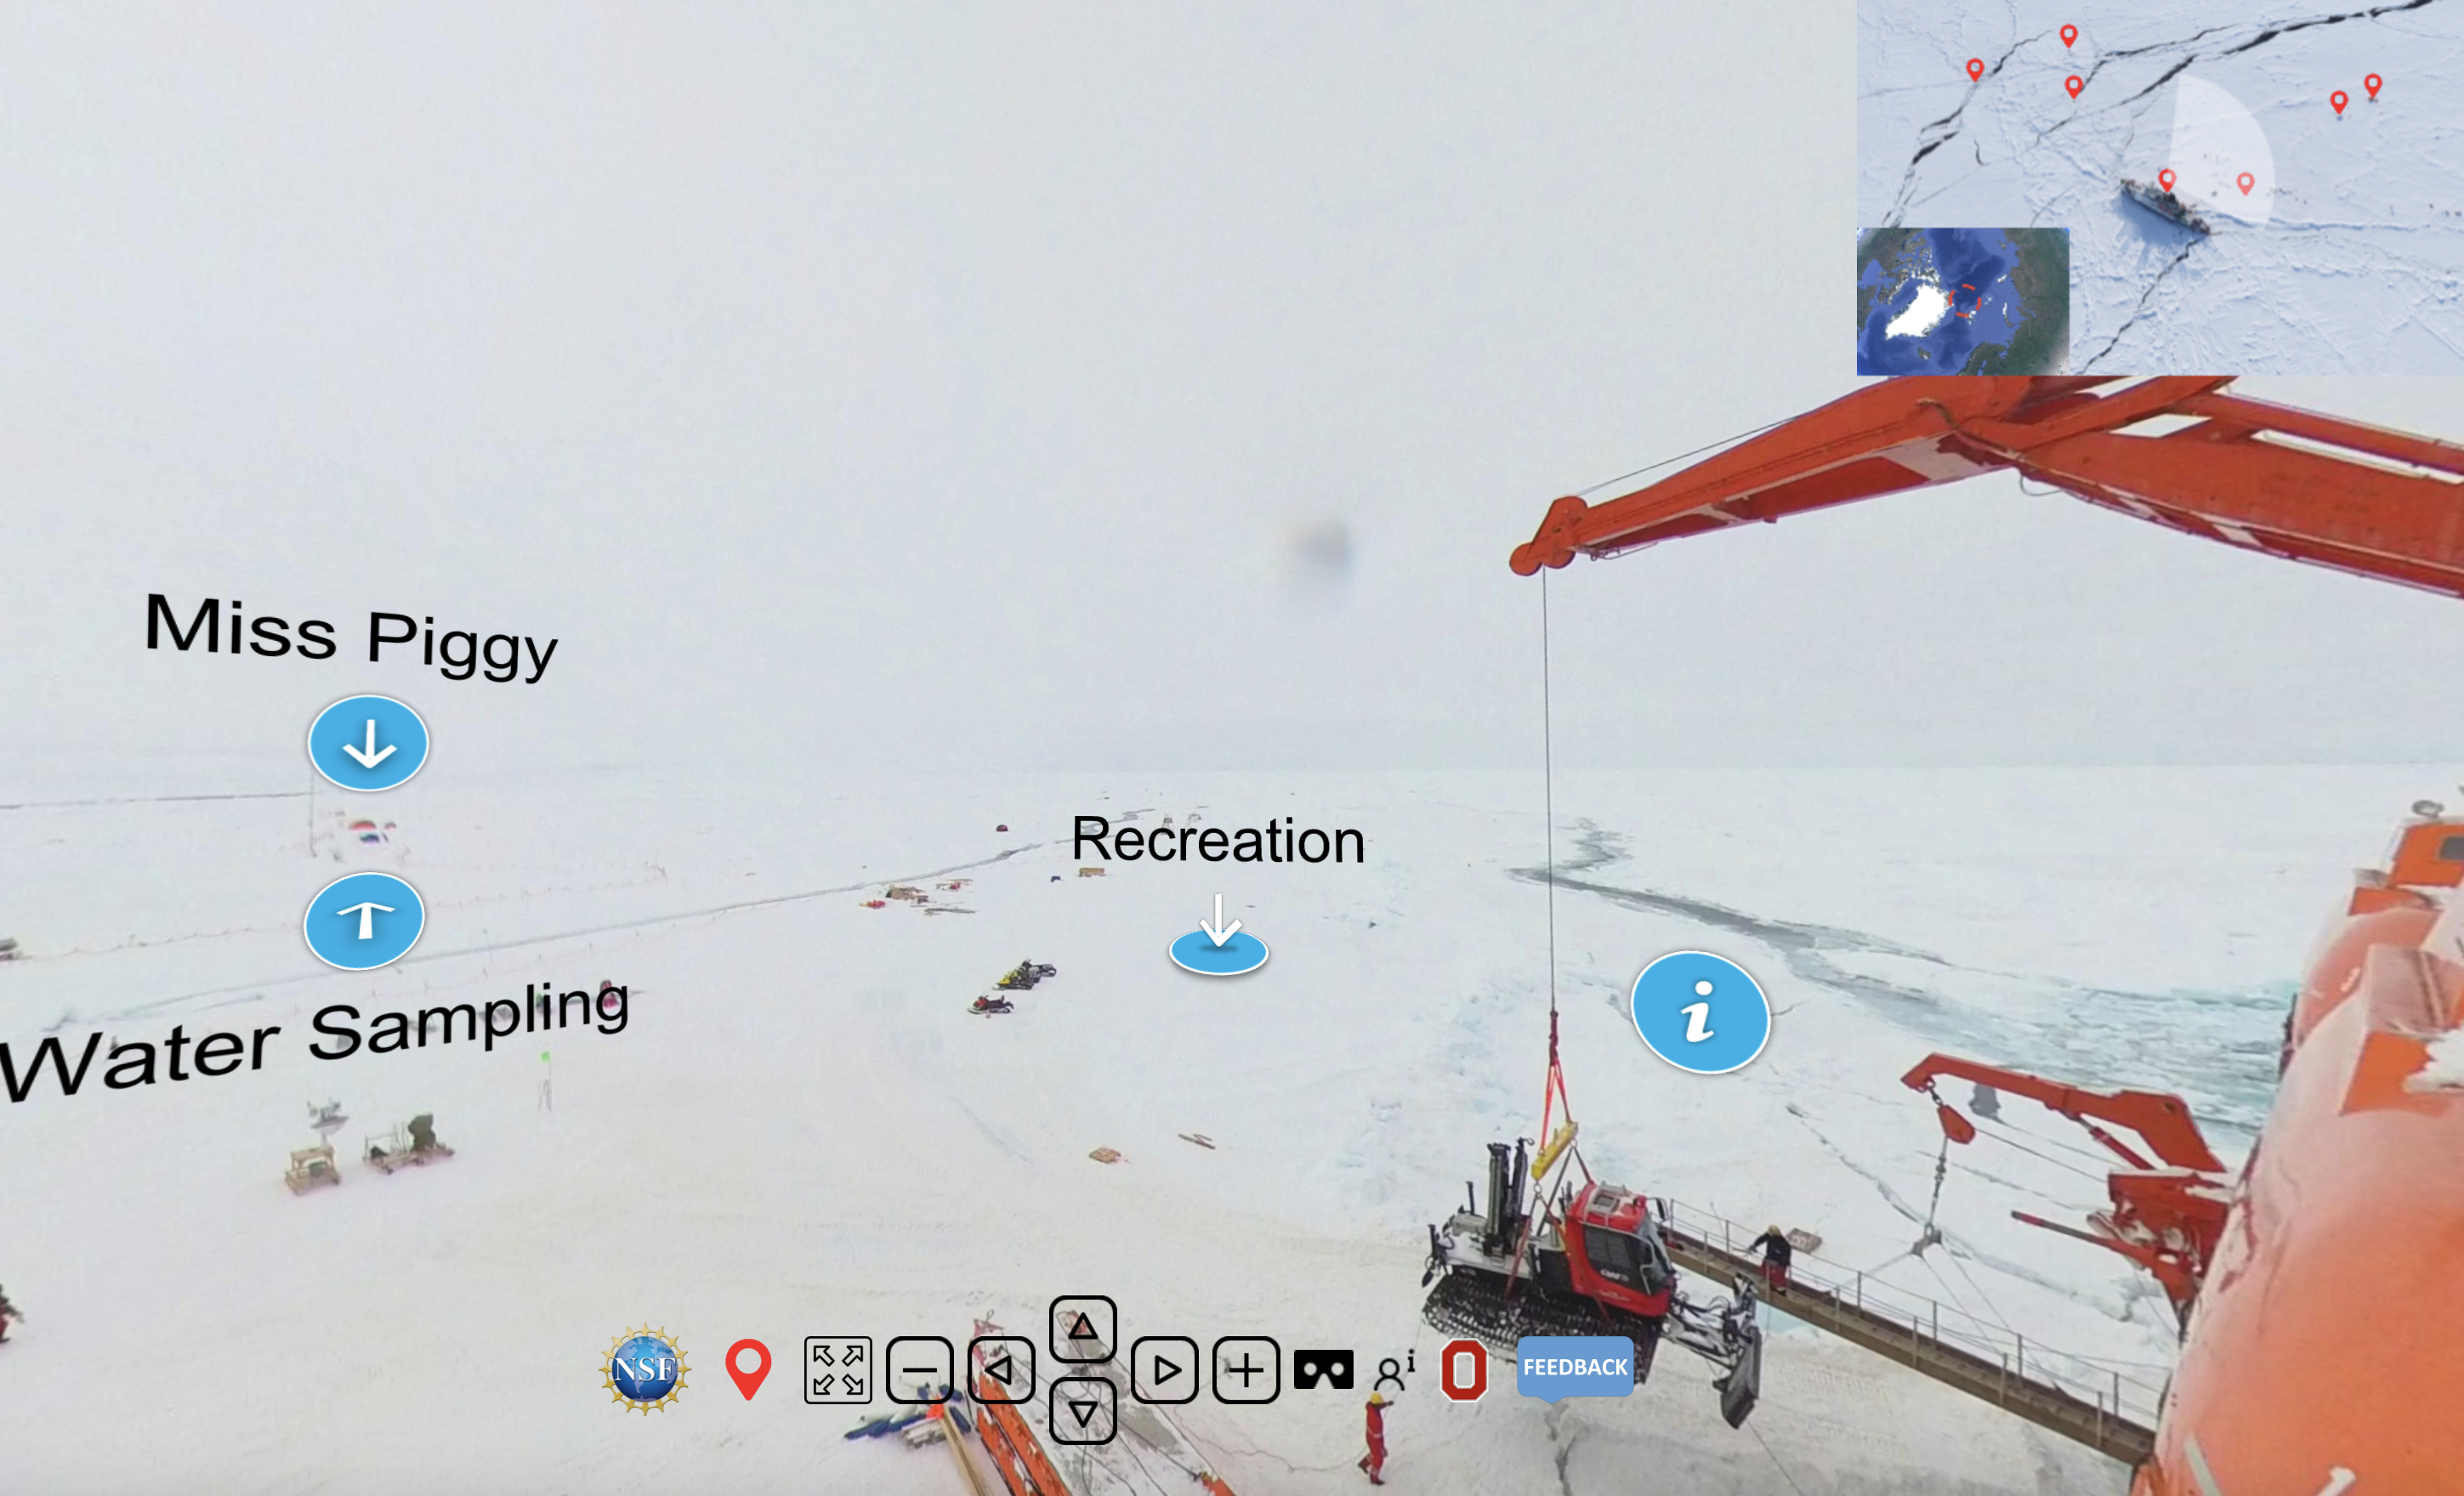
Our friends at the Byrd Polar and Climate Research Center at the Ohio State University have created an incredible virtual reality tour of the MOSAiC expedition. In this 'choose your own adventure' tour, you are able to explore the MOSAiC Ice Camp like never before and get a front row seat to the unprecedented work conducted by MOSAiC scientists!
Go to the MOSAiC Virtual Reality Tour
Check out all of our MOSAiC educational and media resources:
Activities and curricula
Photos, videos, and podcasts
Virtual reality experiences
Planetarium shows
ArcGIS StoryMaps
Museum of MOSAiC Art
 A Note to MOSAiC Monday Followers
The return of the Polarstern signifies the end of the field portion of MOSAiC, but not the end of the research efforts. In fact, much of the really crucial work--the data analysis--is just beginning. Thus, our work isn't finished either. We'll continue to bring you new and exciting educational resources related to the MOSAiC expedition, including more ArcGIS StoryMaps and activities like Data Nuggets that allow students to explore real MOSAiC expedition data in the classroom. However, starting in November, we'll be switching from MOSAiC Monday to MOSAiC Monthly, sharing new resources and news with you every month instead of every week. There's nothing that you need to do except stay subscribed to the MM newsletter!
Is there something you'd like to see in MOSAiC Monthly? Let us know! Email us at mosaic@colorado.edu
Coming up: Science@Home and CLEAN Elementary Opportunities
 Tune in weekly from now through December for the CIRES/NOAA Science at Home Webinar Series!
Join us every Tuesday at 1:00 pm MT from now through December for the CIRES/NOAA Science at Home webinar series! Each webinar features a 10-15 minute presentation by a scientist about how they got into science and what they do as a scientist, followed by 10-15 minutes of live Q&A.
Coming Up:
October 13th – Dr. Matt Druckenmiller will present on: Exchange for Local Observations and Knowledge of the Arctic (ELOKA)
October 20th – Dr. Aleya Kaushik will present on: The Arctic Carbon Cycle
See the full speaker line-up on the Science at Home website
Register to receive weekly Science at Home email reminders
 Fall 2020 Opportunity for Supporting Elementary Climate Teaching
Looking for activities for your students to do from home? Have your K-5th grade students join CLEAN (Climate Literacy & Energy Awareness Network) on October 21st at 1pm MT for a virtual live lesson about melting ice, and its relation to climate. Students will get to experiment with ice during this fun, hands-on lesson, which only requires ice, salt & pepper, as well as dark and light-colored plates if students have them! (Clear cups, a ruler, thermometer, and stopwatch are also useful but not necessary). This lesson also connects with several of the Science@Home talks by CIRES/NOAA scientists that would be appropriate for upper elementary and older students (see above).
Register here for the “The Science of Ice” live virtual lesson on Oct. 21st at 1 pm MT/3pm ET
 MOSAiC Weekly Tracking - Final Week!
Plot the Polarstern
Each week we will provide you with the latitude and longitude coordinates of the Polarstern so that you can track its journey across the Arctic.
Download the map to plot coordinates
Download a larger map of the Arctic for a bigger picture view of the expedition area
Location of the Polarstern
| Date | Latitude | Longitude |
| September 16, 2019 | 69.68 N | 18.99 E |
| September 23, 2019 | 72.31 N | 26.93 E |
| September 30, 2019 | 85.12 N | 138.05 E |
| October 4, 2019** | 85.08 N | 134.43 E |
| October 7, 2019 | 85.10 N | 133.82 E |
| October 14, 2019 | 84.85 N | 135.03 E |
| October 21, 2019 | 84.97 N | 132.73 E |
| October 28, 2019 | 85.47 N | 127.07 E |
| November 4, 2019 | 85.88 N | 121.70 E |
| November 11, 2019 | 85.82 N | 116.00 E |
| November 18, 2019 | 86.05 N | 122.43 E |
| November 25, 2019 | 85.85 N | 121.35 E |
| December 2, 2019 | 85.97 N | 112.95 E |
| December 9, 2019 | 86.25 N | 121.40 E |
| December 16, 2019 | 86.62 N | 118.12 E |
| December 23, 2019 | 86.63 N | 113.20 E |
| December 30, 2019 | 86.58 N | 117.13 E |
| January 6, 2020 | 87.10 N | 115.10 E |
| January 13, 2020 | 87.35 N | 106.63 E |
| January 20, 2020 | 87.42 N | 97.77 E |
| January 27, 2020 | 87.43 N | 95.82 E |
| February 3, 2020 | 87.42 N | 93.65 E |
| February 10, 2020 | 87.78 N | 91.52 E |
| February 17, 2020 | 88.07 N | 78.52 E |
| February 24, 2020 | 88.58 N | 52.87 E |
| March 2, 2020 | 88.17 N | 31.02 E |
| March 9, 2020 | 87.93 N | 24.20 E |
| March 16, 2020 | 86.87 N | 12.70 E |
| March 23, 2020 | 86.20 N | 15.78 E |
| March 30, 2020 | 85.37 N | 13.27 E |
| April 6, 2020 | 84.52 N | 14.38 E |
| April 13, 2020 | 84.28 N | 14.97 E |
| April 20, 2020 | 84.52 N | 14.57 E |
| April 27, 2020 | 83.93 N | 15.65 E |
| May 4, 2020 | 83.92 N | 18.03 E |
| May 11, 2020 | 83.47 N | 13.08 E |
| May 18+, 2020 | 83.32 N | 8.68 E |
| May 25+, 2020 | 82.43 N | 8.28 E |
| June 1+, 2020 | 81.33 N | 9.93 E |
| June 8+, 2020 | 78.10 N | 12.73 E |
| June 15+, 2020 | 82.20 N | 8.18 E |
| June 22, 2020 | 81.95 N | 9.27 E |
| June 29, 2020 | 82.03 N | 9.88 E |
| July 6, 2020 | 81.67 N | 5.22 E |
| July 13, 2020 | 81.40 N | 0.28 E |
| July 20, 2020 | 80.78 N | 0.42 W |
| July 27, 2020 | 79.55 N | 2.37 W |
| August 3, 2020 | 78.60 N | 4.37 W |
| August 10, 2020 | 79.90 N | 5.52 W |
| August 17+, 2020 | 88.28 N | 34.63 W |
| August 24, 2020 | 87.77 N | 105.67 E |
| August 31, 2020 | 88.30 N | 114.23 E |
| September 7, 2020 | 88.68 N | 111.57 E |
| September 14, 2020 | 89.03 N | 103.10 E |
| September 21+, 2020 | 88.37 N | 106.17 E |
| September 28+, 2020 | 83.05 N | 23.78 E |
| October 5+, 2020 | 77.65 N | 8.42 E |
| October 12, 2020 | TBD | TBD |
**Day when MOSAiC reached the ice floe that the Polarstern will become frozen in and drift with for the next year.
+ Indicates when the Polarstern traveled under its own engine power (no drifting)
Log MOSAiC Data
Keep track of Arctic conditions over the course of the expedition:
**Note to students: If you are trying to access these documents in Google Drive and are unable to, it is likely because your school has blocked access. Try using a personal account to access them, or contact your teacher.
Download Data Logbook for Sept. 2019 - Dec. 2019
Download Data Logbook for Dec. 2019 - Mar. 2020
Download Data Logbook for Mar. 2020 - June 2020
Download Data Logbook for July 2020 - Oct. 2020
| Date | Length of day (hrs) | Air temperature (deg C) at location of Polarstern | Arctic Sea Ice Extent (million km2) |
| September 16, 2019 | 13.25 | High: 10 Low: 4.4 | 3.9 |
| September 23, 2019 | 12.35 | High: 6 Low: -1 | 4.1 |
| September 30, 2019 | 9.1 | -4.7 | 4.4 |
| October 4, 2019** | 6.27 | -13.0 | 4.5 |
| October 7, 2019 | 3.05 | -8.2 | 4.6 |
| October 14, 2019 | 0 | -14.7 | 4.8 |
| October 21, 2019 | 0 | -12.8 | 5.4 |
| October 28, 2019 | 0 | -18.3 | 6.8 |
| November 4, 2019 | 0 | -18.9 | 8.0 |
| November 11, 2019 | 0 | -25.5 | 8.7 |
| November 18, 2019 | 0 | -10.7 | 9.3 |
| November 25, 2019 | 0 | -18.4 | 10.0 |
| December 2, 2019 | 0 | -26.6 | 10.4 |
| December 9, 2019 | 0 | -23.1 | 11.2 |
| December 16, 2019 | 0 | -19.2 | 11.8 |
| December 23, 2019 | 0 | -26.9 | 12.2 |
| December 30, 2019 | 0 | -26.4 | 12.6 |
| January 6, 2020 | 0 | -28.0 | 13.0 |
| January 13, 2020 | 0 | -30.7 | 13.1 |
| January 20, 2020 | 0 | -27.1 | 13.6 |
| January 27, 2020 | 0 | -22.5 | 13.8 |
| February 3, 2020 | 0 | -28.8 | 14.1 |
| February 10, 2020 | 0 | -26.2 | 14.5 |
| February 17, 2020 | 0 | -31.9 | 14.4 |
| February 24, 2020 | 0 | -24.0 | 14.6 |
| March 2, 2020 | 0 | -35.5 | 14.8 |
| March 9, 2020 | 0 | -37.9 | 14.7 |
| March 16, 2020 | 10.5 | -27.5 | 14.7 |
| March 23, 2020 | 16.5 | -28.7 | 14.4 |
| March 30, 2020 | 24 | -28.6 | 14.0 |
| April 6, 2020 | 24 | -18.2 | 13.7 |
| April 13, 2020 | 24 | -25.8 | 13.6 |
| April 20, 2020 | 24 | -10.2 | 13.3 |
| April 27, 2020 | 24 | -11.7 | 12.8 |
| May 4, 2020 | 24 | -16.2 | 12.8 |
| May 11, 2020 | 24 | -10.4 | 12.4 |
| May 18, 2020 | 24 | -5.1 | 11.7 |
| May 25, 2020 | 24 | 0.4 | 11.5 |
| June 1, 2020 | 24 | 0.0 | 11.1 |
| June 8+, 2020 | 24 | -0.1 | 10.6 |
| June 15+, 2020 | 24 | -0.4 | 10.1 |
| June 22, 2020 | 24 | -0.4 | 9.6 |
| June 29, 2020 | 24 | 0.5 | 9.2 |
| July 6, 2020 | 24 | 0.6 | 8.2 |
| July 13, 2020 | 24 | 0.2 | 7.2 |
| July 20, 2020 | 24 | -0.1 | 6.2 |
| July 27, 2020 | 24 | 1.9 | 5.8 |
| August 3, 2020 | 24 | 1.2 | 5.5 |
| August 10, 2020 | 24 | 0.9 | 5.1 |
| August 17, 2020 | 24 | 0.7 | 4.6 |
| August 24, 2020 | 24 | -0.9 | 3.9 |
| August 31, 2020 | 24 | -0.9 | 3.7 |
| September 7, 2020 | 24 | -5.9 | 3.4 |
| September 14, 2020 | 24 | -0.5 | 3.8 |
| September 21, 2020 | 19.7 | -10.8 | 4.0 |
| September 28, 2020 | 10.4 | -9.2 | 4.4 |
| October 5, 2020 | 9.4 | 5.1 | 4.7 |
| October 12, 2020 | TBD | TBD | TBD |
*Note: We expect data to fall within the following ranges: Length of day, 0-24 hours; Temperature, -40 to 14 degrees C; Sea ice extent, 3-15 million km2
**Day when MOSAiC reached the ice floe that the Polarstern will become frozen in and drift with for the next year.
Is there something you'd like to see in MOSAiC Monday? Let us know!
Send us your feedback
New to MOSAiC Monday? Check out past editions!
Browse more expedition-related educational resources, videos, and blogs
Email us! mosaic@colorado.edu