Analyzing and interpreting data
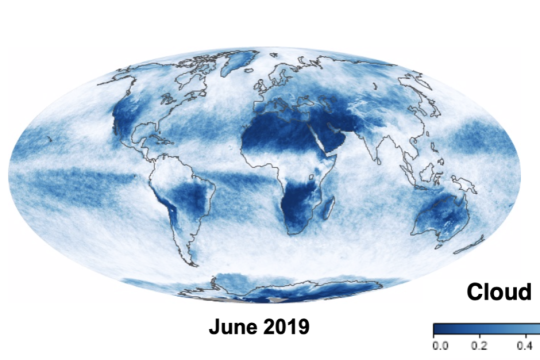
Quick Bite: Clouds in the Summer, Clouds in the Winter?
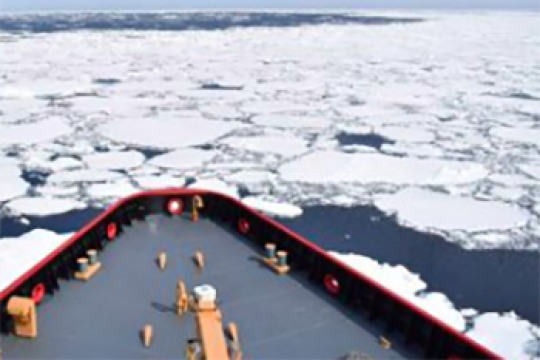
Is there seasonal variation in cloud cover in the Arctic? Learn more in this Quick Bite activity. Figure credit: NASA Earth Observatory
Quick bite
Subject: Analyzing and interpreting data, Atmosphere, Earth science, mosaic monday
Grade Level: Middle School, High School
Developer: CIRES
Is there seasonal variation in cloud cover in the Arctic? Learn more in this Quick Bite activity. Figure credit: NASA Earth Observatory
Quick bite
Subject: Analyzing and interpreting data, Atmosphere, Earth science, mosaic monday
Grade Level: Middle School, High School
Developer: CIRES
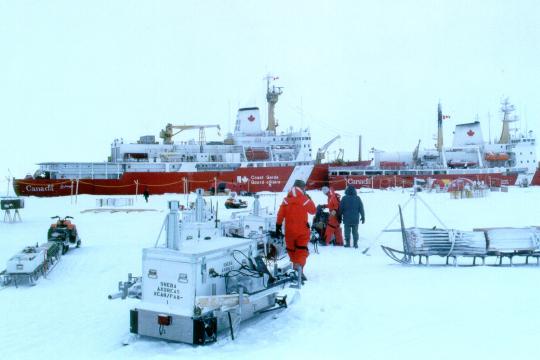
Quick Bite: Correlation, Causation, and Clouds
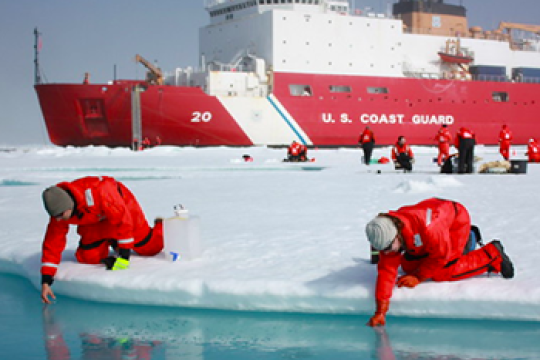
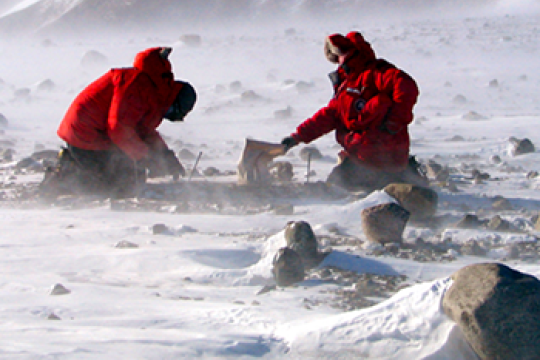
In this Quick Bite activity, students will examine actual data from the SHEBA Arctic research expedition to see if there is a correlation between surface temperature in the Arctic and cloud cover. Photo credit: Don Perovich
Project of Mosaic Quick bite
Subject: Analyzing and interpreting data, Atmosphere, Expeditions, mosaic monday
Grade Level: Middle School, High School
Developer: CIRES
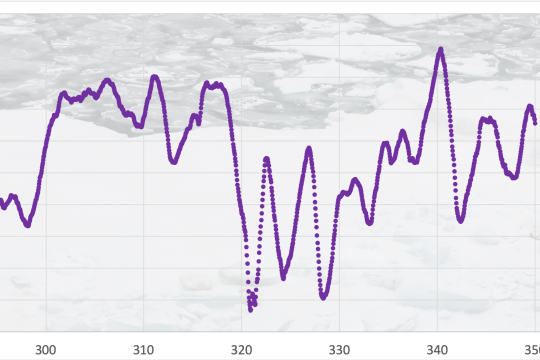
Quick Bite: Weathering the Storms
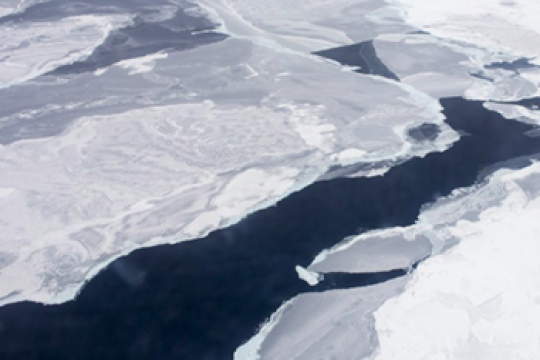
Scientists on the 2019-2020 MOSAiC expedition were interested in collecting air pressure data, as air pressure can give you an indication of weather changes. Can you identify changes in weather from actual air pressure data from the MOSAiC expedition?
Project of Mosaic Quick bite
Subject: Analyzing and interpreting data, Atmosphere, Expeditions, mosaic monday
Grade Level: Middle School, High School
Developer: CIRES
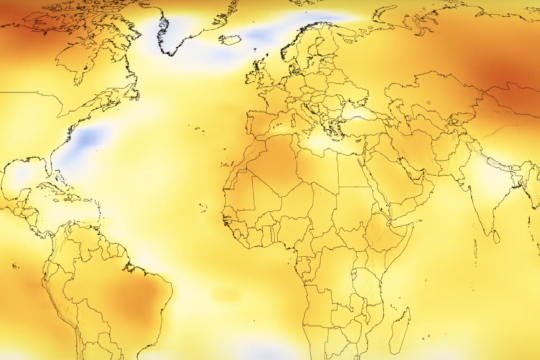
Quick Bite: You're Getting Warmer...
Looking at how global temperatures have changed over time can give us valuable insight into our planet's health. In this Quick Bite activity, students watch an animation of global temperature anomalies over time to discover that something strange is going on in the Arctic.
Project of Mosaic Quick bite
Subject: Analyzing and interpreting data, Climate, Earth science, Geography, mosaic monday
Grade Level: Middle School, High School, University/college
Developer: CIRES
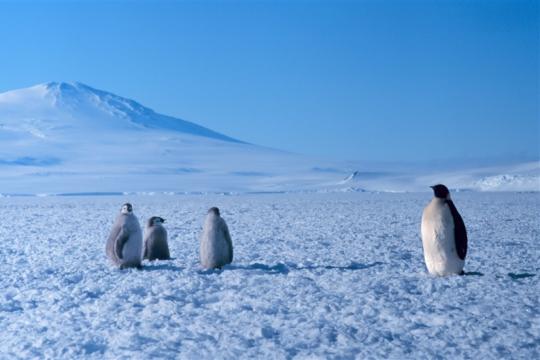
Project PARKA (Planting AntaRtica in KAnsas)
Explore this unit composed of four lessons designed to provide high school students with the background knowledge and understanding of the ocean, Antarctic science, food webs, climate change, and ocean acidification. Photo by Michael Van Woert, NOAA/NESDIA
NGSS Aligned Lesson plan
Subject: Analyzing and interpreting data, Arguing from evidence, Climate, Computational thinking, Constructing explanations, Earth science, Ecosystems, Life science, Oceans and ocean circulation
Grade Level: High School
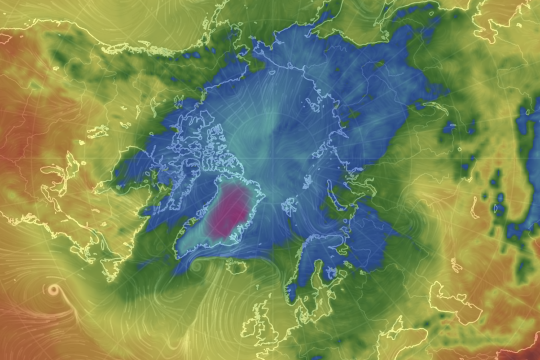
Fluid Earth Viewer
Explore atmospheric and oceanographic conditions in the Arctic or anywhere else on the globe with this incredible data visualization tool.
Data visualization
Subject: Analyzing and interpreting data, Atmosphere, Earth science, Geography, Oceans and ocean circulation
Grade Level: 3-5, Middle School, High School, University/college, Adult
Developer: Byrd Polar and Climate Research Center
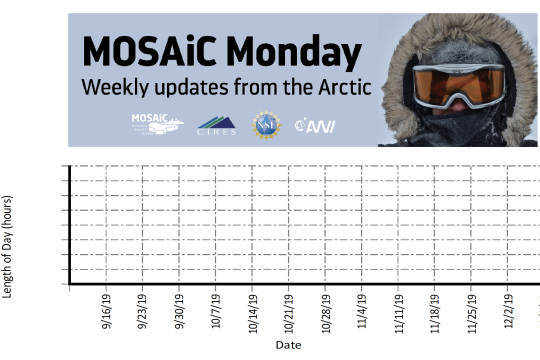
MOSAiC Data Logbook
Your students can be MOSAiC scientists by analyzing real-time data from the expedition each week. Download the MOSAiC Data Log Book and look for the data in each MOSAiC Monday newsletter throughout the expedition. Over time, your students will be able to use the data they've graphed to make interpretations about seasonality in the Arctic and Arctic weather conditions. *Note: We expect data to fall within the following ranges: Length of Day: 0 to 24 hours Temperature: -40 to 14 °C Sea Ice Extent: 3 to 15 million km2 Download the MOSAiC Data Log Book
Project of Mosaic Quick bite
Subject: Analyzing and interpreting data, Earth science, Expeditions
Grade Level: K-2, 3-5, Middle School, High School, University/college
Developer: CIRES
Sea Ice Predictive Model
Using sea ice extent and carbon dioxide data, students make predictions about future sea ice extent using simple statistics to evaluate a linear relationship. Students compare Arctic and Antarctic conditions.
Lesson plan
Subject: Analyzing and interpreting data, Climate, Computational thinking, Sea ice
Grade Level: High School, University/college
Developer: Joceline Boucher, SERC
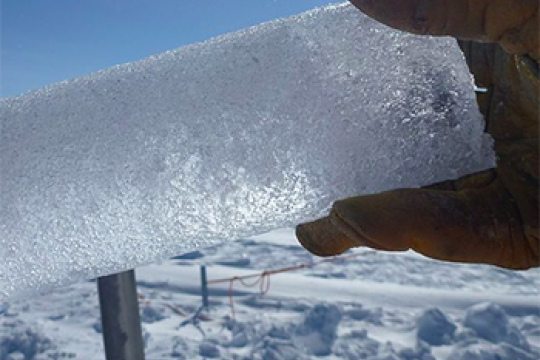
Create Classroom Ice Cores
Students analyze two different ice core models (made of layers of ice frozen in pringles cans) to observe changes in past climates.
Lesson plan
Subject: Analyzing and interpreting data, Climate, Earth science, Engineering and technology, Physical science
Grade Level: Middle School, High School
Developer: Byrd Polar and Climate Research Center
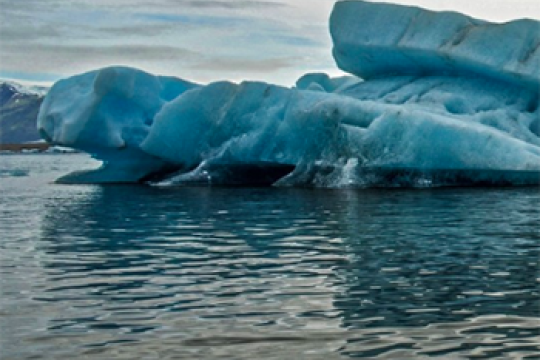
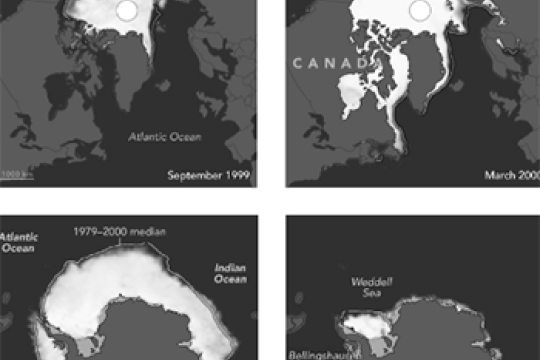
Impacts of a Warming Arctic
Using NASA data, learners evaluate evidence for decreasing ice in the Arctic and explore the impact of global climate change on the Arctic.
Lesson plan
Subject: Analyzing and interpreting data, Atmosphere, Climate, Constructing explanations, Earth science, Sea ice
Grade Level: Middle School, High School, University/college, Adult
Developer: NASA
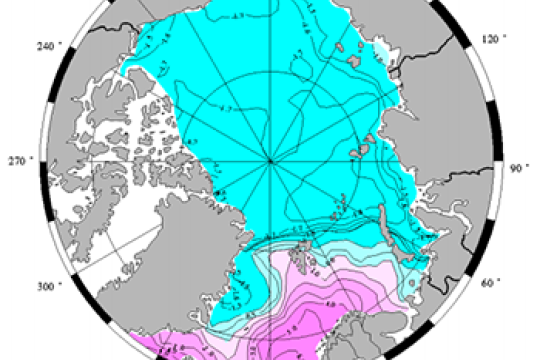
Arctic Ocean Exploration: Current Events
Using authentic data and two hands on activities, students explore the driving forces for ocean currents, with a focus on the Arctic Ocean.
Lesson plan
Subject: Analyzing and interpreting data, Developing and using models, Earth science, Oceans and ocean circulation, Physical science, Sea ice
Grade Level: High School
Developer: NOAA
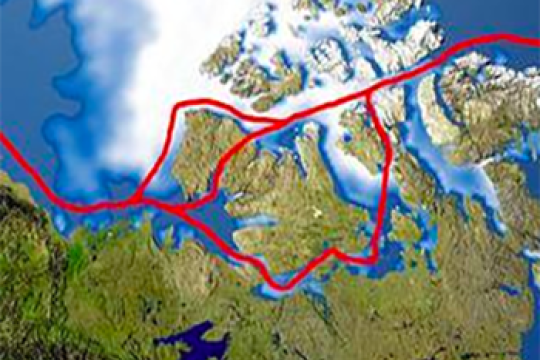
Northwest Passage
Students use Google Earth to explore changing ice conditions in the Arctic, and how these changing conditions affect shipping routes, fossil fuel extraction, geopolitics, and other Arctic issues.
Lesson plan
Subject: Analyzing and interpreting data, Climate, Geography, Geopolitics, Sea ice
Grade Level: High School, University/college
Developer: Glenn Richard, SERC
Arctic Climate Curriculum: Exploring the Arctic
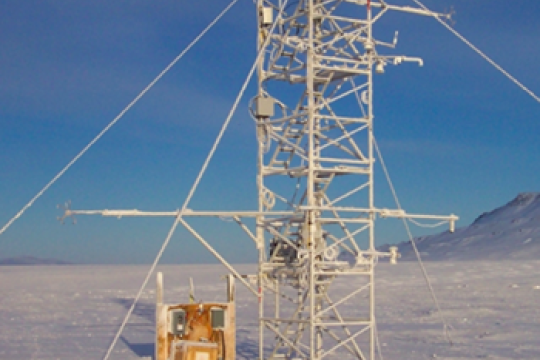
This activity introduces students to the Arctic, including different definitions of the Arctic and exploration of the Arctic environment and Arctic people. Students set out on a virtual exploration of the geography of the Arctic using Google Earth. Students go on to learn about meteorological parameters that are measured by Arctic research teams and practice the measurements in hands-on activities.
Lesson plan
Subject: Analyzing and interpreting data, Arguing from evidence, Asking questions, Computational thinking, Earth science, Geography, Life science, Obtaining and evaluating information, Physical science, Planning investigations
Grade Level: Middle School, High School, University/college
Developer: CIRES
Arctic Ocean Exploration: Would You Like a Sample?
Students simulate a sampling of Arctic marine biology communities to learn about the limitations of biologic sampling techniques and marine biodiversity in the Arctic Ocean.
Lesson plan
Subject: Analyzing and interpreting data, Arguing from evidence, Ecosystems, Life science, Oceans and ocean circulation
Grade Level: Middle School
Developer: NOAA
Arctic Ocean Exploration: Being Productive in the Arctic Ocean
Students analyze sea ice cover, nutrient, and primary productivity data to understand factors that may limit primary productivity in the Arctic Ocean.
Lesson plan
Subject: Analyzing and interpreting data, Arguing from evidence, Ecosystems, Life science, Oceans and ocean circulation, Sea ice
Grade Level: High School
Developer: NOAA
Polar Bear Tracker
Students will explore the world of polar bear researchers through the PBI Bear Tracker webpage and the Bear Tracker PowerPoint. They will understand how polar bears are studied using radio collar tracking and track bears in real time. Through the inquiry process, create scientific investigable questions just like real researchers, and learn how you can take action to help polar bears.
Lesson plan
Subject: Analyzing and interpreting data, Asking questions, Climate, Ecosystems, Life science
Grade Level: Middle School, High School
Developer: Polar Bears International
Arctic Climate Curriculum: Exploring Arctic Climate Data
Students dig into authentic Arctic climate data to unravel some causes and effects related to the seasonal melting of the snowpack. In particular, students learn about albedo and its relationship to snowmelt. This concept applied to global climate change on a large scale as well, and students go on to learn about the role of albedo as a self-reinforcing feedback mechanism.
NGSS Aligned Lesson plan
Subject: Analyzing and interpreting data, Arguing from evidence, Climate, Computational thinking, Constructing explanations, Earth science, Physical science
Grade Level: Middle School, High School, University/college
Developer: CIRES
Arctic Climate Curriculum: Do you really want to visit the Arctic?
This jigsaw activity is designed for students to become familiar with several datasets of Arctic weather data, collected in Eureka on Ellesmere Island. Students join a role-playing activity to read and interpret graphs while considering the optimal time to plan a research mission to the Arctic.
NGSS Aligned Lesson plan
Subject: Analyzing and interpreting data, Arguing from evidence, Asking questions, Climate, Computational thinking, Constructing explanations, Earth science, Obtaining and evaluating information, Physical science
Grade Level: Middle School, High School, University/college
Developer: CIRES
Albedo: measuring the reflective properties of different surfaces
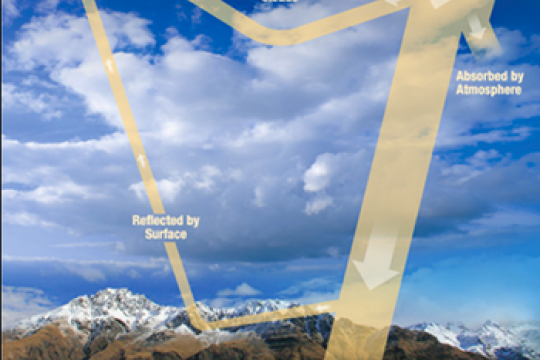
Students measure the albedo and surface temperature of various ice surfaces and changing processes as the ice melts over time. Students apply what they’ve learned in the experiment to the understanding of albedo, and the role albedo plays in the Earth’s energy budget.
NGSS Aligned Lesson plan
Subject: Analyzing and interpreting data, Asking questions, Developing and using models, Earth science, Obtaining and evaluating information, Physical science, Planning investigations, Sea ice
Grade Level: Middle School, High School, University/college
Developer: U.S. Ice Drilling Program